Past IEM Features tagged: pressure
Tonga wave passage #4
19 Jan 2022 05:25 AMContinuing the series of feature posts showing the passages of waves associated with the Hunga Tonga volcanic eruption. This lapse shows the second passage of the westbound wave. There are many interesting aspects shown by this plot including smaller waves out ahead of the largest amplitude wave and again, the westbound wave looks subjectively stronger than the eastbound wave did. I think we'll stop with the IEM Daily Features showing these wave passages and relegate the subsequent posts to my @akrherz Twitter page as we'll perhaps catch a third passage of each! Focus needs to turn back to the dangerous cold wind chills and return to the deep freeze with temperatures over Iowa!
Voting:
Good: 20
Bad: 0
Tags: tonga volcano pressure
Tonga wave passage #3
18 Jan 2022 08:38 PMYou'll have to pardon the continued featuring of wave passages from the Hunga Tonga eruption. This featured lapse shows the second passage of the eastbound wave that happened Sunday evening. While the wave is plainly visible, it is not as strong as the first passage. There are interesting quirks with how qualitatively strong the wave appears over various parts of the country. The reason for these differences is not readily known by the author at this time! We'll have at least one more lapse to share as the second passage of the westbound wave happened Monday afternoon. It is a testament to the power of a volcanic eruption that these waves are able to make multiple trips around the globe!
Voting:
Good: 4
Bad: 0
Tags: tonga volcano pressure
Tonga wave passage #2
17 Jan 2022 07:56 PMYesterday's daily feature presented a sparkline map showing the passage of waves from the Hunga Tonga volcano eruption. Today's map presents the second wave passage event over the contiguous US, this one traversed the globe in the other direction and so arriving on the east coast first. This lapse is from early Sunday morning and guess what, there are still more lapses to be shown as the waves continue to propagate around the globe. It is unclear when these waves will disappear, but given the size of the eruption and some limited literature on previous documented events, it is likely soon. So these waves are not really impacting sensible weather any, but are certainly extremely interesting! Qualitatively, it seems like this wave strength was stronger, but the reasons are not clear and maybe an artifact of time of day and/or how this particular metric is being presented here.
Voting:
Good: 23
Bad: 0
Tags: tonga volcano pressure
Hunga Tonga Eruption Sonic Wave
16 Jan 2022 08:47 PMLate Friday evening (Iowa time), a massive volcanic eruption happened near Tongo, a place north and east of New Zealand. The eruption generated a shock wave / sonic waves in the air that have continued to transverse the globe up until at least the time of this writing. Like waves you see in water, these waves create vertical displacements of air causing surface air pressure fluctuations. The featured movie presents an animation of minute interval pressure data observed from NWS/FAA ASOS stations. The data is presented in the form of "sparklines". Each line represents the map location of an observation time series lasting 15 minutes. The north/south variation in the line represents a change in pressure with the color being the magnitude over the 15 minutes. As you play the movie, you can at least readily notice the propagation of the wave across the country. Others on the Internet have computed this wave to be traveling at approximately the speed of sound! There are many other nuances that can be seen in the plot, including many smaller waves coming after the first wave. So, do you know what is even crazier? There was another wave transversal earlier this Sunday morning from east to west as the initial wave from Tonga made its way east around the globe and arrived at the USA. The one minute data is not available from it yet, so check back later for another lapse from it.
Voting:
Good: 24
Bad: 0
Tags: tonga volcano pressure
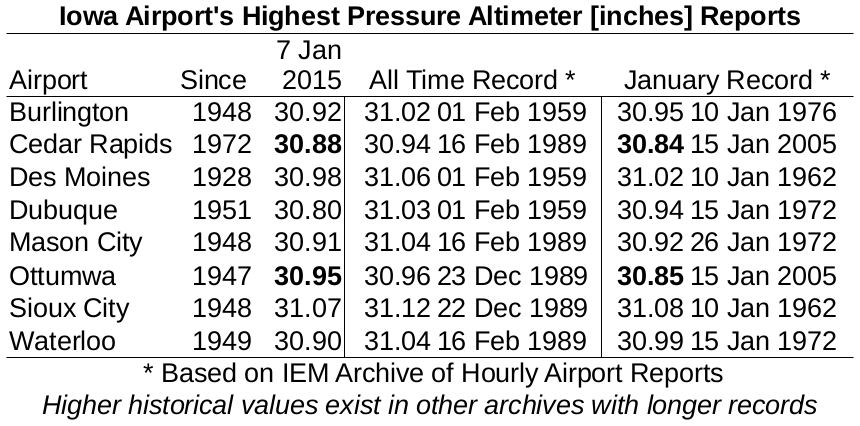
Very high pressures
08 Jan 2015 05:43 AMIf you have sensitive sinuses, yesterday was probably not a very pleasant day for you as air pressures were near the largest values ever recorded in the state. The featured table displays IEM computed pressure records (as expressed by the pressure altimeter reading). There are a number of caveats to this chart as locations in the state have different periods of record and the maximum daily high pressure is something not commonly reported, so this table simply lists out the maximum hourly value reported. Extreme high pressures like this are found with dense areas of very cold air during the winter time.
Voting:
Good: 29
Bad: 5
Abstain: 3
Tags: pressure altimeter
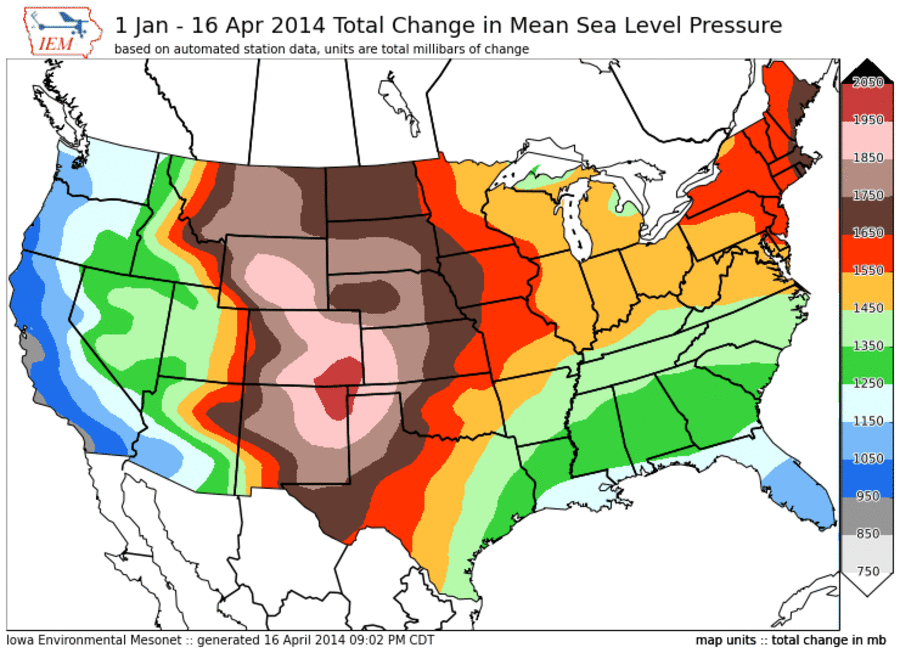
Pressure Change
17 Apr 2014 05:36 AMAre you old like me and do not enjoy it when the pressure changes as various parts of the body start to ache? The featured map displays the total amount of pressure change for the year to date. This value represents the amount the mean sea level pressure observation has changed hour to hour for the year. The largest values (most change) are in southeastern Colorado / northeastern New Mexico while the lowest values (least change) are along the coast in southern California. The maximum area is the preferred location for low pressure systems to develop thanks to geography and the jet stream. If you are bothered by pressure changes, you may wish to move to Florida or the coast of California!
Voting:
Good: 21
Bad: 6
Abstain: 4
Tags: mslp pressure
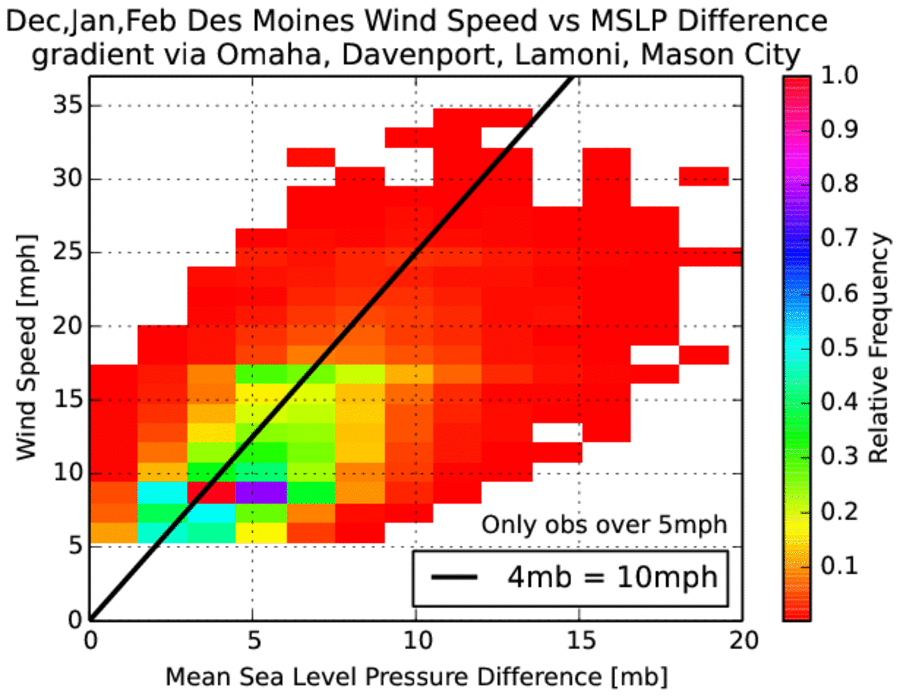
Pressure Gradient Winds
16 Jan 2014 05:55 AMAfter a windy Tuesday, winds are on the increase today and expected to gust upwards of 50 mph. These strong winds are forced by horizontal differences in pressure as air moves from areas of higher pressure to areas of lower pressure. The featured chart presents the combination of an approximate pressure difference over the state to the observed wind speed for Des Moines. An informal forecasting rule of thumb is that for every 4 millibars difference in pressure over Iowa leads to a wind of 10 more miles per hour. For example, a 12 millibar difference should support a 30 mph wind speed. The chart would indicate that this is a fair approximation with most of the distribution near the theoretical line.
Voting:
Good: 41
Bad: 7
Abstain: 7
Tags: forecasting wind pressure
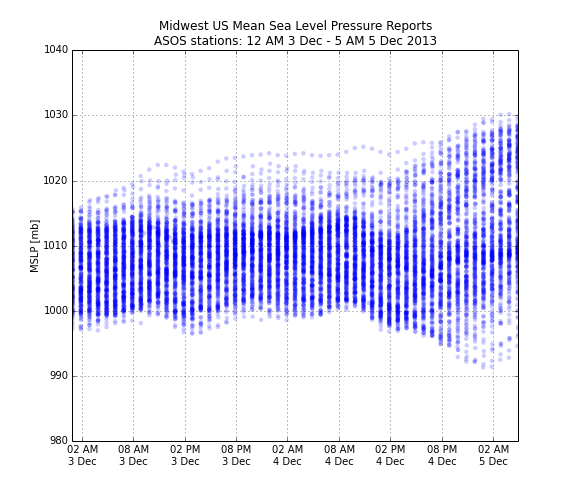
Higher and Lower Pressure
05 Dec 2013 05:49 AMLow pressure systems get all the publicity as they are the ones that bring the precipitating weather and are called storm systems. On Wednesday, such a system rapidly deepened over the Midwest before departing to our north early this morning. The featured chart displays the reported mean sea level pressure values from the airport weather stations over the Midwest since Tuesday. It is interesting to notice that while pressure was dropping over some sites, other sites were experiencing an increase in pressure as the high pressure system moved in from our west and strengthened as well. We typically do not think of high pressure systems strengthening at the same time the low pressure system is deepening as well. These changes help to increase pressure gradients, which ultimately drive increased wind speeds.
Voting:
Good: 33
Bad: 5
Abstain: 4
Tags: mslp pressure
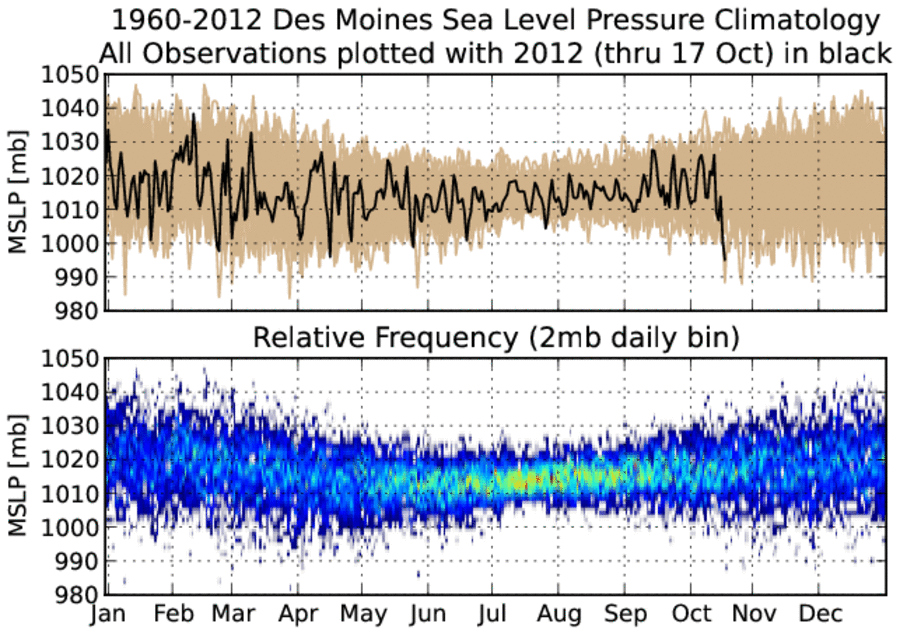
Drop in pressure
18 Oct 2012 05:33 AMA strong fall storm system is currently providing Iowa with plenty of wind and severe weather over the southern plains. Our sea level pressure has dropped below 1000 mb for the first time since May. The featured chart looks at some climatological aspects to the mean sea level pressure (MSLP) reading for Des Moines. The top chart presents the range of observations for each day of the year since 1960. The range in pressure is much smaller during the summer time due to the strong storm system tracks being further north and the air mass dominance of warm air. The bottom chart is an attempt at showing the relative frequency of pressure readings and the variability of the fall, winter, and spring months can clearly be seen. These larger differences in pressure help to drive stronger winds as will be the case for today!
Voting:
Good: 26
Bad: 13
Tags: mslp pressure
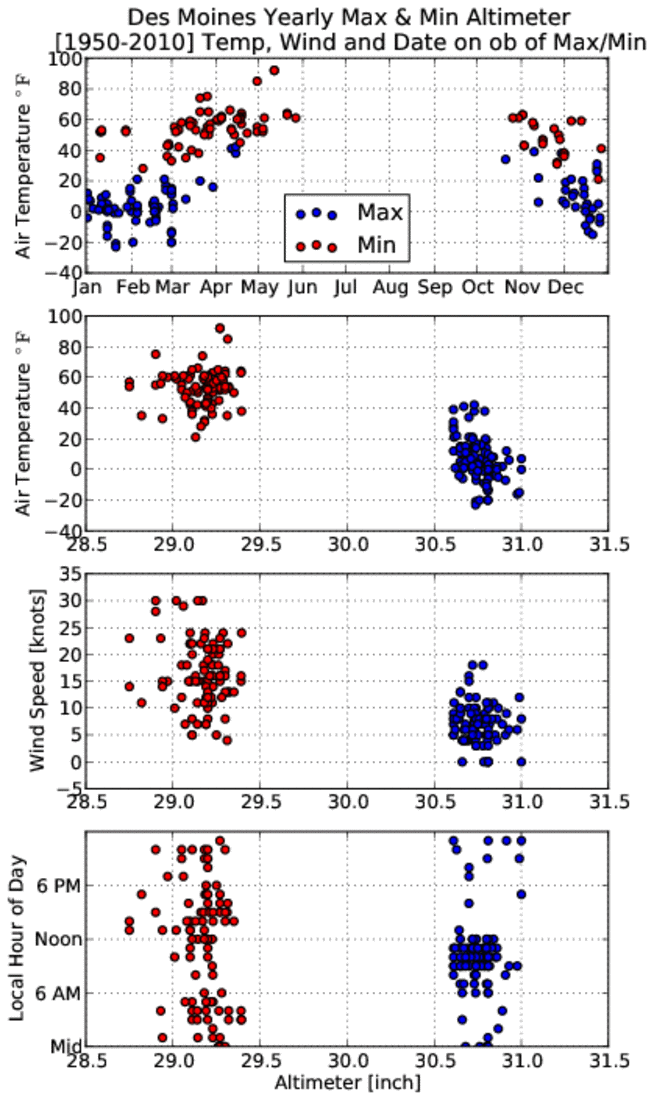
All about pressure
09 Feb 2011 03:33 AMVery cold air has settled into the state thanks to a robust area of high pressure. The altimeter reading (a measure of pressure) yesterday morning was a few hundredths of an inch below the highest value reported so far this year. The featured chart presents the yearly events of when the highest and lowest altimeter readings were observed. The first chart compares the air temperature against the day of the year for the observation. The highest pressure events are associated with colder temperatures than low pressure events as confirmed by the second chart. Low pressure events tend to be with dynamic storm systems (upward motion) that are windier than high pressure events (downward motion). The last chart shows the time of day that each event type occurs. High pressure events mostly occur during the morning hours when the atmosphere is still cooling, while low pressure events happen about any time of day.
Voting:
Good: 22
Bad: 6
Tags: climate pressure
34 mb drop!
09 Dec 2009 06:43 AMAn epic winter storm has most of Iowa shut down this Wednesday morning with snowfall amounts approaching a foot and a half in areas. The big story now is the blowing snow thanks to strong winds blowing over 30 mph sustained. These winds are due to a tremendous pressure gradient over the state. The featured image shows the pressure drop yesterday for the Des Moines ASOS at 34 millibar in a 24 hour period. This rapid change, perhaps unprecedented, in pressure will help keep winds strong today and roads in Iowa impassable.
Voting:
Good: 86
Bad: 8
Tags: blizzard bomb pressure
Bombogenesis
18 Oct 2007 08:37 AMWhen you get old like me, your bones and joints become the best predictor of the weather. The development of powerful storm system yesterday and today has dropped our surface pressure by around 0.7 inches of mercury (~ 24 millibars) in just over 24 hours. This is close to the "bombogenesis" criteria (24 mb in 24 hrs), which is just a cool sounding term to describe another cool sounding term, rapid cyclogenesis.
Voting:
Good: 12
Bad: 6
Tags: bomb pressure