Past IEM Features tagged: forecasting
Rule of 43
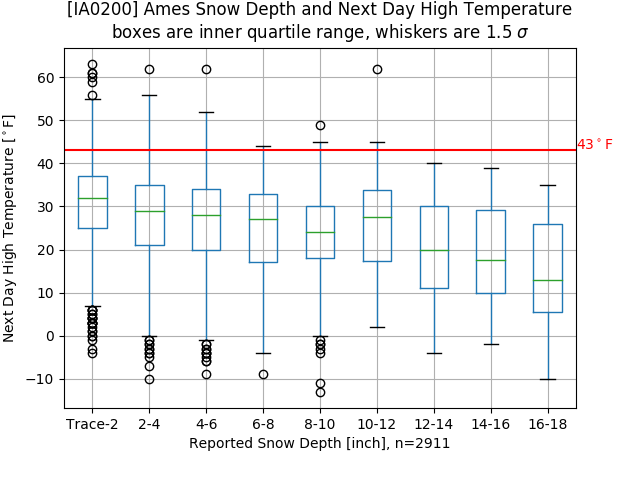
14 Feb 2018 05:33 AMHigh temperatures are expected to soar to levels of warmth you should express to your significant other today. But how warm can it get with deep snow cover existing over much of the state? A local forecasting rule of thumb is to not forecast a high temperature over 43 degrees when there is at least four inches of snow depth to start the day. Does this rule hold against long term observations? With a bunch of caveats with how daily snow depth and high temperatures are reported, the featured chart depicts binned box plots for a given snow depth and the following day high temperature. So in general this rule mostly holds, but there are a few observations shown above the 43 degrees and four inch depth. Of course, the reason for this rule is energy is consumed by melting available snow that would otherwise go into heating the air.
Voting:
Good: 13
Bad: 0
Tags: snowcover highs forecasting
Pressure Gradient Winds
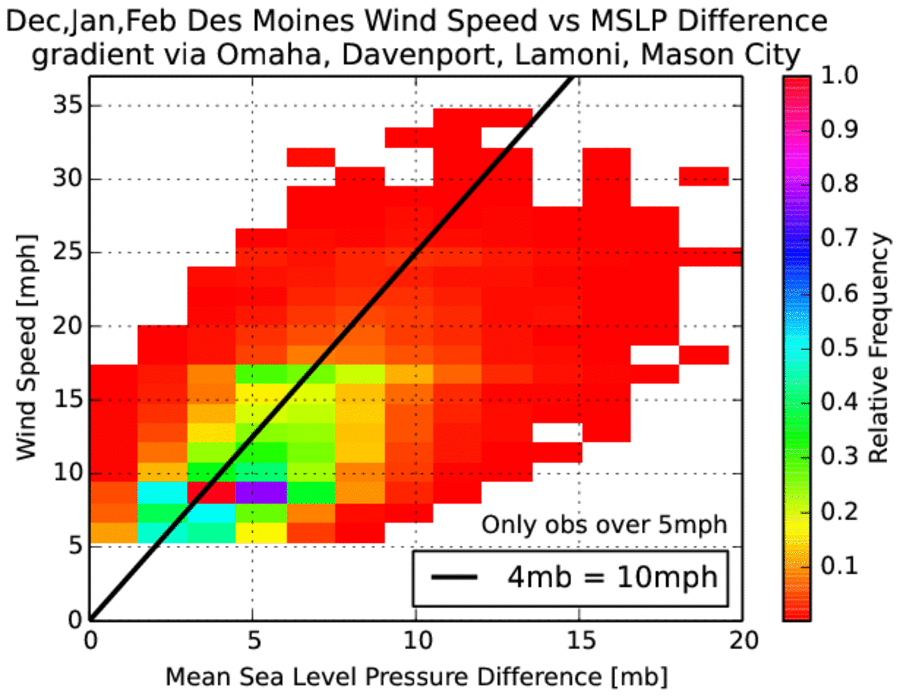
16 Jan 2014 05:55 AMAfter a windy Tuesday, winds are on the increase today and expected to gust upwards of 50 mph. These strong winds are forced by horizontal differences in pressure as air moves from areas of higher pressure to areas of lower pressure. The featured chart presents the combination of an approximate pressure difference over the state to the observed wind speed for Des Moines. An informal forecasting rule of thumb is that for every 4 millibars difference in pressure over Iowa leads to a wind of 10 more miles per hour. For example, a 12 millibar difference should support a 30 mph wind speed. The chart would indicate that this is a fair approximation with most of the distribution near the theoretical line.
Voting:
Good: 41
Bad: 7
Abstain: 7
Tags: forecasting wind pressure
540 Thickness
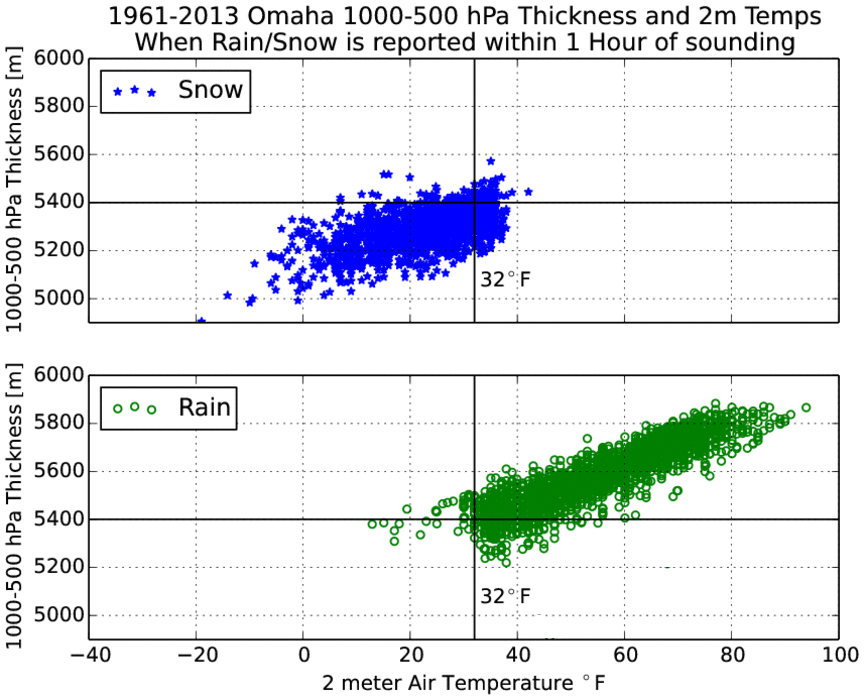
22 Oct 2013 12:01 AMA forecasting rule of thumb is to look at something called the "540 thickness" to delineate snow versus rain events. The technique involves subtracting the height of the 1000 mb surface from the 500 mb surface. When this depth of air, or thickness, falls below 540 decameters (5400 meters), the air is typically cold enough to support snow. The featured chart presents the combination of this thickness value vs near surface air temperature for events where rain or snow were reported by the Omaha airport weather station. There are many caveats to this chart including exact timing issues and changes in automated reporting techniques for rain + snow. The application of this chart to today's weather is that thicknesses are well below 540 over eastern Iowa and closer to 540 over western Iowa. Snow is more likely the further east into the falling precipitation you go!
Voting:
Good: 50
Bad: 5
Tags: forecasting sounding snow
Dewpoint and morning low
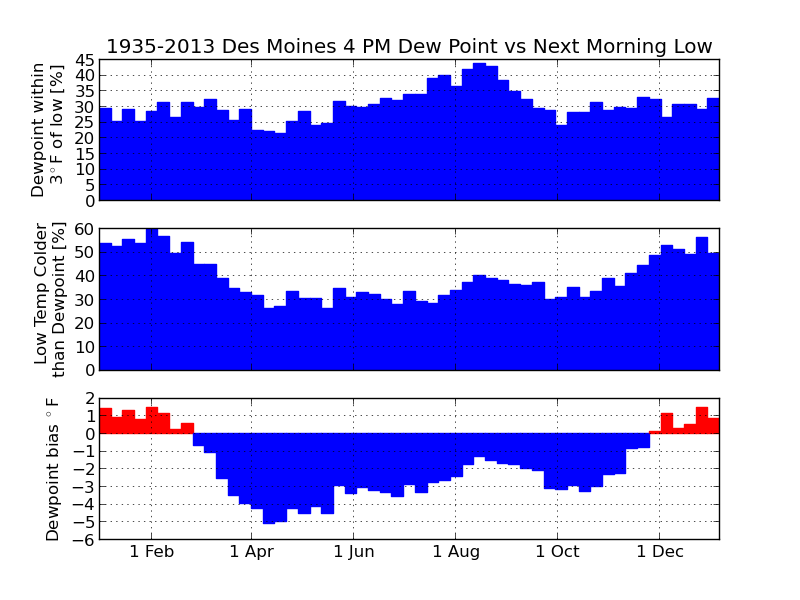
21 Aug 2013 05:48 AMWarmer and muggier weather is back in Iowa with dewpoint temperatures in the upper 60s and lower 70s. The increase in moisture means we are done with the overnight lows in the 50s as the dewpoint puts a floor in on how low the temperature can drop. The reason being that once the air reaches saturation, fog will form and temperatures will be stabilized as long wave radiation is absorbed and heat is released as water vapor condenses. The featured chart looks at the relationship between the 4 PM dewpoint temperature and then the morning low temperature for the next day. The top chart shows the percentage of days the low temperature is within 3 degrees of the 4 PM dewpoint. The middle chart shows the frequency of the low temperature being colder than the 4 PM dewpoint. The bottom chart shows the overall bias of the dewpoint and the next day low temperature. The reasons that this relationship does not always work include: winds can create mixing that prevents temperatures from cooling to the dewpoint, clouds prevent heat from escaping, and/or advection processes can transport more humid or drier air masses changing the dew point overnight.
Same plot for Ames and Cedar Rapids
Voting:
Good: 104
Bad: 10
Tags: dewpoint forecasting
13C Forecasting Rule
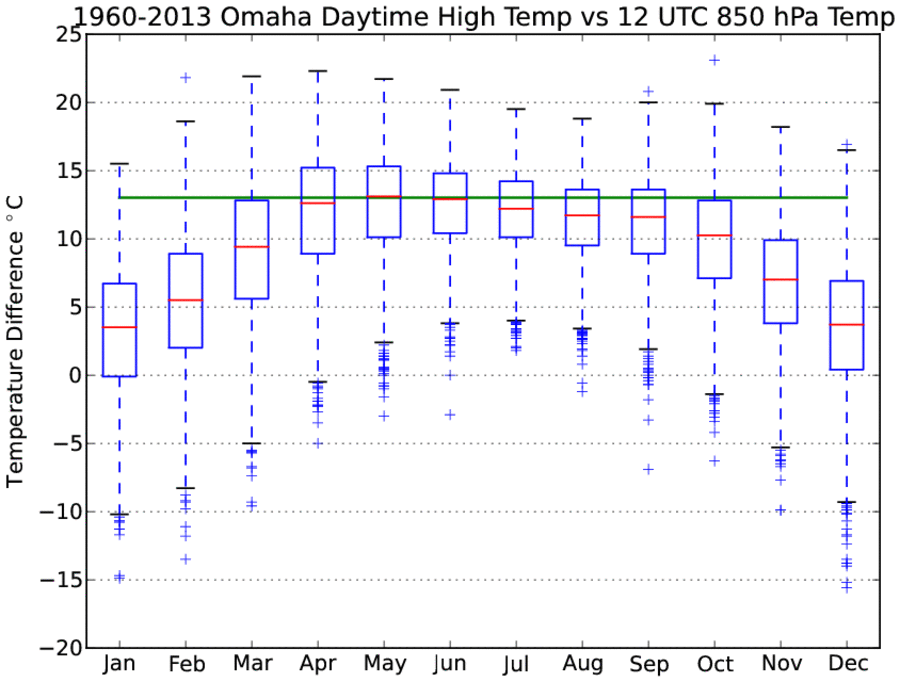
06 Aug 2013 05:35 AMWhen the sun heats the ground, the ground heats the lower atmosphere which drives a mixing process with warm air rising and cold air sinking. This mixing process grows vertically creating a well mixed layer. If this mixing encounters colder air aloft, relatively more heating needs to occur to continue raising the temperature of the mixed layer. If this mixing encounters warmer air aloft, the heating process can accelerate as temperatures are already warm. Atmospheric soundings sample the atmosphere twice per day. The morning sounding provides a sampling of the air above our heads that may be mixed down during the day. A informal rule of forecasting in the plains is to add 13 Celsius to the 850 hPa (millibar) level temperature to provide an afternoon high temperature. For example, the morning sounding on Monday for Omaha had 16.2°C at 850 hPa and when you add 13°C to that reading it yields a high temperature of 85°F. The actual high was 87°F! The featured chart looks at the monthly distribution of change in afternoon high temperatures from the 850 hPa morning temperature. The green bar represents 13°C. The box plots provide detail on the temperature distributions and for the warm six months of the year, this relationship closely approximates the monthly mean. The cold months are dominated by horizontal advection processes and also have decreased solar heating, so this rule does not apply well then.
Voting:
Good: 99
Bad: 7
Tags: sounding forecasting

