Past Features
This page lists out the IEM Daily Features for a month at a time. Features have been posted on most days since February 2002. List all feature titles.
Mon Mar 03, 2025
Dry start to 2025
03 Mar 2025 05:30 AM
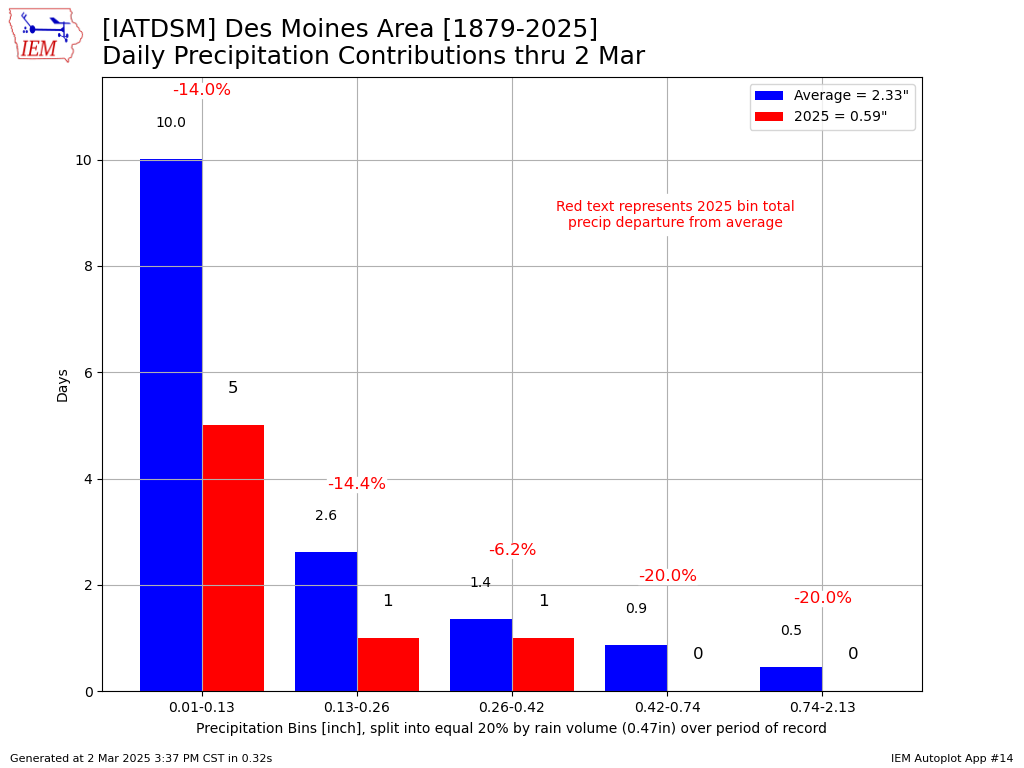
The first two months of 2025 have been on the dry side of average for Iowa, but these two months are also the driest months climatologically. The featured chart looks into how precipitation totals have come in below average for 2025. The long term archive for Des Moines is split into five daily precipitation bins that roughly yield 20% of the total precipitation totals each. The bars show the average number of days per year within each bin, with the labelled percentage values showing the percentage point departure for each bin. The chart shows the number of precipitation days within the lowest two bins are roughly half of average, which mostly explains the departure. A caveat for this type of analysis is that the largest two bins for precipitation have a sub one day frequency, so these events can significantly alter the overall precipitation total. Rewording, it would only take one or two big daily precipitation events to put a significant dent in the departure. So on cue, perhaps once such event will occur Tuesday into Wednesday as a classic late winter / early spring system dominates the weather over much of the US.
Voting: Good - 10 Bad - 0
Generate This Chart on Website
03 Mar 2025 05:30 AM
The first two months of 2025 have been on the dry side of average for Iowa, but these two months are also the driest months climatologically. The featured chart looks into how precipitation totals have come in below average for 2025. The long term archive for Des Moines is split into five daily precipitation bins that roughly yield 20% of the total precipitation totals each. The bars show the average number of days per year within each bin, with the labelled percentage values showing the percentage point departure for each bin. The chart shows the number of precipitation days within the lowest two bins are roughly half of average, which mostly explains the departure. A caveat for this type of analysis is that the largest two bins for precipitation have a sub one day frequency, so these events can significantly alter the overall precipitation total. Rewording, it would only take one or two big daily precipitation events to put a significant dent in the departure. So on cue, perhaps once such event will occur Tuesday into Wednesday as a classic late winter / early spring system dominates the weather over much of the US.
Voting: Good - 10 Bad - 0
Generate This Chart on Website
Tue Mar 04, 2025

Busy Morning
04 Mar 2025 05:39 AM
It is a busy morning for weather with a significant winter storm strengthening over the High Plains and about to plow eastward. The featured chart presents an IEM accounting of population currently under a given NWS alert headline. A good portion of Iowa is now under a Blizzard Warning for tonight into about noon tomorrow as extreme winds will likely blow around whatever snow that falls. Further to the south, an outbreak of severe weather is expected. If there is any good news, welcome moisture will fall over the state with plenty of rain before a transition to snow.
Voting: Good - 21 Bad - 1
Generate This Chart on Website
Wed Mar 05, 2025
March 5th Blizzard
05 Mar 2025 05:41 AM
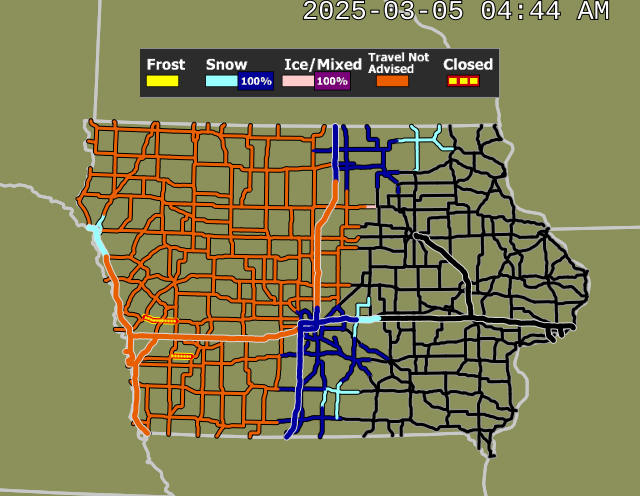
Blizzard conditions are present over Iowa this Wednesday morning with strong winds and blowing snow. The featured map presents Iowa DOT / State Patrol reported winter road conditions valid at about 5 AM. A remarkable contrast is shown with conditions rapidly changing from normal to travel not advised. The falling snow continues to move off to the east this morning, so conditions will rapidly deteriorate over eastern Iowa as well.
Voting: Good - 20 Bad - 2
Tags: blizzard
Generate This Chart on Website
05 Mar 2025 05:41 AM
Blizzard conditions are present over Iowa this Wednesday morning with strong winds and blowing snow. The featured map presents Iowa DOT / State Patrol reported winter road conditions valid at about 5 AM. A remarkable contrast is shown with conditions rapidly changing from normal to travel not advised. The falling snow continues to move off to the east this morning, so conditions will rapidly deteriorate over eastern Iowa as well.
Voting: Good - 20 Bad - 2
Tags: blizzard
Generate This Chart on Website
Thu Mar 06, 2025
'24-'25 Winter Storm #15
06 Mar 2025 08:09 AM
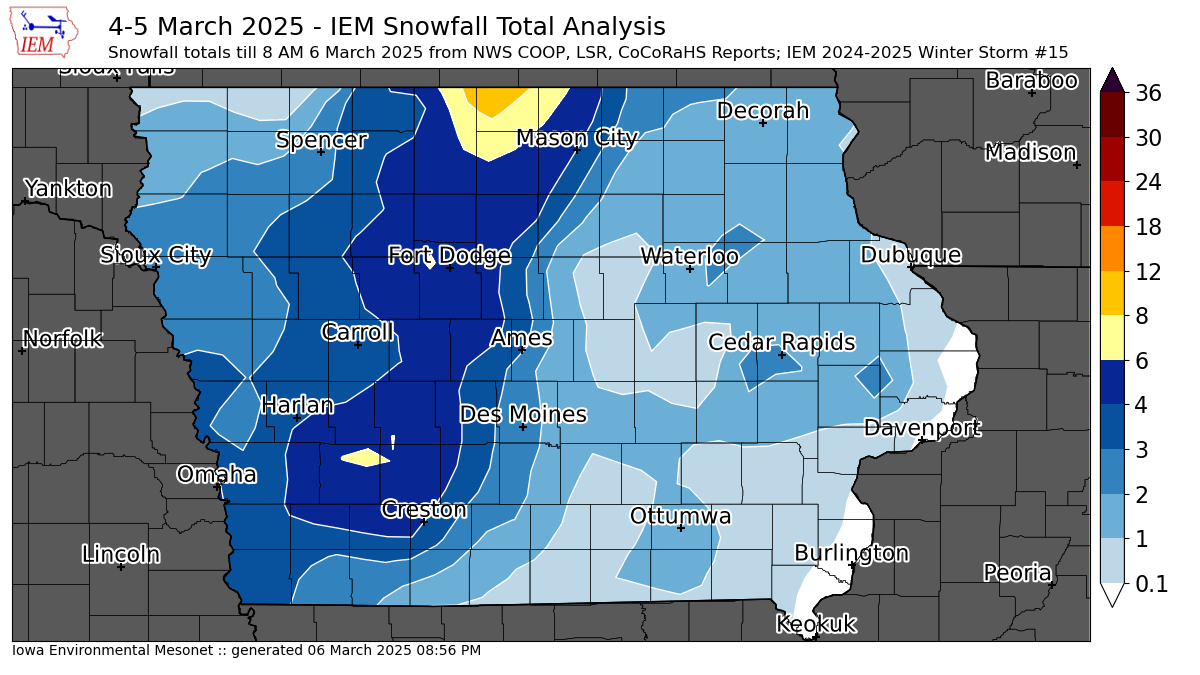
A major winter storm brought high winds, heavy snowfall, blizzard conditions, but also much needed rainfall to the state on Tuesday into Wednesday. Widespread rainfall amounts over an inch were found over much of the state with a quick transition to snow creating treacherous driving as a moisture rich slush froze and was compacted to ice. This system also featured upper echelon wind gusts with numerous locations topping 60 MPH. North central Iowa was particularly hard hit as the featured map shows the highest snowfall totals combined with the strong winds to create impassable snow drifts that will take considerable time to clear. The map analysis of snowfall over eastern Iowa is tricky as snow totals were lighter and the multi-day nature of the event with snow falling during the daytime on Wednesday with melting. Our next winter storm arrives this Thursday evening, but will be no where near as intense as this storm was.
Voting: Good - 13 Bad - 2
Tags: winter2425
06 Mar 2025 08:09 AM
A major winter storm brought high winds, heavy snowfall, blizzard conditions, but also much needed rainfall to the state on Tuesday into Wednesday. Widespread rainfall amounts over an inch were found over much of the state with a quick transition to snow creating treacherous driving as a moisture rich slush froze and was compacted to ice. This system also featured upper echelon wind gusts with numerous locations topping 60 MPH. North central Iowa was particularly hard hit as the featured map shows the highest snowfall totals combined with the strong winds to create impassable snow drifts that will take considerable time to clear. The map analysis of snowfall over eastern Iowa is tricky as snow totals were lighter and the multi-day nature of the event with snow falling during the daytime on Wednesday with melting. Our next winter storm arrives this Thursday evening, but will be no where near as intense as this storm was.
Voting: Good - 13 Bad - 2
Tags: winter2425
Fri Mar 07, 2025
Top March Precip Events
07 Mar 2025 05:30 AM
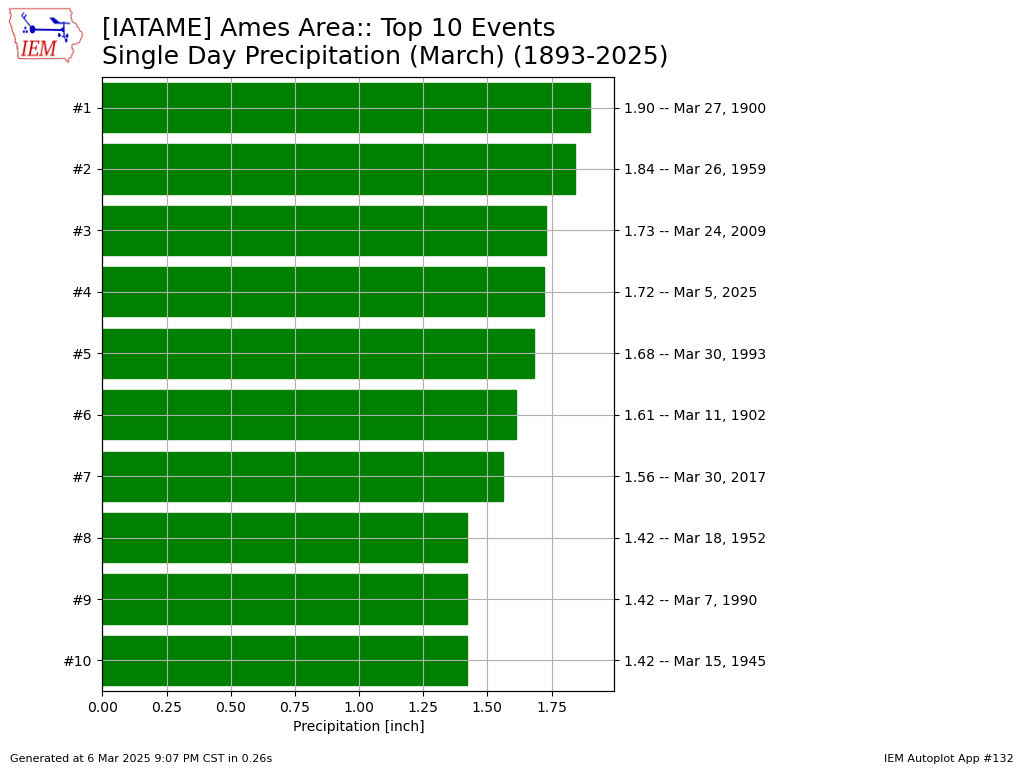
A daily feature to end February denoted that it would take just one or two big rainfall events to wipe out precipitation deficits accumulated so far in 2025. That certainly happened for most of the state with the most recent storm on Tuesday into Wednesday. The featured chart presents the top "daily" precipitation reports for Ames with the 24 hour total reported at 6 AM on Wednesday of 1.72" inches coming in 4th largest for March.
Voting: Good - 14 Bad - 0
Tags: mar
Generate This Chart on Website
07 Mar 2025 05:30 AM
A daily feature to end February denoted that it would take just one or two big rainfall events to wipe out precipitation deficits accumulated so far in 2025. That certainly happened for most of the state with the most recent storm on Tuesday into Wednesday. The featured chart presents the top "daily" precipitation reports for Ames with the 24 hour total reported at 6 AM on Wednesday of 1.72" inches coming in 4th largest for March.
Voting: Good - 14 Bad - 0
Tags: mar
Generate This Chart on Website
Sat Mar 08, 2025
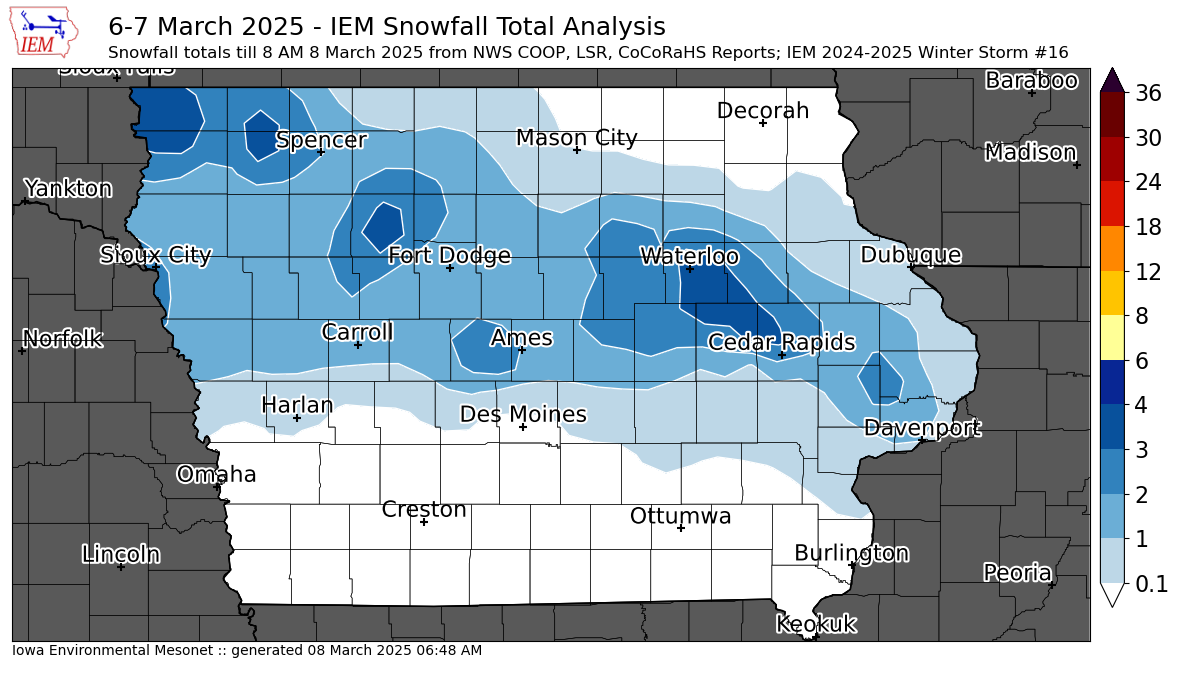
'24-'25 Winter Storm #16
08 Mar 2025 06:57 AM
Both winter storms this week presented significant snowfall measurement challenges. The first was a blizzard with extremely strong winds, so finding an undistributed location to measure a depth was impossible. The storm on Friday mostly fell during the daylight hours and much of it melted as temperatures hovered near the freezing point. So the featured map is again a struggle to accurately represent the depth of snow that fell. The map generally shows a stripe of one to three inches falling from Davenport to the northwestern corner of the state. The ice and snow we accumulated for the week will be melting quickly as warmer temperatures return to the state for the coming week. As an aside, a common Iowa weather folklore tale is that bad winter weather accompanies the Iowa High School Girl's state basketball tournament. That turned out to be the case this year!
Voting: Good - 5 Bad - 3
Tags: winter2425
Mon Mar 10, 2025
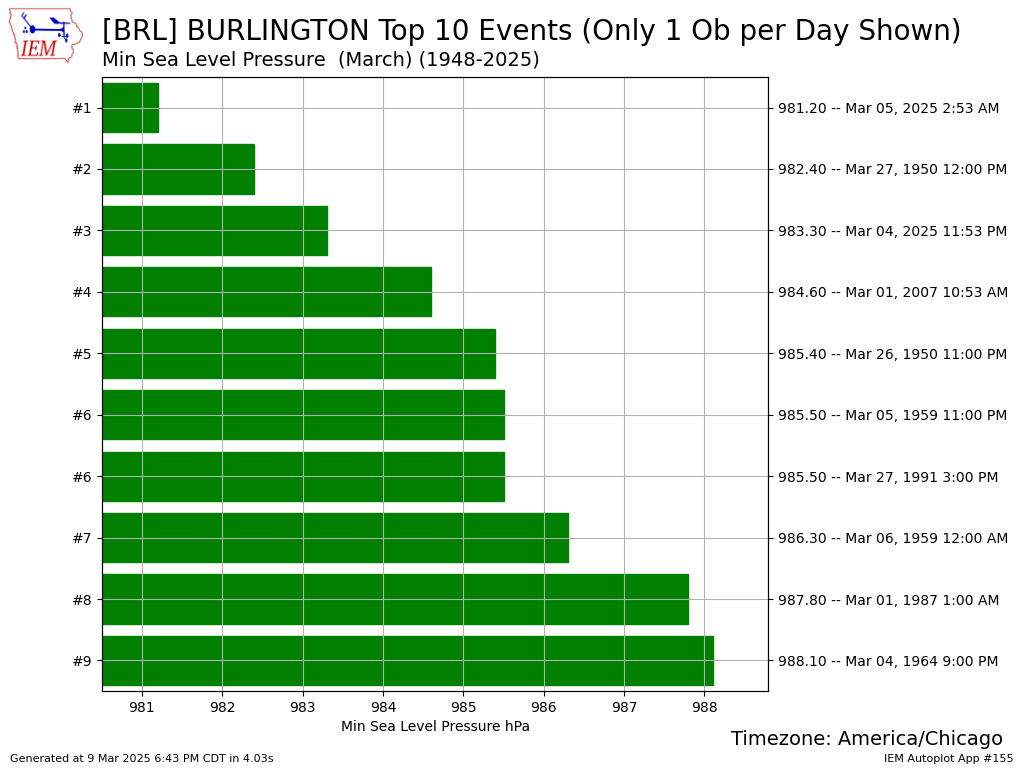
Min March Pressure
10 Mar 2025 05:30 AM
The storm that brought a blizzard, significant precipitation, and strong winds to Iowa last week also featured a very deep low pressure center that passed over southeastern Iowa. A measure of how strong the low pressure center was can be found by comparing observed sea level pressure readings at an airport to its historical record. The featured chart does just that for Burlington, Iowa and finds that for March, the most recent system had the lowest pressure reading on record for the site. There have been deeper low pressure systems over Iowa during March on a handful of other dates and including some that predated observations from this station. Interestingly, another very strong low pressure system, perhaps with a similarly low pressure reading to the storm last week, is forecast to impact Iowa this coming Friday.
Voting: Good - 15 Bad - 6
Tags: mslp
Generate This Chart on Website
Tue Mar 11, 2025

Avg First 70+
11 Mar 2025 05:30 AM
Temperatures warmed very nicely on Monday with the southern half of Iowa reaching at least 70 degrees and a few spots in southwestern Iowa reaching 80 degrees. Daily record high temperatures were set in Lamoni (76°F), Ottumwa (77°F), Cedar Rapids (75°F) and a few other locations. These temperatures were the warmest to date for the year, so the featured chart checks in on the average first 70+ degree high temperature based on long term climate stations. Each station is labelled with the month/day for the 50th percentile of first day of the year, so approximately the average first date. So we are about one to two weeks ahead of schedule this year. Tuesday will be slightly cooler, but temperatures are expected to warm to similar temperatures on Friday along with a chance of severe storms.
Voting: Good - 10 Bad - 6
Generate This Chart on Website
Wed Mar 12, 2025
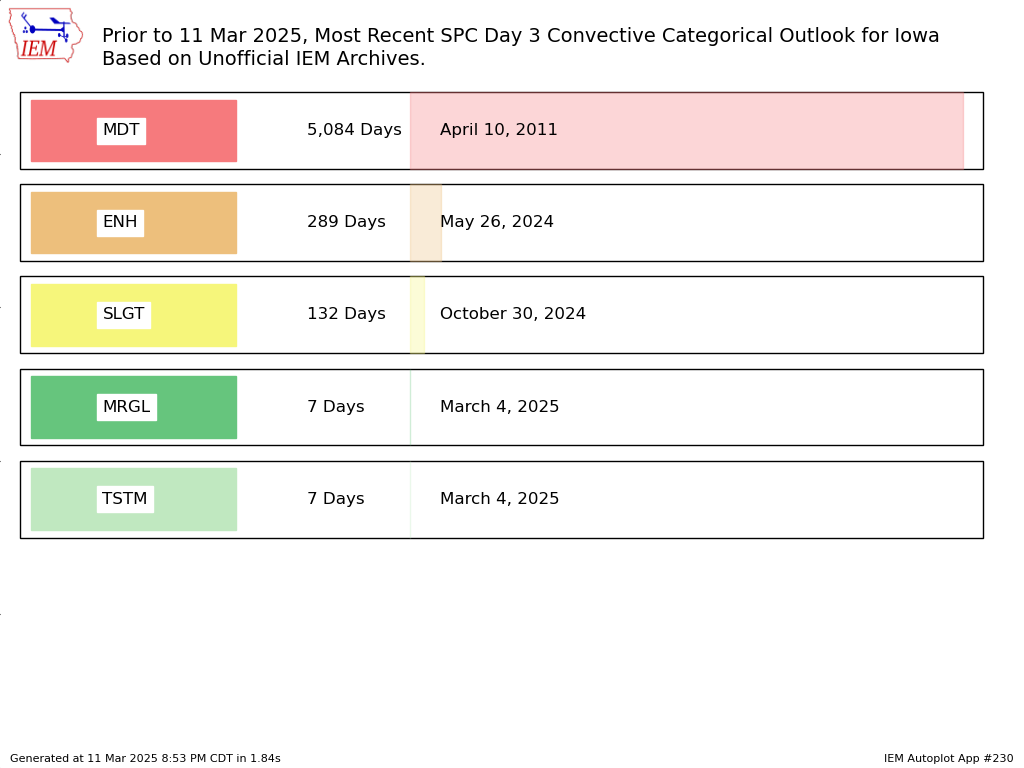
Most Recent Day 3
12 Mar 2025 05:35 AM
The long advertised severe weather forecast for Friday is coming into view with the Storm Prediction Center issuing an expansive 'Day 3' enhanced risk that just clips southeastern Iowa. While the enhanced risk threshold only dates back to 2014, this currently issued one is the 5th largest in size according to unofficial IEM archives. The featured chart presents the number of days since the last given day 3 outlook category touched any part of Iowa (for events prior to the current one). Note that SPC's highest category, a High Risk, is not possible for day 3 outlook. So the last day 3 enhanced risk for Iowa was 26 May of last year, so it has been a while!
Voting: Good - 11 Bad - 6
Generate This Chart on Website
Thu Mar 13, 2025
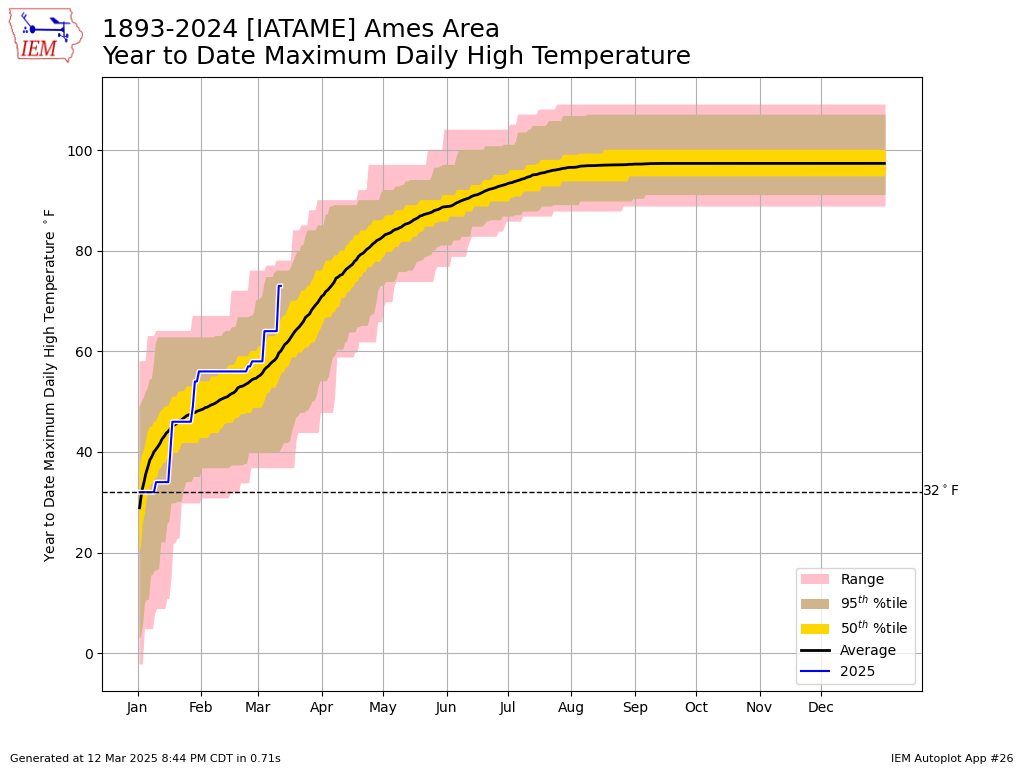
2025 YTD Max High
13 Mar 2025 05:30 AM
With our recent stretch of warm weather, it is a good time to check in how things have trended for year to date warmest daily high temperature for Ames. The featured chart does just that plotting the daily range of this metric over each year. A simple mean is plotted along with various percentile ranges. The 2025 line can seen above average since the start of February with the most recent warm weather putting the year well above average for the date. Very warm weather will continue on Thursday with a number of sites taking a run at 80 degrees on Friday.
Voting: Good - 12 Bad - 2
Tags: ytd
Generate This Chart on Website
Fri Mar 14, 2025

Monthly Thunder Hours
14 Mar 2025 05:30 AM
With strong to likely severe thunderstorms forecast over Iowa Friday, it is a good time to check in on the frequency of thunder being reported at the Des Moines airport weather station. Based on available hourly or better reports, the featured chart presents the monthly number of distinct hours with at least one thunder observation. The blue bars are the simple long term average and red bars are the year to date. The annual cycle is obvious with non zero values still found during the cold season. March is just the start of thunderstorm season with about triple the amount of hours, on average, found during April.
Voting: Good - 22 Bad - 1
Tags: thunder
Generate This Chart on Website
Sun Mar 16, 2025
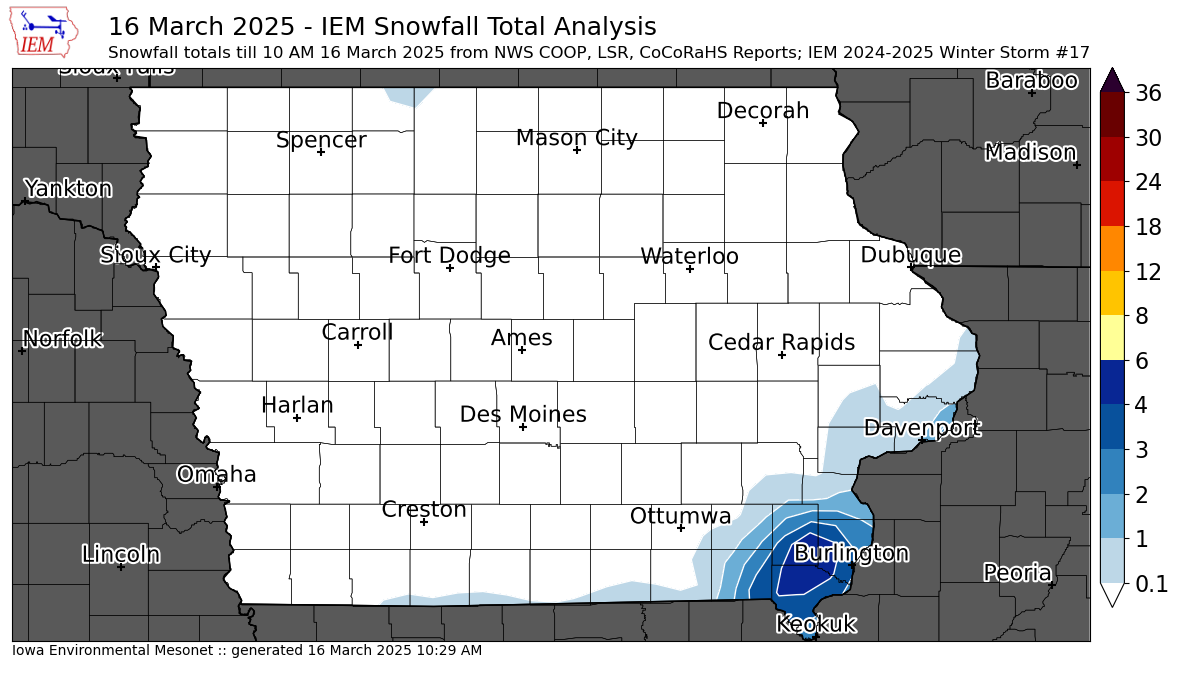
'24-'25 Winter Storm #17
16 Mar 2025 10:36 AM
A significant and expansive storm system continues to churn over the Great Lakes region this Sunday morning. This system brought record high temperatures on Friday along with strong winds and severe weather. The backside of the system clipped far southeastern Iowa overnight with a narrow and intense band of snowfall. The featured analysis of available reports show a small area of four plus inches of snow! This snowfall will struggle to survive the day with mid March sunshine typically making quick melting work of snow.
Voting: Good - 6 Bad - 0
Tags: winter2425
Mon Mar 17, 2025

1,000+ Warnings in 3 Days
17 Mar 2025 06:59 AM
An expansive early spring season storm brought rough weather to much of the country starting on Friday and through Sunday. Based on unofficial IEM accounting, the National Weather Service issued 1,011 Tornado + Severe Thunderstorm + Flash Flood Warnings over this three day period. The featured chart presents the largest number of such combined warnings over a three day period fully within March. This event comes in first place with subsequent combinations including part of this past weekend even ranking in the top ten as well. This event also featured a very rare Storm Prediction Center Day 2 "High Risk" issuance for Mississippi and Alabama. For Iowa, the active weather pattern will continue this week with about any type of weather you can imagine possible during some time this week.
Voting: Good - 8 Bad - 1
Tags: wwa mar 2025
Generate This Chart on Website
Tue Mar 18, 2025
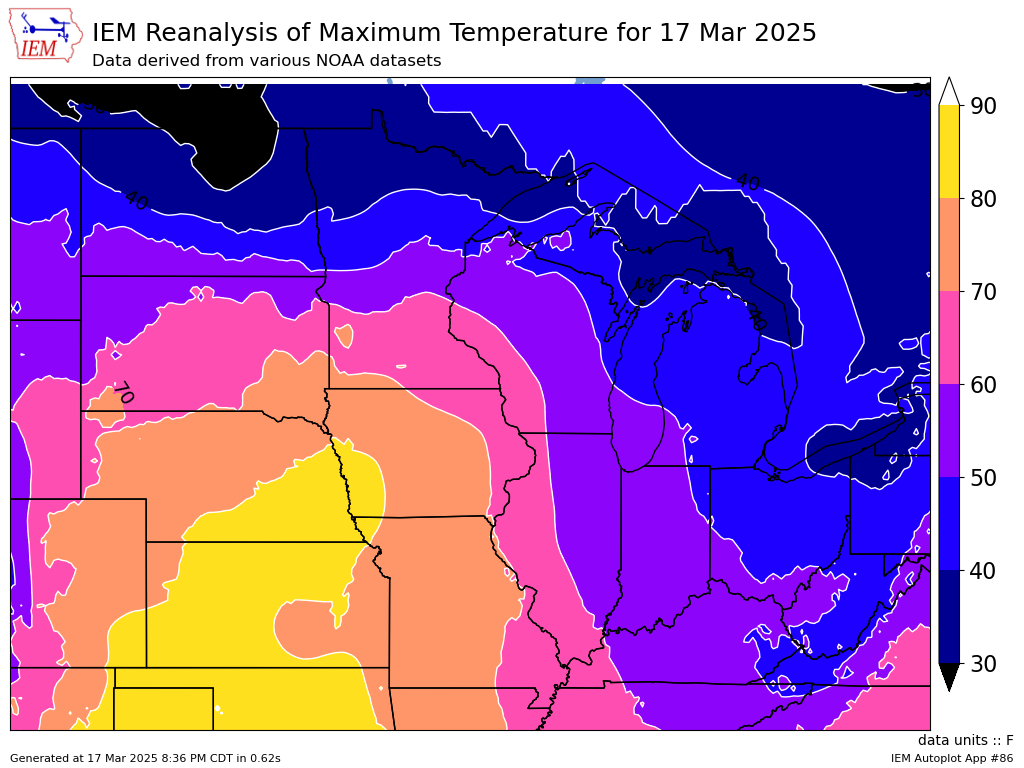
Another Great March Day
18 Mar 2025 05:30 AM
While this March has had a few poor days of weather, the balance of them have seemed to be on the same side as the great weather found on Monday over the state and beyond. The featured map presents an analyses derived from NOAA datasets showing the high temperature. 80s again crept into southwestern Iowa with much of the rest of the state at least into the 70s. Tuesday will again have warm temperatures, but a rapid jump back to winter will happen on Wednesday along with a period of cooler than average temperatures to follow.
Voting: Good - 13 Bad - 0
Generate This Chart on Website
Wed Mar 19, 2025
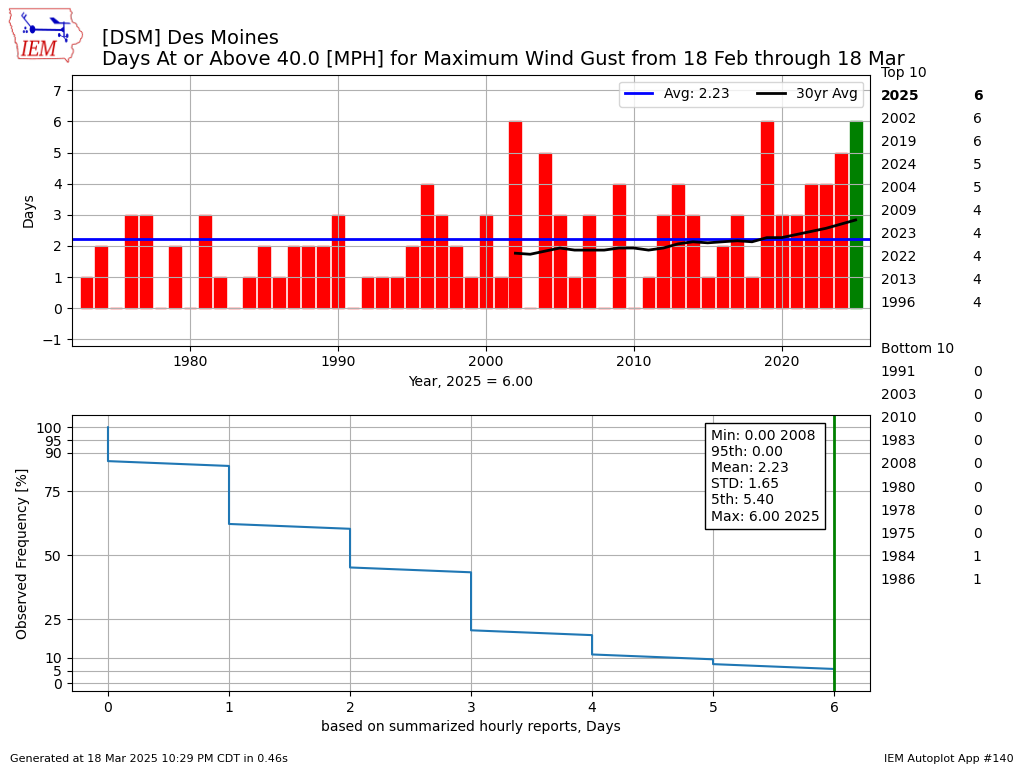
Recent Windy Days
19 Mar 2025 05:30 AM
Tuesday was another very pleasant March day with high temperatures again above average for nearly all of Iowa. Wednesday will see a dramatic change with a return of high winds and blizzard conditions over portions of the state. Wind gusts will certainly exceed 40 MPH and make for another recent such windy day. The featured chart presents the number of days for Des Moines between 18 Feb and 18 Mar with a daily wind gust of at least 40 MPH. The six days over this period ties 2002 and 2019 for the most. This type of chart would be taken with a grain of salt as long term wind gust observations are tricky due to observational changes and instrumentation changes. While data does exist for Des Moines prior to 1973 (the selected start of this chart), that data can be difficult to resolve if gusts were routinely reported and/or the averaging period for such values.
Voting: Good - 13 Bad - 0
Tags: gust
Generate This Chart on Website
Thu Mar 20, 2025

'24-'25 Winter Storm #18
20 Mar 2025 07:16 AM
As with a number of recent Wednesdays, a major winter storm impacted the state. This storm system also featured a number of hail producing storms Wednesday morning with even a couple of instances of having a Severe Thunderstorm Warning coincident with a Blizzard Warning (more on that tomorrow). The featured map presents an analysis of snowfall reports with a few isolated reports of around twelve inches! Thunder-snow was also observed with this event, which weather forecasting lore implies a foot of snow will fall somewhere nearby. Winds were again very extreme with this storm with gusts exceeding 60 MPH for some locations. Mid March sunshine and warmer temperatures will start the melting work today.
Voting: Good - 15 Bad - 1
Tags: winter2425
Fri Mar 21, 2025
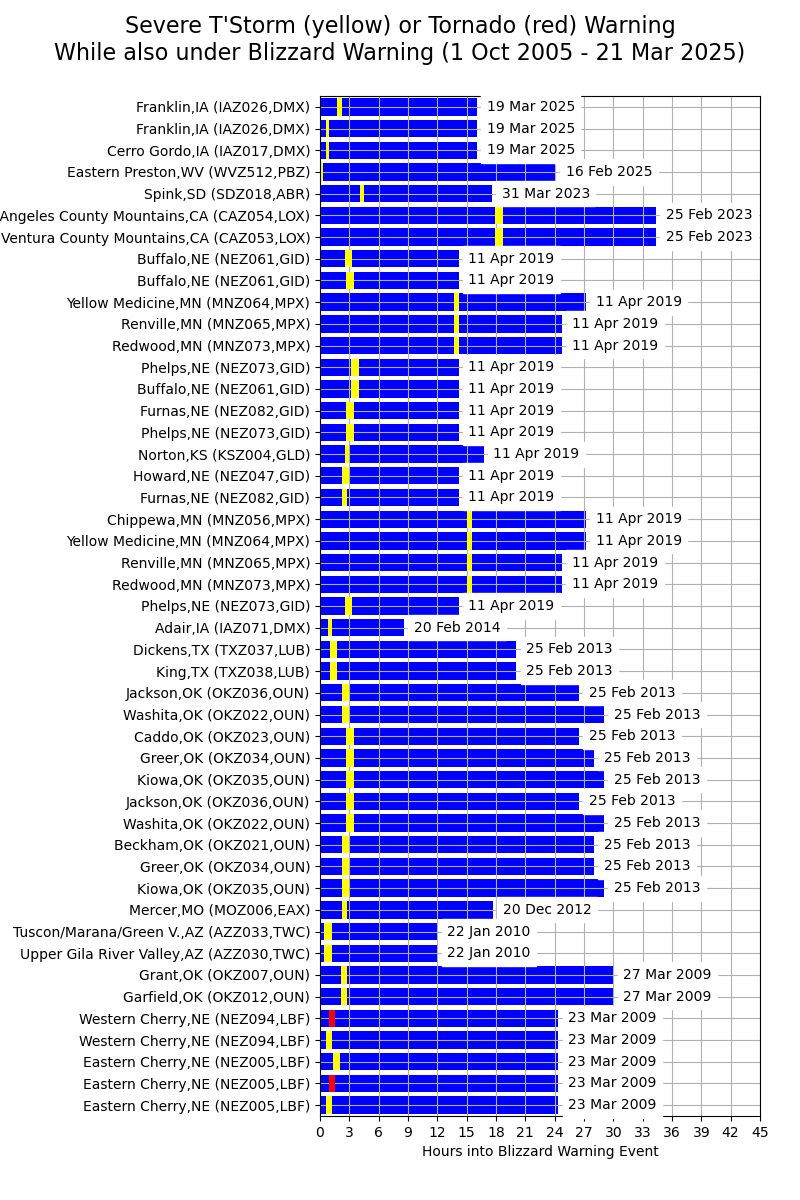
Coincident Warnings
21 Mar 2025 05:20 AM
Our most recent winter storm generated a somewhat rare situation with the National Weather Service issuing coincident Blizzard (#3) and Severe Thunderstorm Warnings (#25, #26) early into the event Wednesday morning. The featured chart presents an IEM accounting of when this has happened, along with Tornado Warnings, nationwide since the implementation of warning event tracking on 1 Oct 2005. Only one other event is shown for Iowa during 2014. An item to note is that this feature does not imply that Blizzard and Severe Thunderstorm conditions were simultaneously observed, but just that the warnings were coincident. In situations like on Wednesday, the NWS messaging sets the start time of the Blizzard Warning at a consistent time over a larger area and sometimes the eastern border of this area is experiencing thunderstorms before it transitions to a Blizzard. The chart shows the relative timing of when the SVR,TOR warning appeared during the blizzard and it is often near the start of the blizzard event.
Voting: Good - 16 Bad - 3
Tags: blizzard
Mon Mar 24, 2025
Temps During Clear Skies
24 Mar 2025 05:30 AM
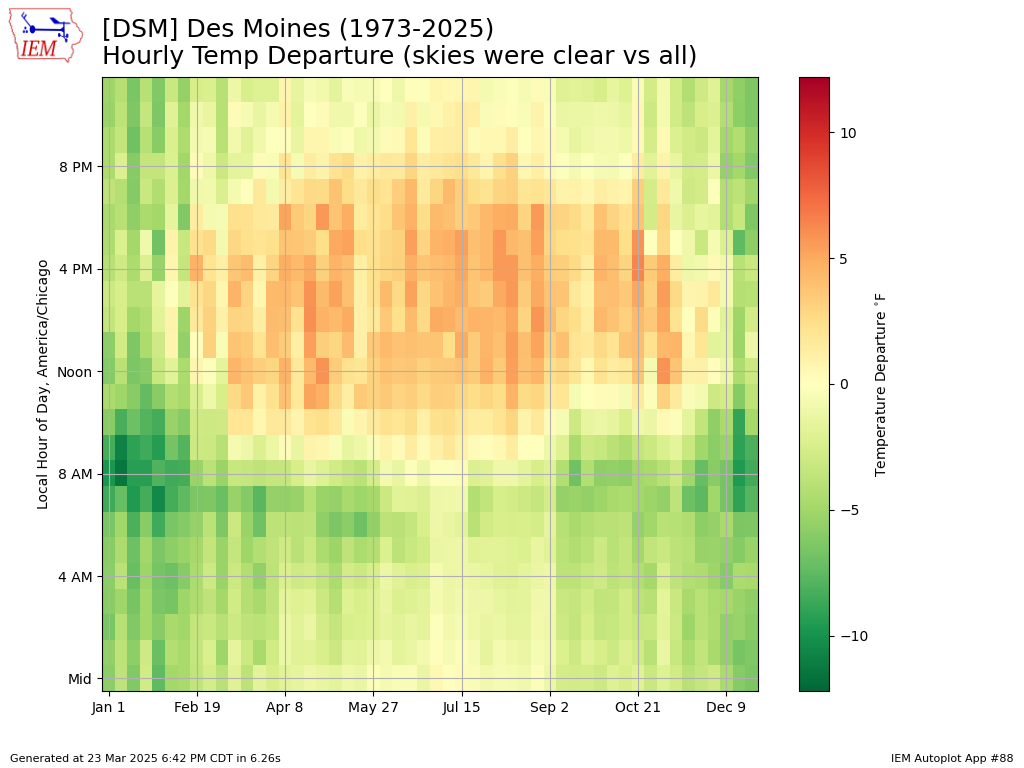
The featured chart takes a look at the impact of having clear skies on air temperature by comparing hourly weather reports at Des Moines over its archive since 1973. The data is partitioned by week of the year to remove some variability. Each pixel represents the average temperature difference between clear sky conditions vs all available reports. A positive value means the air temperatures are warmer than overall. The chart shows a clear annual and diurnal signal. During the overnight hours, clear skies allow for more radiational cooling, so temperatures are cooler. During the day, the lack of clouds allows for more heating, but this effect is muted during the winter months due to the presence of snow and the general lack of significant solar energy incident during this season.
Voting: Good - 15 Bad - 1
Generate This Chart on Website
24 Mar 2025 05:30 AM
The featured chart takes a look at the impact of having clear skies on air temperature by comparing hourly weather reports at Des Moines over its archive since 1973. The data is partitioned by week of the year to remove some variability. Each pixel represents the average temperature difference between clear sky conditions vs all available reports. A positive value means the air temperatures are warmer than overall. The chart shows a clear annual and diurnal signal. During the overnight hours, clear skies allow for more radiational cooling, so temperatures are cooler. During the day, the lack of clouds allows for more heating, but this effect is muted during the winter months due to the presence of snow and the general lack of significant solar energy incident during this season.
Voting: Good - 15 Bad - 1
Generate This Chart on Website
Tue Mar 25, 2025

Colder than Last Year
25 Mar 2025 05:30 AM
This March has seen both very warm and chilly days, which matches the previous two months of this year as well. The year to date period this year has been cooler than the same period last year, which is the subject of today's featured map. It displays the difference in average high temperature for the year to date period with negative values indicating 2025 was cooler than 2024. The state is shown in the 3 to 6 degrees cooler range. You may recall 2024 featured two cold weeks in January and not much for cold beyond that. The forecast for the rest of this week does have warmer high temperatures before a cool down into the coming weekend.
Voting: Good - 13 Bad - 1
Generate This Chart on Website
Wed Mar 26, 2025
Checking Soil Temps
26 Mar 2025 05:30 AM
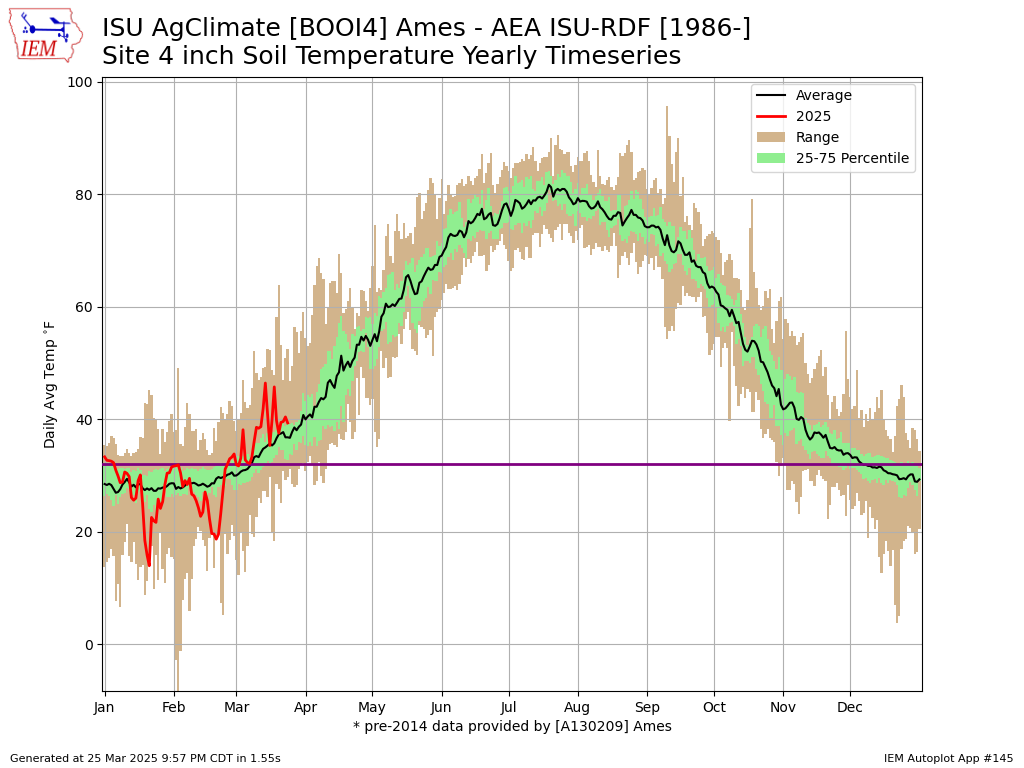
With the calendar nearly through March, the lengthening daylight, and warmer air temperatures, thoughts of leaving the winter season behind are certainly on the minds of most Iowans. Unfortunately, it is still too soon to think very cold temperatures and even snowfall are done for the season. The featured chart presents a period of record climatology for four inch depth soil temperatures from the ISU Soil Moisture station nearby Ames. The 2025 daily averages are plotted as well. The rate of warming of the soils is just getting started during March and the chart nicely shows how rapidly it happens during April with the average value increasing by about 15 degrees. The observed range of the data shows chilly soil temperatures are possible through at least the first couple of weeks of April with frozen temperatures possible during this period. It won't be long now!
Voting: Good - 11 Bad - 1
Generate This Chart on Website
26 Mar 2025 05:30 AM
With the calendar nearly through March, the lengthening daylight, and warmer air temperatures, thoughts of leaving the winter season behind are certainly on the minds of most Iowans. Unfortunately, it is still too soon to think very cold temperatures and even snowfall are done for the season. The featured chart presents a period of record climatology for four inch depth soil temperatures from the ISU Soil Moisture station nearby Ames. The 2025 daily averages are plotted as well. The rate of warming of the soils is just getting started during March and the chart nicely shows how rapidly it happens during April with the average value increasing by about 15 degrees. The observed range of the data shows chilly soil temperatures are possible through at least the first couple of weeks of April with frozen temperatures possible during this period. It won't be long now!
Voting: Good - 11 Bad - 1
Generate This Chart on Website
Thu Mar 27, 2025
Climatology Pull
27 Mar 2025 05:30 AM
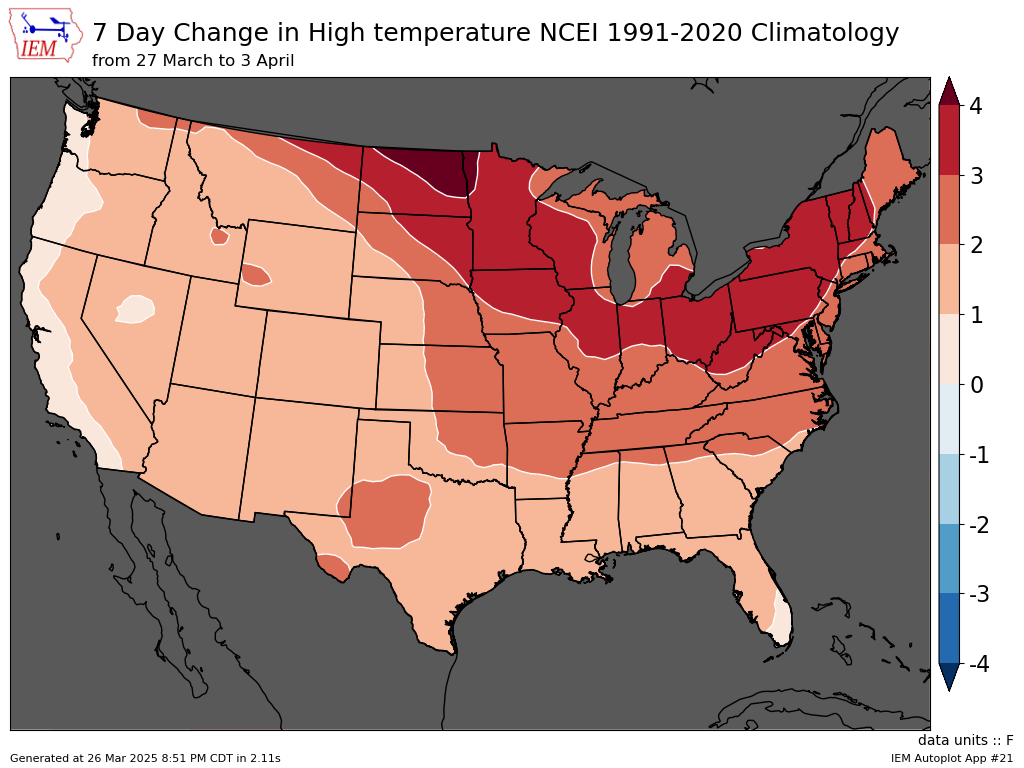
Yesterday's daily feature looked into the warming of soils during late March. Today's featured map looks into the warming of air temperatures by plotting the change in NCEI 1991-2020 climatology over the coming seven day period. Much of Iowa is shown in the 3-4 degree range meaning that average high temperatures on 3 April are that much warmer than average values on 27 March. Such is the strong pull of climatology this time of year as soil temperatures continue to warm, solar inputs increase daily, and frequency of snow cover decreases. The pattern shown over the contiguous US is certainly interesting with the weakest amount of warming found along the Pacific coast, which is heavily modulated by the ocean. You can also see some effect over Michigan as the chillier Great Lakes dampen the warming this time of year as well.
Voting: Good - 12 Bad - 0
Generate This Chart on Website
27 Mar 2025 05:30 AM
Yesterday's daily feature looked into the warming of soils during late March. Today's featured map looks into the warming of air temperatures by plotting the change in NCEI 1991-2020 climatology over the coming seven day period. Much of Iowa is shown in the 3-4 degree range meaning that average high temperatures on 3 April are that much warmer than average values on 27 March. Such is the strong pull of climatology this time of year as soil temperatures continue to warm, solar inputs increase daily, and frequency of snow cover decreases. The pattern shown over the contiguous US is certainly interesting with the weakest amount of warming found along the Pacific coast, which is heavily modulated by the ocean. You can also see some effect over Michigan as the chillier Great Lakes dampen the warming this time of year as well.
Voting: Good - 12 Bad - 0
Generate This Chart on Website
Fri Mar 28, 2025
SWAW 2025: Flood Safety
28 Mar 2025 05:30 AM
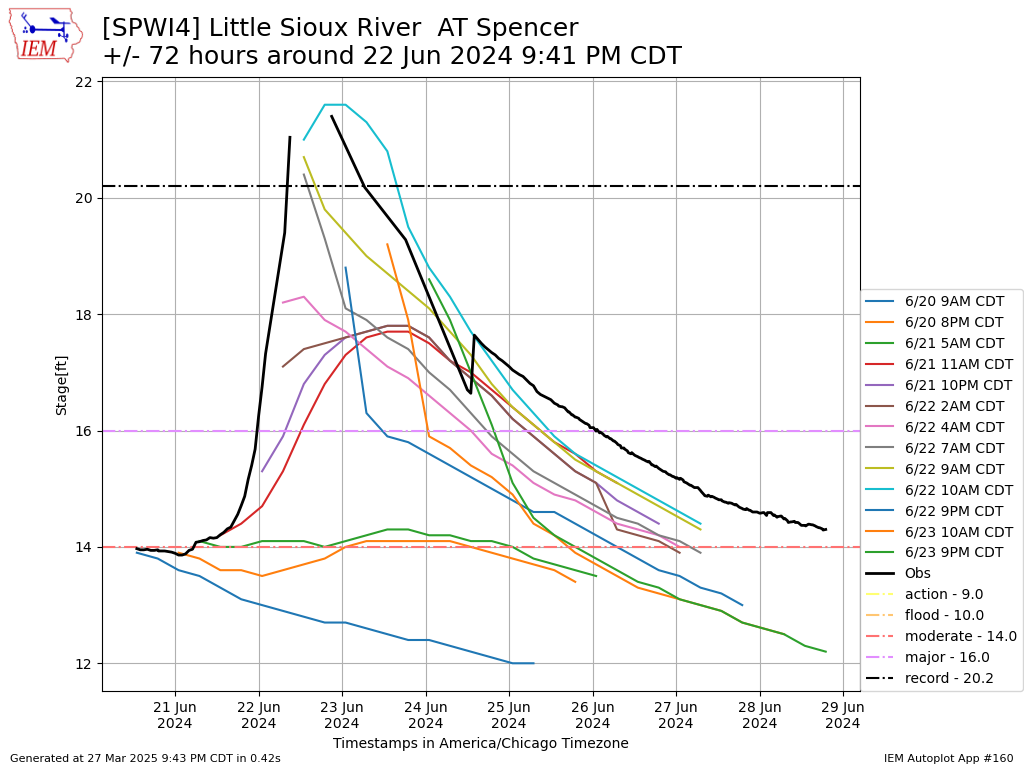
This is Severe Weather Awareness Week (SWAW) in Iowa with the topic for Friday being Flood Safety. Sadly, a number of preventable deaths happen every year nationwide as folks underestimate the danger flood waters pose. Flooding happens about every year in Iowa with the featured chart presenting observed and NWS forecast data for the flood of the Little Sioux River at Spencer, IA last June. The observed line shows how quickly the waters rose to record levels. Flood forecasting remains a significant challenge for smaller river basins as it requires extremely accurate precipitation forecasts. The lateral movement of a training line of thunderstorms just a handful of miles can have significant implications for which river basin those rains will drain out of. The NWS has an informative Story Maps page for SWAW in Iowa and Nebraska.
Voting: Good - 18 Bad - 2
Tags: flood
Generate This Chart on Website
28 Mar 2025 05:30 AM
This is Severe Weather Awareness Week (SWAW) in Iowa with the topic for Friday being Flood Safety. Sadly, a number of preventable deaths happen every year nationwide as folks underestimate the danger flood waters pose. Flooding happens about every year in Iowa with the featured chart presenting observed and NWS forecast data for the flood of the Little Sioux River at Spencer, IA last June. The observed line shows how quickly the waters rose to record levels. Flood forecasting remains a significant challenge for smaller river basins as it requires extremely accurate precipitation forecasts. The lateral movement of a training line of thunderstorms just a handful of miles can have significant implications for which river basin those rains will drain out of. The NWS has an informative Story Maps page for SWAW in Iowa and Nebraska.
Voting: Good - 18 Bad - 2
Tags: flood
Generate This Chart on Website
Mon Mar 31, 2025
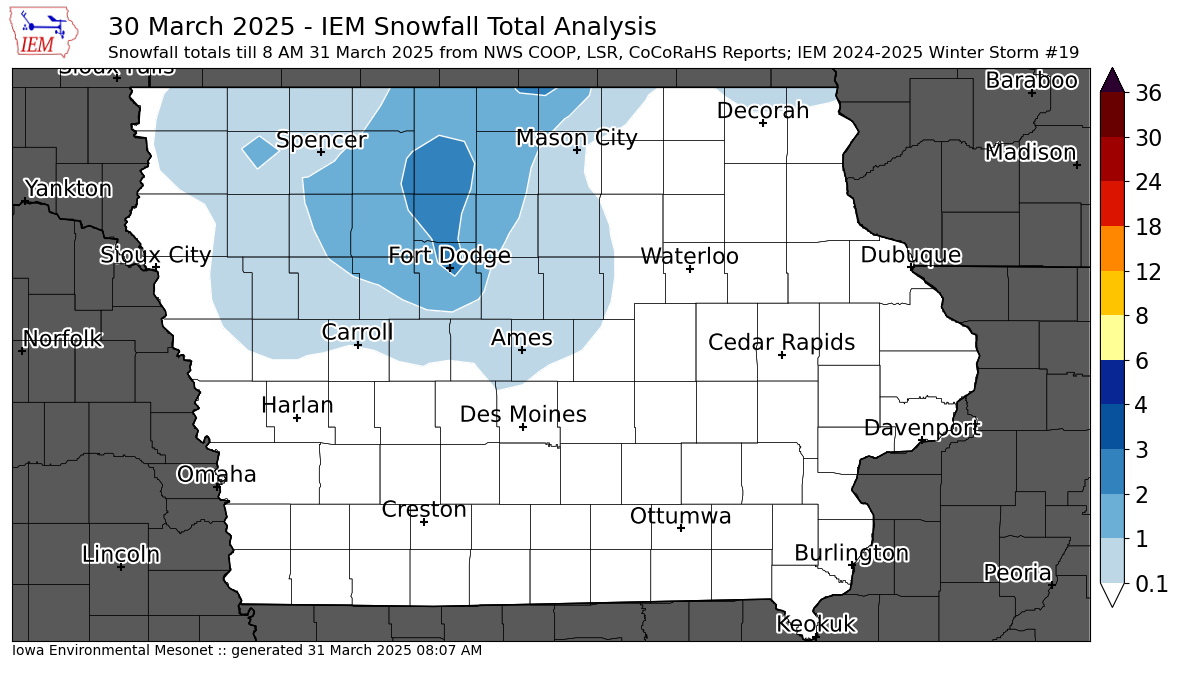
'24-'25 Winter Storm #19
31 Mar 2025 08:12 AM
The month of March has seen a number of large and very powerful storm systems to impact the US. Iowa caught a passing blow from the cold side of the system on Sunday afternoon with most of the snow during the afternoon hours melting as it hit the ground. There was just enough cold air and intense snowfall rates to allow for some accumulation over north central Iowa with a few isolated two inch reports near Fort Dodge. Much worse winter weather was found just to Iowa's north with an expansive area of freezing rain and also to our south with severe weather from Illinois to Louisiana. The active weather pattern will continue with another major storm arriving Tuesday into Wednesday.
Voting: Good - 12 Bad - 0
Tags: winter2425