IEM Daily Feature
Monday, 03 March 2025
Monday, 03 March 2025
Dry start to 2025
Posted: 03 Mar 2025 05:30 AM
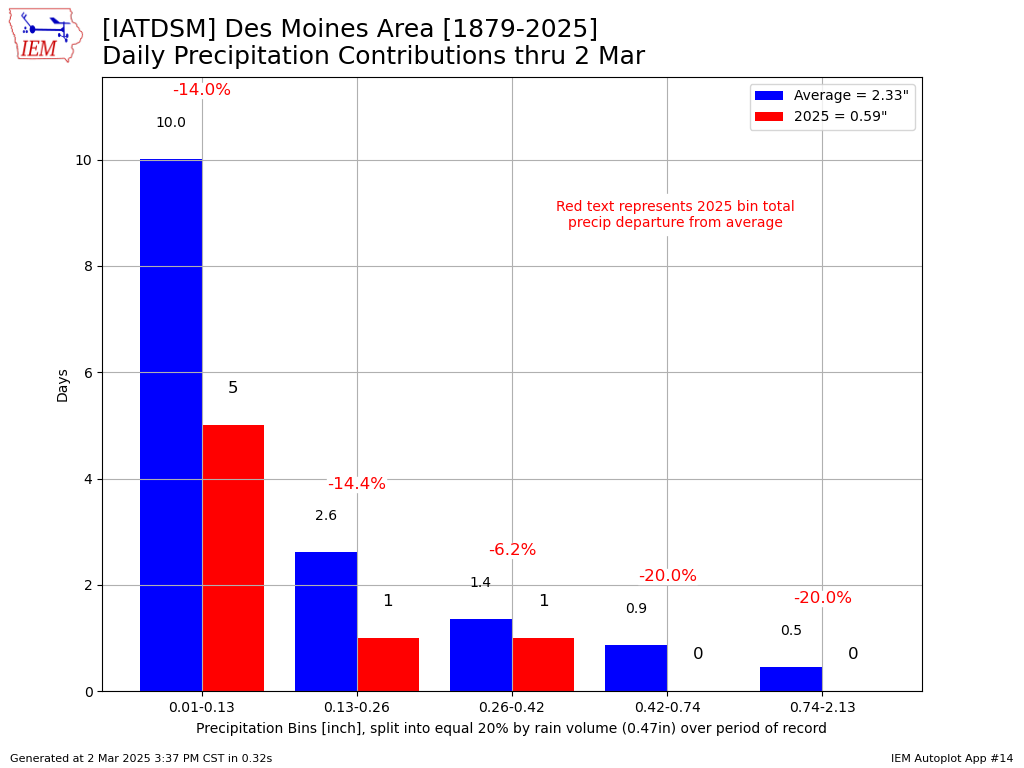
The first two months of 2025 have been on the dry side of average for Iowa, but these two months are also the driest months climatologically. The featured chart looks into how precipitation totals have come in below average for 2025. The long term archive for Des Moines is split into five daily precipitation bins that roughly yield 20% of the total precipitation totals each. The bars show the average number of days per year within each bin, with the labelled percentage values showing the percentage point departure for each bin. The chart shows the number of precipitation days within the lowest two bins are roughly half of average, which mostly explains the departure. A caveat for this type of analysis is that the largest two bins for precipitation have a sub one day frequency, so these events can significantly alter the overall precipitation total. Rewording, it would only take one or two big daily precipitation events to put a significant dent in the departure. So on cue, perhaps once such event will occur Tuesday into Wednesday as a classic late winter / early spring system dominates the weather over much of the US.
Voting:
Good = 10
Bad = 0
Voting:
Good = 10
Bad = 0