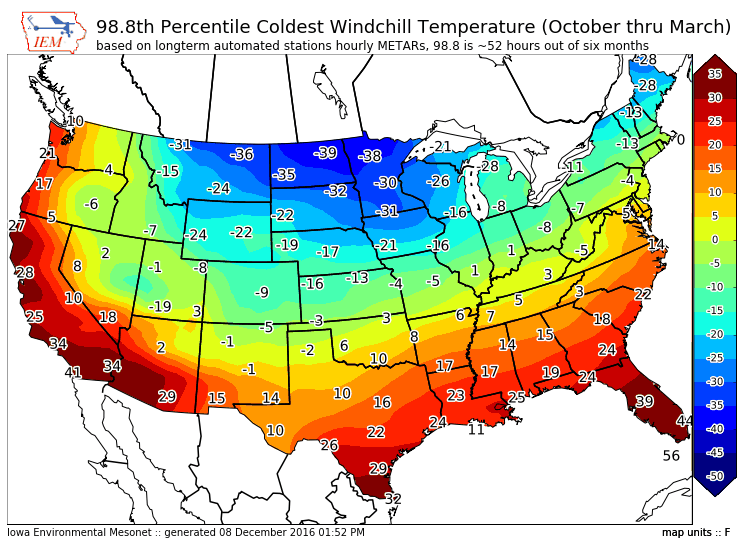
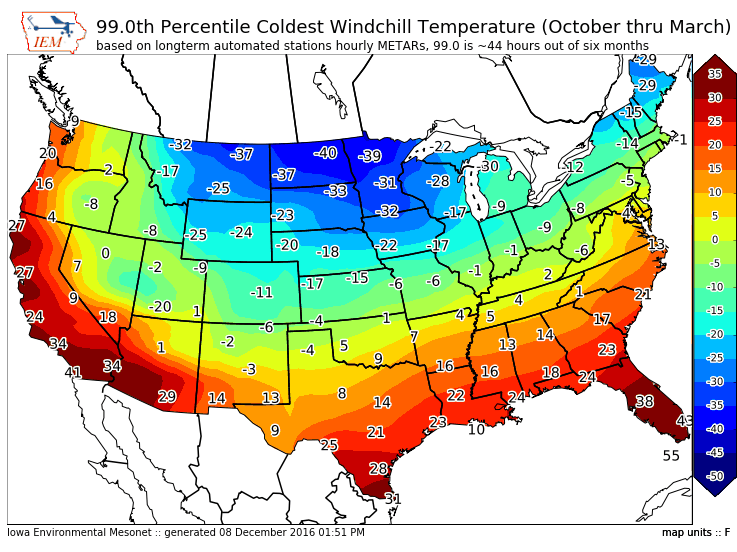
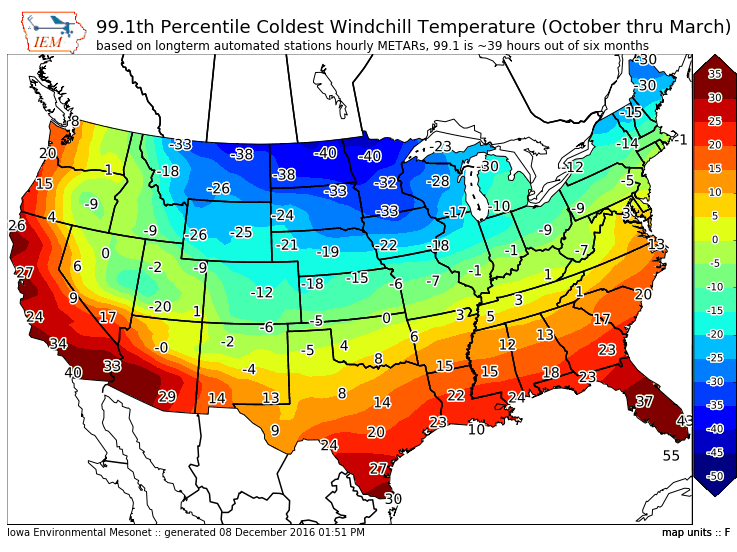
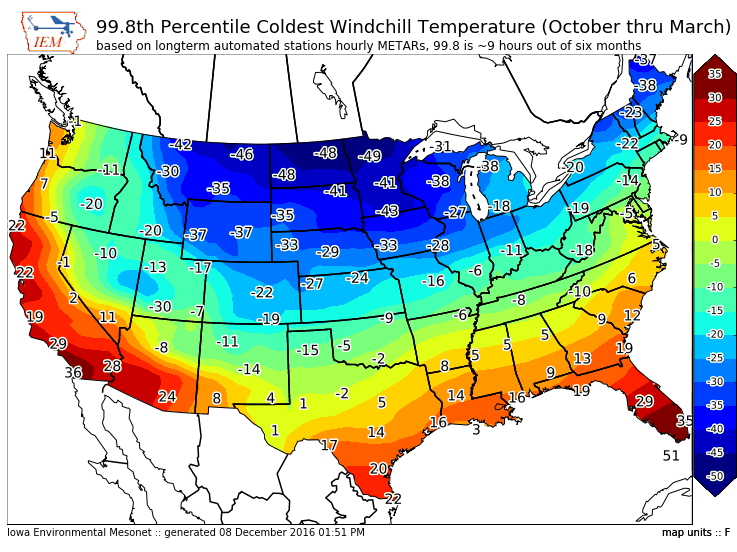
Wind Chill Percentile Maps
1226 ViewsThe IEM Daily Feature this past Friday presented an analysis of wind chill temperature percentiles based on long term hourly data. I have also generated similar maps for other percentiles and have the raw data files for your inspection.
Note that these plots represent the X coldest hourly wind chill temperature and not the coldest stretch of consecutive X hours of wind chill. The later would be good to analyze at some point!