Past IEM Features tagged: humidity
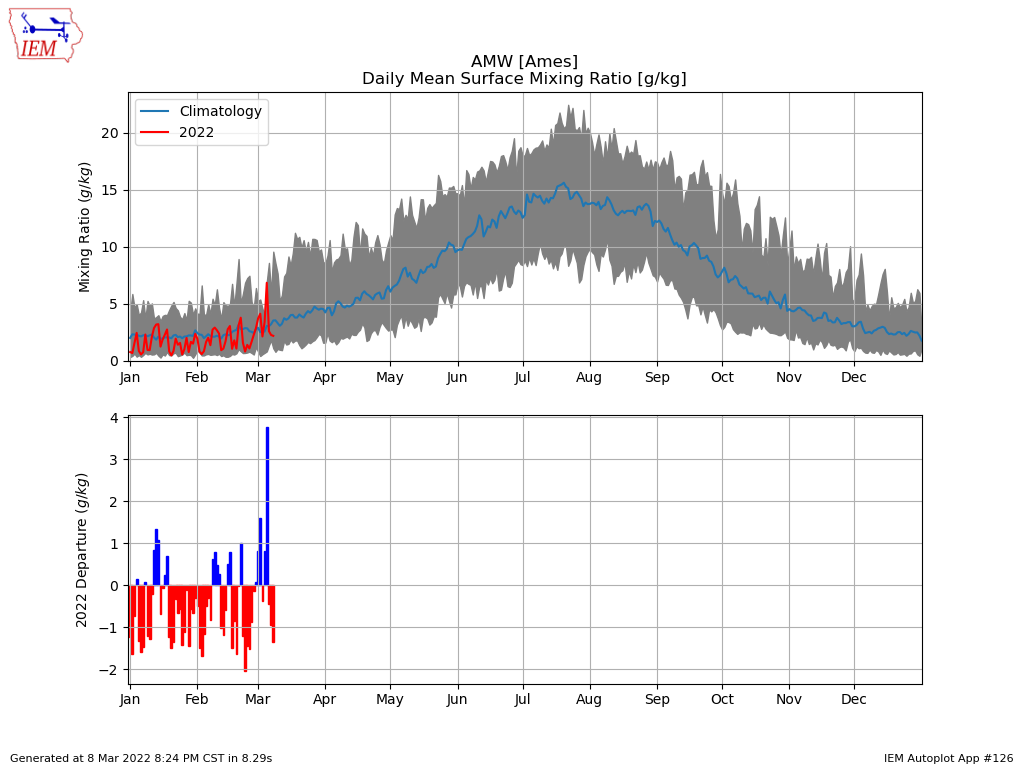
Lack of 2022 Humidity
09 Mar 2022 05:33 AMDrought continues to be of concern as we are rapidly approaching the start of the spring season and the renewed demand for water by all things living around us. This winter season has not done much to put a dent in the drought as humidity levels has been rather low, even for winter season standards. The featured chart presents a climatology of daily mixing ratio for Ames, which is one way to measure the amount of water vapor in the air. The top panel shows the daily envelope, simple average, and 2022 observations. The bottom panel presents the daily departures. So far this year, we have seen very few days with a positive departure (blue). The most recent storm event on Saturday sticks out as elevated humidity levels helped to fuel the storms.
Voting:
Good: 12
Bad: 0
Tags: humidity
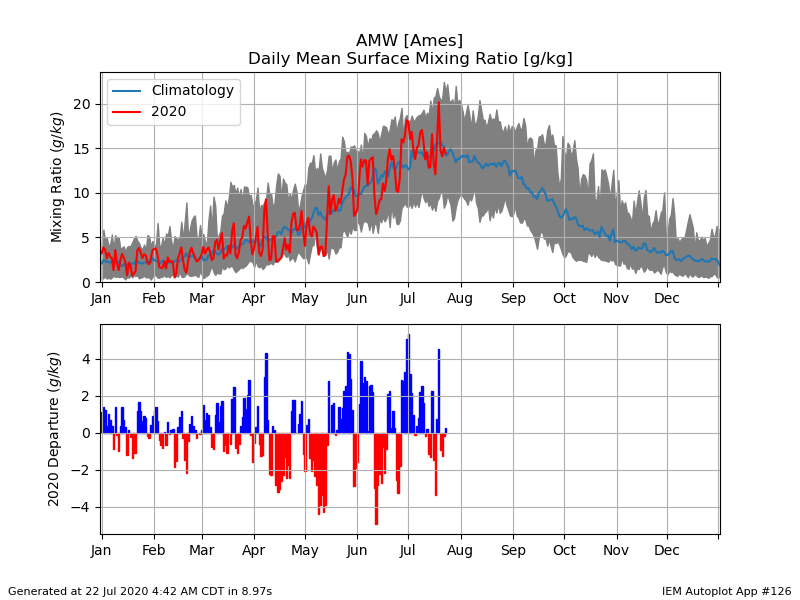
2020 Humidity
22 Jul 2020 04:54 AMThe amount of water vapor the air can hold is a function of its temperature. So it makes sense that the peak in humidity happens about the same time as temperature as shown by the featured chart. The chart presents humidity climatology for Ames expressed in terms of mixing ratio. The envelope of daily data is shown by the gray shaded area, the simple average by the blue line, and this year's values by the red line. The bottom panel shows the daily departure from average. It is interesting to note that even our lowest humidity values on record during the summer are still about double that of the highest winter values. The forecast shows a rise in humidity by the end of the week with a muggy and hot weekend in store.
Voting:
Good: 10
Bad: 0
Tags: humidity 2020
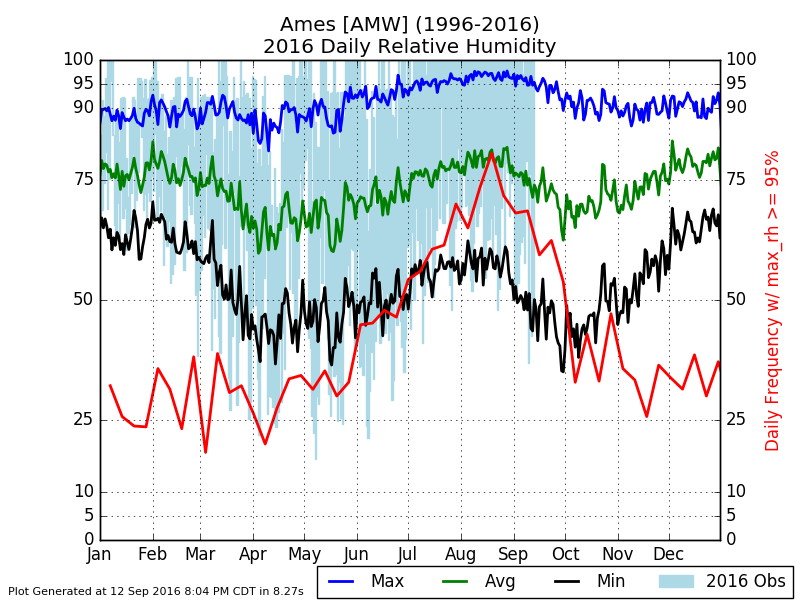
Daily Relative Humidity
13 Sep 2016 05:34 AMRelative Humidity is one of the more commonly expressed weather variables. It represents the percentage capacity that the air is full of water vapor. Since the value is relative, it is difficult to directly compare the value at different air temperatures. While the air certainly feels drier in the winter time, the relative humidity values are just as high as the summer time. The featured chart presents a computed climatology of RH for Ames. The blue bars represent the daily range of RH values for each day this year. The blue, green, and black lines are simple averages of the daily min, avg, and max. The red line represents the frequency of days with the maximum RH at or above 95%. A lot going on with the chart! Of note for this time of year is that relative humidities are dropping. Demand for water and subsequent transpiration by agricultural crops is on the rapid decline. You may have noticed the corn and soybeans are turning brown now! These lower RH values help to dry out the fields and crops to allow for harvest.
Voting:
Good: 8
Bad: 0
Tags: rh humidity

Humidity Levels
22 May 2013 05:44 AMThe featured chart displays an analysis of water vapor surface mixing ratio values for Des Moines. This value is a measure of the amount of water in the air. It is not temperature dependent and can be simply averaged whereas dew point temperature can not. For all the rain and snow we have had, humidity levels have not been often to the extreme high end on a daily basis. Yesterday's levels were about average based on long term data at the site.
Voting:
Good: 113
Bad: 17
Tags: humidity
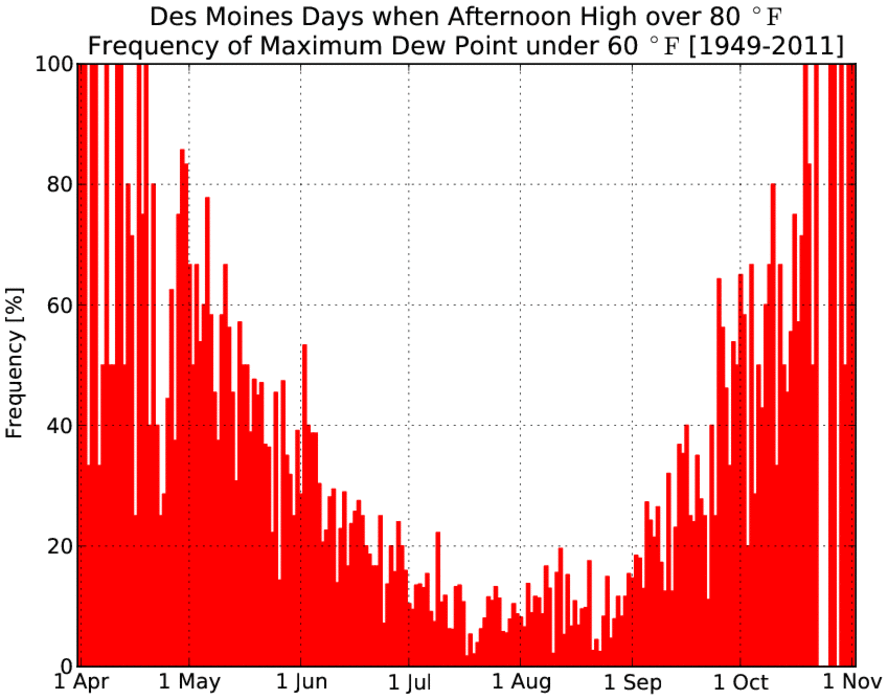
Warm and low humidity
02 Jun 2011 05:55 AMYesterday was a very pleasant day with highs in the low 80s and comfortable humidities with dew points in the 50s. The featured chart presents the frequency of having a dew point temperature below 60 when the afternoon high temperature was above 80. You can see the frequency declines as we get deeper into summer and the humid air becomes unavoidable!
Voting:
Good: 13
Bad: 8
Tags: humidity summer