Past IEM Features tagged: 2009
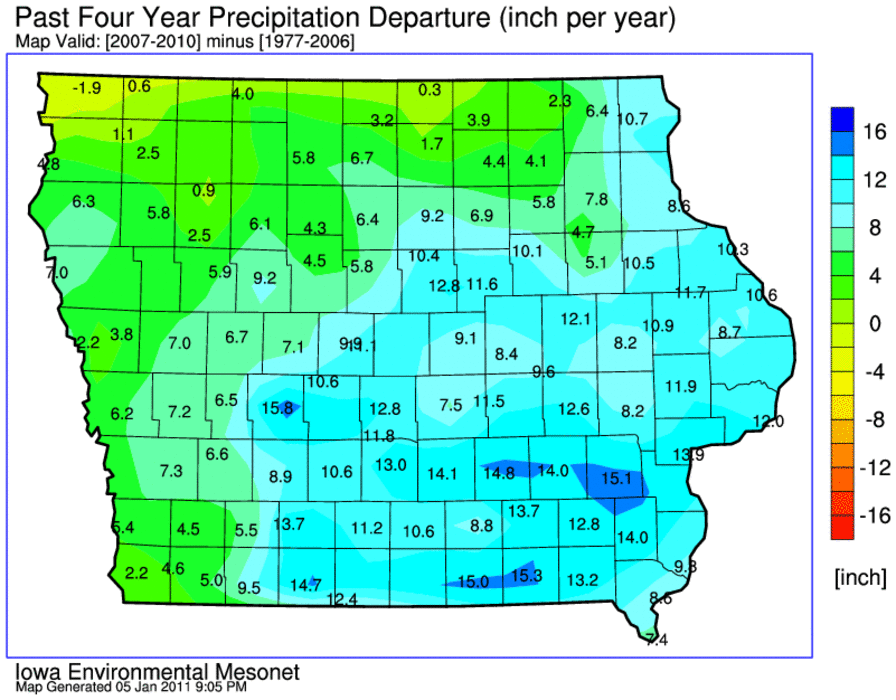
An extra foot
06 Jan 2011 05:51 AMYesterday's feature presented the last four years as being wetter than average statewide. The featured map compares these four years (2007-2010) against the 30 years previous to that. Please note that the units of this chart are inches per year, so a good portion of the state is shown with values in the 10-15 inches range. This means that the past four years have averaged 10-15 inches more per year than the average of the previous 30 years. Some portions of the state have not been as relatively wet and even a deficit appears in far northwestern Iowa.
Voting:
Good: 25
Bad: 2
Tags: precip 2007 2008 2009 2010
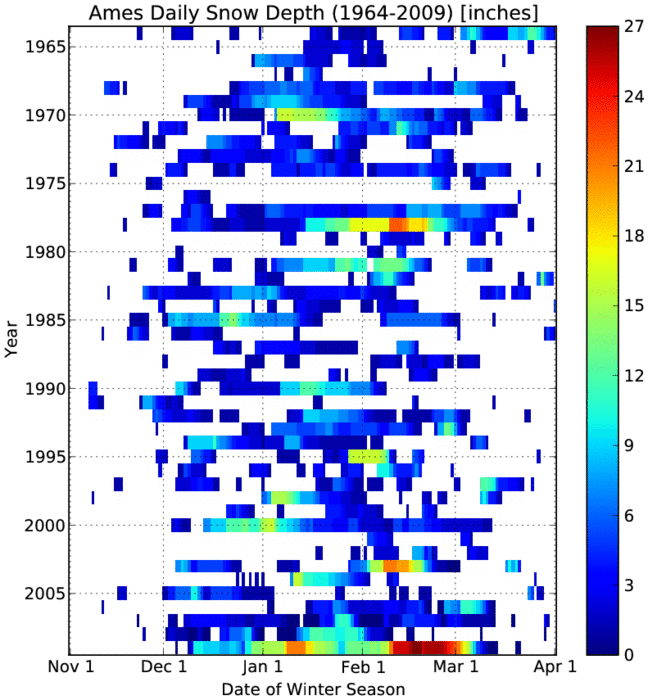
A repeat of last winter?
07 Dec 2010 05:47 AMThe forecast for the coming weekend looks to bring accumulating snow to central Iowa for the first time this season. The featured chart presents the daily snow depth reported near Ames for the previous winter seasons since Nov 1964. Last year certainly sticks out on this chart with deep snow throughout much of February. One also notes that once the snow arrived during the second week of December, it stuck around until mid March! Are we set to repeat this pattern?
Voting:
Good: 22
Bad: 5
Tags: snowcover 2009
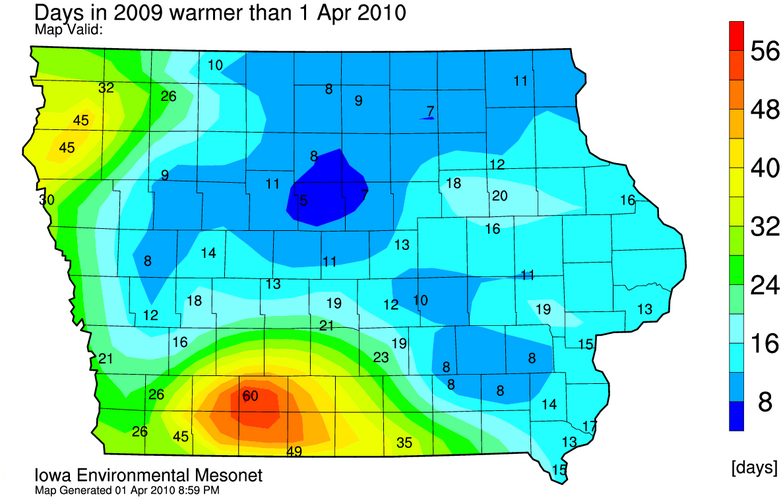
A very warm fool's day
02 Apr 2010 05:08 AMTemperatures soared on Thursday well into the 80s and fell just a few degrees short of records for the date. On a statewide basis, yesterday was warmer than nearly every day during July of 2009! The featured analysis displays the number of days during 2009 that were warmer than 1 April 2010. It is amazing to consider that for some locations, there were only a handful of days during all of 2009 warmer than yesterday! A cold front will sweep the state clean of the really warm air today, but temperatures this weekend will be spring like in the 60s.
Voting:
Good: 63
Bad: 18
Tags: 2009

Monthly ranges
13 Jan 2010 06:11 AMThe featured chart looks at the largest and smallest temperature range for a month based on all COOP observations in Iowa for a given year compared to what was observed in 2009. The months of September, October, and November had an exceptionally small amount of temperature range with November unofficially being the smallest on record. The smallest number on this chart is 44, which means that for any given month, we Iowans will probably experience a 44 degree difference between the warmest high and coldest low temperature.
Voting:
Good: 16
Bad: 8
Tags: climate 2009

2009 Precipitation Totals
30 Dec 2009 06:08 AMThe featured map is an IEM estimated analysis of rainfall percentiles for 2009 (100 representing the largest accumulation). Not everyone in the state had an abnormally wet year with some locations analyzed to be rather dry (below the 25th percentile). Sioux City sticks out in this plot due to a couple of isolated heavy rainfall events this year.
Voting:
Good: 16
Bad: 14
Tags: 2009

Late for cold
02 Dec 2009 06:08 AMThe featured graphic is from a statement put out yesterday by the Des Moines NWS. For various low temperature thresholds, Des Moines has seen the latest date in the year for exceeding the shown values. Effectively, the cold air is late arriving this year. Cooler air is working into the state this morning with highs only in the 30s for the rest of the week.
Voting:
Good: 15
Bad: 5
Tags: 2009
Woefully short
06 Nov 2009 06:37 AMOutside of a warm week or two this growing season, there was not much heat to speak of and our growing degree total was some 400 units short of average. The record cold in July really hurt as it should be the month where we accumulate the most GDDs. A very wet October did not help the still standing crops any as mold is now a major problem with the corn and soybean crops.
Voting:
Good: 30
Bad: 8
Tags: 2009
Warnings per month
05 Nov 2009 06:29 AMThe featured chart displays the monthly number of severe thunderstorm and tornado warnings issued by the National Weather Service for this year and last. In general, the number of warnings is down this year compared with 2008. The most significant difference is the number of tornado warnings in May being half of the total for 2008.
Voting:
Good: 18
Bad: 9
Tags: 2008 2009
Staying above the trend line
03 Nov 2009 06:10 AMThe featured chart is a comparison of the accumulated rainfall for this year and last along with the climatological accumulation. In general, the running total for this year has remained above the climatology with the heavy rainfall in October pushing us well north of average again. We are still a ways from repeating 2008, which is a good thing.
Voting:
Good: 14
Bad: 6
Tags: 2008 2009
Lack of GDDs
29 Jul 2009 06:14 AMThe featured map is a summary of growing degree days based on Iowa ASOS network daily observations. When compared against long term data, the percentile for this year's values are mostly below 10 (blue number). Based on these unofficial numbers, places like Dubuque and Davenport have not seen smaller GDD accumulations for the period of 1 May thru 28 July. More cool weather is in the forecast with highs struggling to reach 70 on Thursday!
Voting:
Good: 10
Bad: 1
Tags: 2009
Watches for the year
06 May 2009 06:19 AMThe featured map is a composite of Storm Prediction Center issued watches for the year with tornado watches in red and plotted on top of the severe thunderstorm watches in yellow. This plot shows how almost the entire south and east of Iowa covered by a tornado watch at some point this year. SPC has Iowa in a slight risk today for things other than tornados (wind and hail), so only expect yellow boxes in our area today!
Voting:
Good: 27
Bad: 11
Tags: 2009
Past 4 months
05 May 2009 06:08 AMThe featured map is an analysis of rainfall accumulation departure from average for the past 4 months. The northwest corner of state is shown near to a few inches below average while the extreme southeast corner is 4-8 inches above. The forecast for the rest of this week has rain chances just about every day.
Voting:
Good: 31
Bad: 8
Tags: 2009