Past Features
This page lists out the IEM Daily Features for a month at a time. Features have been posted on most days since February 2002. List all feature titles.
Mon May 01, 2023
Another Windy April
01 May 2023 05:14 AM
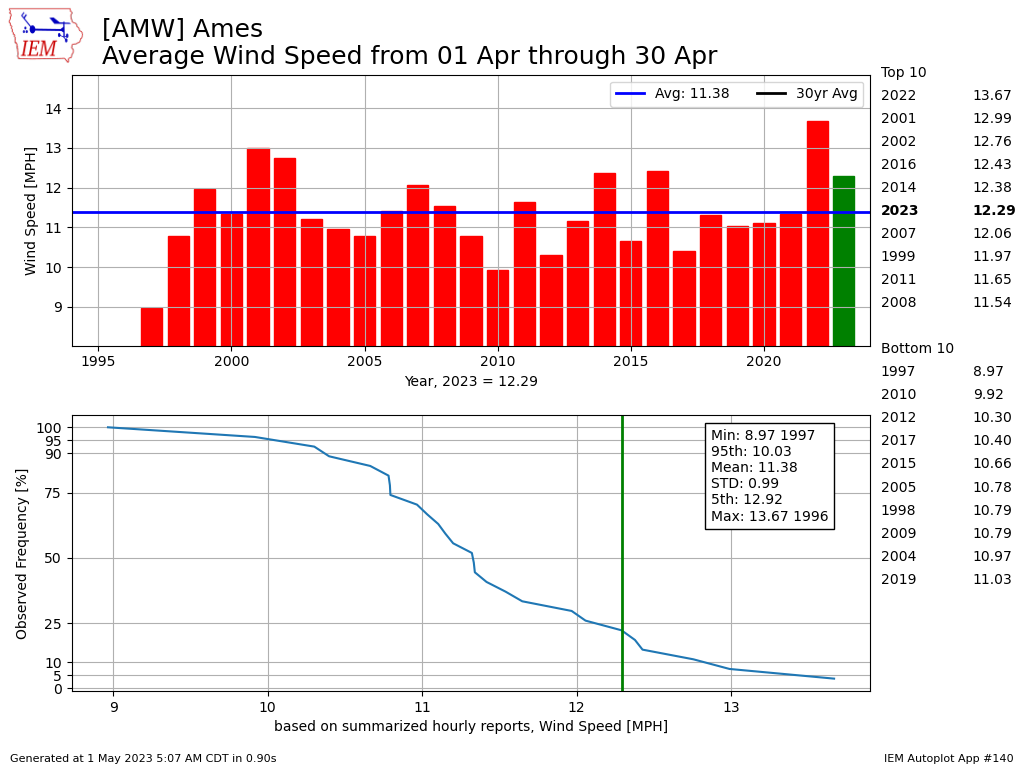
There was considerable talk last year if April 2022 was the windiest April on record in Iowa. The answer to that question is difficult due to complexities with how wind observations have changed over the years. That discussion aside, April 2023 was very windy as well with the featured chart presenting an IEM calculated average wind speed for the Ames Airport. The site only has data back to the mid 1990s, so the period of record data is a bit more comparable, but there have been wind sensor changes with the installation of a sonic anemometer in 2012. The first few days of May will continue where April left off, with plenty of wind.
Voting: Good - 16 Bad - 0
Generate This Chart on Website
01 May 2023 05:14 AM
There was considerable talk last year if April 2022 was the windiest April on record in Iowa. The answer to that question is difficult due to complexities with how wind observations have changed over the years. That discussion aside, April 2023 was very windy as well with the featured chart presenting an IEM calculated average wind speed for the Ames Airport. The site only has data back to the mid 1990s, so the period of record data is a bit more comparable, but there have been wind sensor changes with the installation of a sonic anemometer in 2012. The first few days of May will continue where April left off, with plenty of wind.
Voting: Good - 16 Bad - 0
Generate This Chart on Website
Tue May 02, 2023
30+ MPH Winds
02 May 2023 05:30 AM
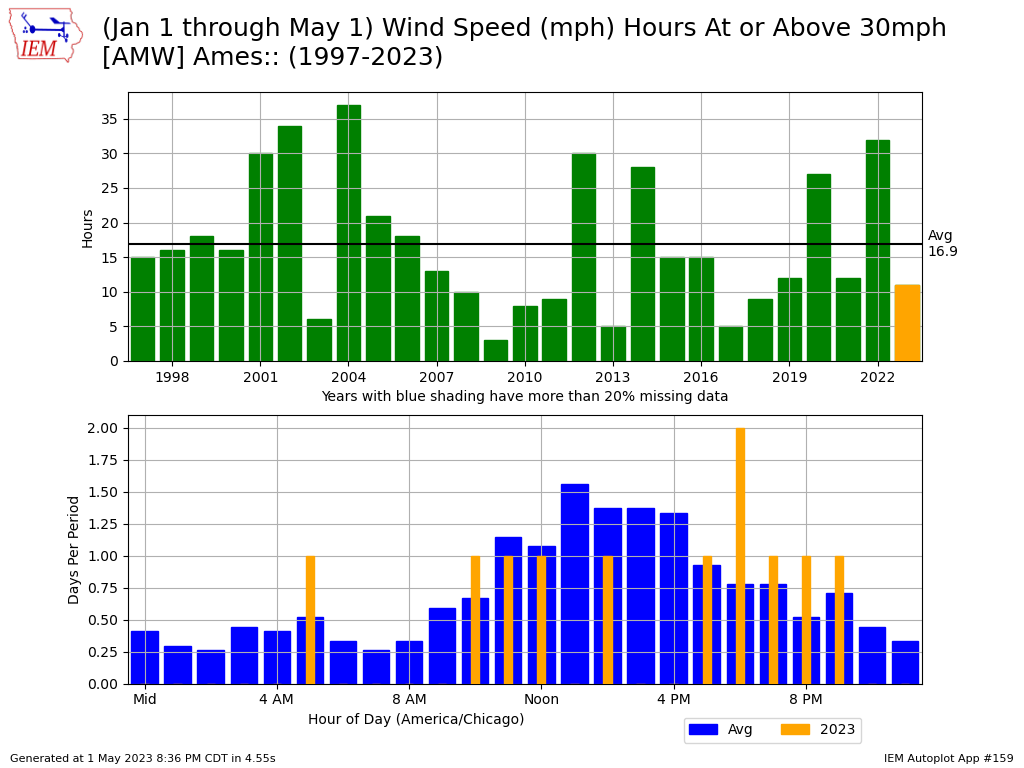
Winds were howling again on Monday with the Ames Airport weather station reporting 30+ MPH sustained winds for a couple of hours during the daylight hours. The featured chart presents the number of such hourly reports each year. This chart is plotting sustained winds, which are an average of three to five second samples over a two minute interval. The top panel shows the number of hours for the year to date period each year on record for the site and the bottom panel breaks it down by hour of the day. This year's total comes in below average and well behind the total to date for 2022.
Voting: Good - 9 Bad - 1
Tags: wind
Generate This Chart on Website
02 May 2023 05:30 AM
Winds were howling again on Monday with the Ames Airport weather station reporting 30+ MPH sustained winds for a couple of hours during the daylight hours. The featured chart presents the number of such hourly reports each year. This chart is plotting sustained winds, which are an average of three to five second samples over a two minute interval. The top panel shows the number of hours for the year to date period each year on record for the site and the bottom panel breaks it down by hour of the day. This year's total comes in below average and well behind the total to date for 2022.
Voting: Good - 9 Bad - 1
Tags: wind
Generate This Chart on Website
Wed May 03, 2023
Days Suitable for Field Work
03 May 2023 05:30 AM
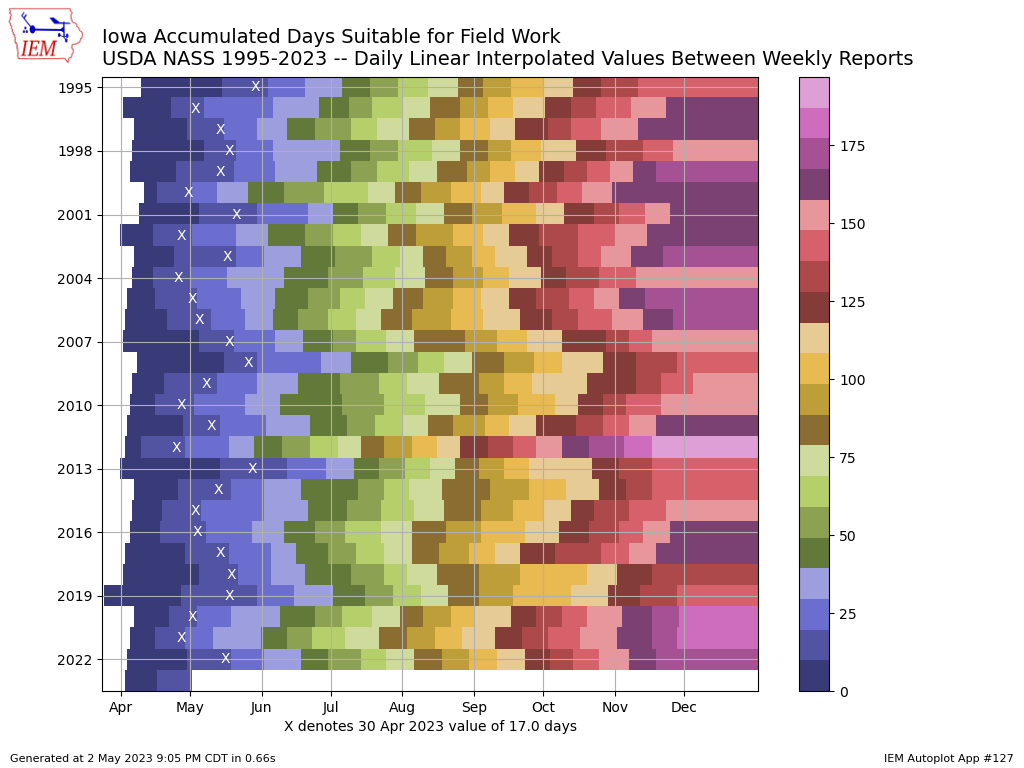
The weekly USDA NASS update released every Monday includes an estimate of the number of statewide days over the past seven days that were suitable for field work. This value is provided at the statewide level and so there are plenty of caveats to consider. The value for 30 April was reported as 4.8 days for Iowa, which is a good number to make crop planting progress. The technicolor dream of a daily feature chart presents the accumulated suitable days for Iowa each year since 1995. The accumulated value for this year stands at 17 days, so the X denotes each previous year's date with a similar value. One can see that we are well ahead of the pace set in 2022, but in line with 2020 and 2021. A number of previous years readily stick out including the difficult spring seasons of 2013 and 2019. The drought year of 2012 is a significant outlier as warm temperatures and persistent drought allowed for rapid accumulation of suitable days.
Voting: Good - 9 Bad - 0
Tags: nass fieldwork
Generate This Chart on Website
03 May 2023 05:30 AM
The weekly USDA NASS update released every Monday includes an estimate of the number of statewide days over the past seven days that were suitable for field work. This value is provided at the statewide level and so there are plenty of caveats to consider. The value for 30 April was reported as 4.8 days for Iowa, which is a good number to make crop planting progress. The technicolor dream of a daily feature chart presents the accumulated suitable days for Iowa each year since 1995. The accumulated value for this year stands at 17 days, so the X denotes each previous year's date with a similar value. One can see that we are well ahead of the pace set in 2022, but in line with 2020 and 2021. A number of previous years readily stick out including the difficult spring seasons of 2013 and 2019. The drought year of 2012 is a significant outlier as warm temperatures and persistent drought allowed for rapid accumulation of suitable days.
Voting: Good - 9 Bad - 0
Tags: nass fieldwork
Generate This Chart on Website
Thu May 04, 2023

Days till one inch
04 May 2023 05:30 AM
After drought plagued much of Iowa over 2022, we had a very wet cold season, but frozen soils limited infiltration and totals during the cold season are difficult to offset large deficits during the growing season. So we are now squarely into the growing season and drought concerns are quickly increasing. The featured map presents the number of days to go back in time before accumulating at least one inch of total precipitation. This map nicely shows the areas of the state that have recently been very dry. The good news is that there are chances of rain in the forecast, but how widespread and significance remain in doubt. The rains of 2022 were very fickle and highly variable, which appears to be how the growing season of 2023 is starting off as well.
Voting: Good - 10 Bad - 0
Generate This Chart on Website
Fri May 05, 2023
500hPa Heights Falls + Thunder Reports
05 May 2023 05:30 AM
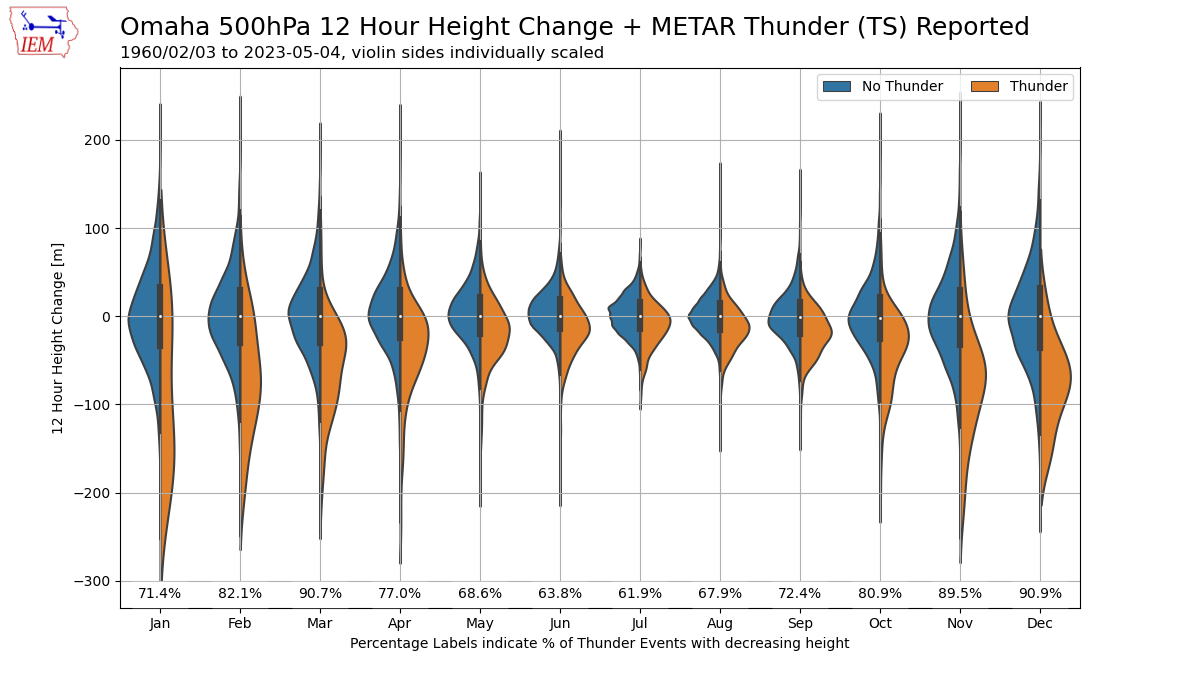
With hopefully a return to thunderstorms in store over the coming days, the featured chart takes a bit of a deep dive into some meteorology regarding thunderstorm forecasting. A vital set of observations to understand the state of the atmosphere are the twice daily soundings taken by the NWS. These soundings report observations at mandatory pressure levels as the balloons ascend to help produce consistent spatial analyses over the globe. Perhaps the most important pressure level for meteorologists is 500 hPa, which is approximately a half way point (from a mass perspective) and often can provide insights into atmospheric stability and steering currents to forecast storms. The vertical height above sea level and how it is changing with time can yield first pass assumptions on if the air in the column is rising or sinking. For storms, rising air is desired. So the featured chart compares the 12 hour change in 500 hPa height and if thunder was observed over this same 12 hour period based on sounding and METAR/airport data from Omaha, NE. The data is partitioned by month and if thunder was or wasn't observed. The data is presented as split violin plots, so to give a sense of the distribution of the values. An important note is that the two sides are not equally scaled. The labels near the bottom indicate the percentage of thunder cases that coincided with decreasing heights. Whew! So what insight does this chart provide? First, it is clear that decreasing heights are dominant for thunder cases during the cold season. They are less coincident during the summer season, how could that be? The scale of the storm systems involved is the explanation as cold season thunder activity is associated with large storm systems that will be easily sampled by the twice daily soundings. During the summer time, thunderstorm complexes are smaller scale and driven by more subtle features in the atmosphere, which are not easily diagnosed by twice daily soundings.
Voting: Good - 15 Bad - 0
Tags: meteorology sounding thunder
05 May 2023 05:30 AM
With hopefully a return to thunderstorms in store over the coming days, the featured chart takes a bit of a deep dive into some meteorology regarding thunderstorm forecasting. A vital set of observations to understand the state of the atmosphere are the twice daily soundings taken by the NWS. These soundings report observations at mandatory pressure levels as the balloons ascend to help produce consistent spatial analyses over the globe. Perhaps the most important pressure level for meteorologists is 500 hPa, which is approximately a half way point (from a mass perspective) and often can provide insights into atmospheric stability and steering currents to forecast storms. The vertical height above sea level and how it is changing with time can yield first pass assumptions on if the air in the column is rising or sinking. For storms, rising air is desired. So the featured chart compares the 12 hour change in 500 hPa height and if thunder was observed over this same 12 hour period based on sounding and METAR/airport data from Omaha, NE. The data is partitioned by month and if thunder was or wasn't observed. The data is presented as split violin plots, so to give a sense of the distribution of the values. An important note is that the two sides are not equally scaled. The labels near the bottom indicate the percentage of thunder cases that coincided with decreasing heights. Whew! So what insight does this chart provide? First, it is clear that decreasing heights are dominant for thunder cases during the cold season. They are less coincident during the summer season, how could that be? The scale of the storm systems involved is the explanation as cold season thunder activity is associated with large storm systems that will be easily sampled by the twice daily soundings. During the summer time, thunderstorm complexes are smaller scale and driven by more subtle features in the atmosphere, which are not easily diagnosed by twice daily soundings.
Voting: Good - 15 Bad - 0
Tags: meteorology sounding thunder
Mon May 08, 2023

Iowa SVR Warnings by Date
08 May 2023 05:38 AM
Sunday felt like summer with heat and humidity helping to fire severe thunderstorms. The featured chart presents the daily number of Severe Thunderstorm Warnings issued by the NWS for Iowa. Yesterday's total was the highest so far this year with 66 warnings issued. The forecast for this week has a few quite days before a return of rainfall chances on Wednesday and lasting into the weekend.
Voting: Good - 10 Bad - 1
Generate This Chart on Website
Tue May 09, 2023

Catching May 1934
09 May 2023 05:30 AM
May has gotten off to a rather warm start with another warm day yesterday. With more warmth in the immediate forecast, perhaps one wonders if we could be set for the warmest May on record? Well for Des Moines, the featured chart shows that it is very unlikely. The chart presents the month to date accumulated average daily temperature for May 1934, this May, and then the combination of this May and each of the previous May's 9th through 31st appended. If we assume that what happens for the rest of this May falls within what previously has happened, we end up with 0 percent of these scenarios betting May 1934! The comparison for the first week of the month tells the story as some chillier overnight lows to start off the month really pulled down the accumulated average.
Voting: Good - 11 Bad - 1
Generate This Chart on Website
Wed May 10, 2023
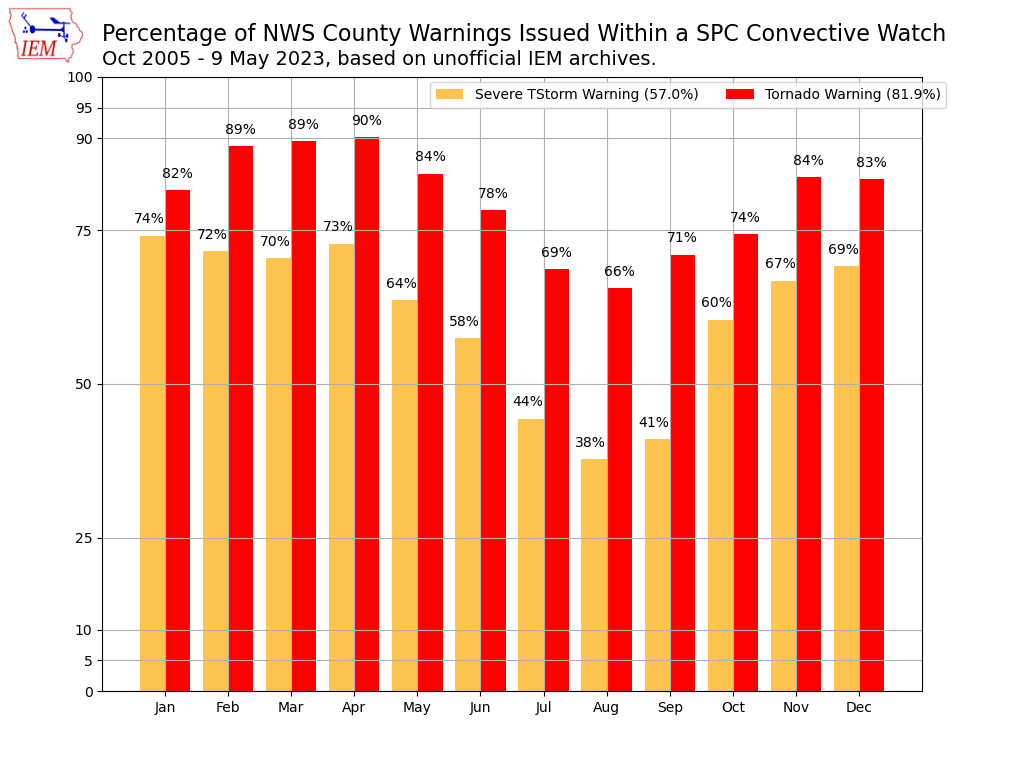
NWS Warnings Within Watch
10 May 2023 05:30 AM
As a part of the National Weather Service's mission of protecting life and property, they issue watches and warnings for storms capable of producing damaging winds, hail, and/or tornadoes. The watch is typically issued ahead of time when conditions are favorable for severe storms to develop and a warning is issued when severe conditions are imminent. Of course, not all NWS warnings occur within an area that is currently under a watch. The featured chart looks into this frequency by computing the percentage of severe thunderstorm or tornado warnings that were issued when a watch was in effect for the warned county. The data is partitioned by month as there is a clear annual signal to this metric and is easily explained. Watches are issued for organized severe weather events that have considerable spatial and temporal scale. Summer time severe weather is very often isolated, slower moving, and limited to the late afternoon during peak heating, all of which don't lend well to the watch process.
Voting: Good - 11 Bad - 0
Tags: watch warning
Thu May 11, 2023
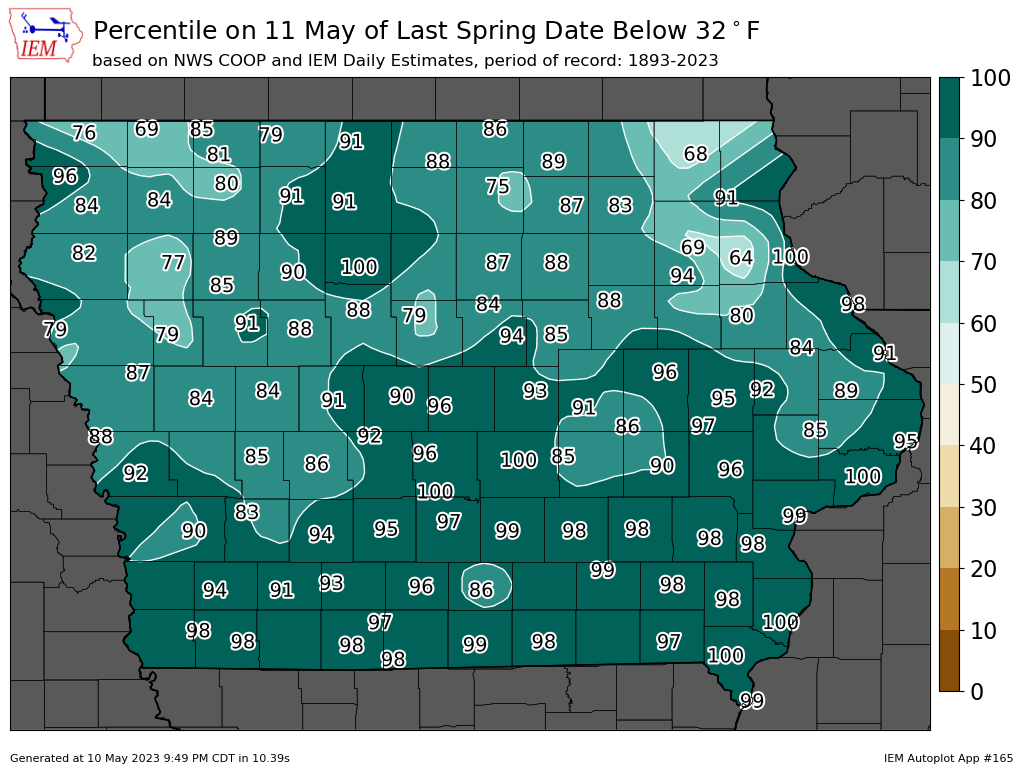
Time Yet for Sub-32
11 May 2023 05:30 AM
It is always a nervous time of year in Iowa with tender vegetation emerging from the ground and still some climatological risks of freezing temperatures. The featured chart presents the computed percentile of having the last day below 32 degrees on or prior to 11 May. For example, a value of 85 would indicate that 15% of previous years on record had a sub 32 temperature after 11 May. So for much of the state, the risks are rather low by this date, but there are some areas prone to cold events with significant frequencies yet. The good news is that the forecast over the next 7-10 days continues to remain warm, so it would seem we can make it out of spring without any more widespread freeze events.
Voting: Good - 13 Bad - 1
Generate This Chart on Website
Fri May 12, 2023
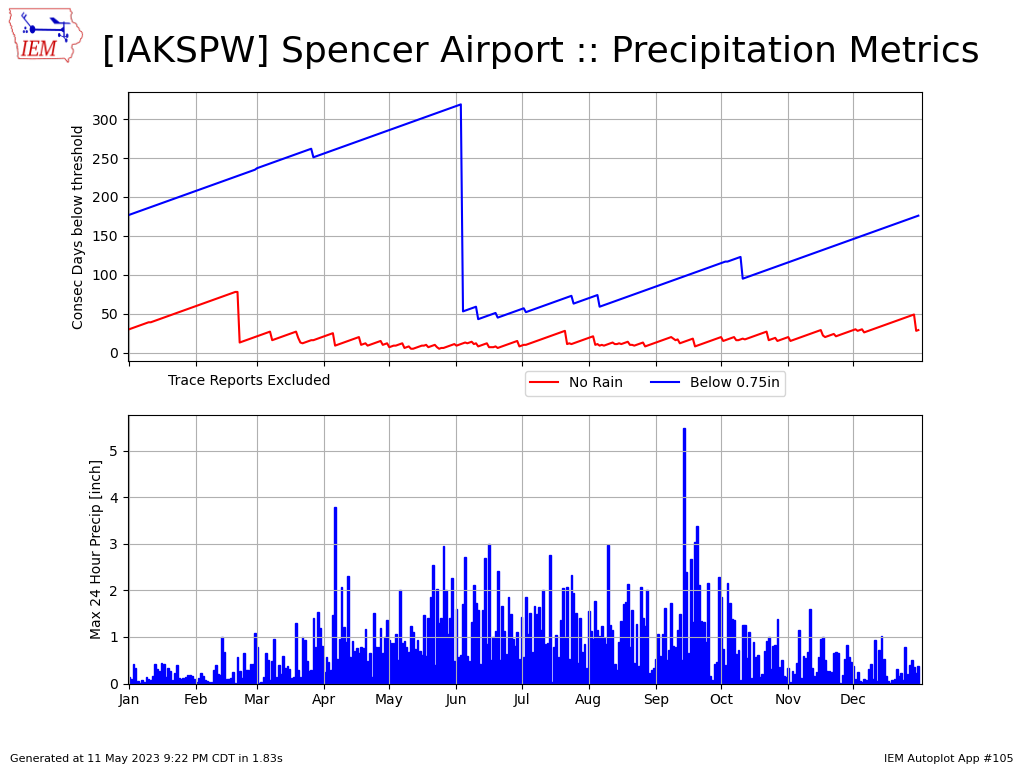
Spencer Precip Streaks
12 May 2023 05:30 AM
Since reporting 1.18 inches back on 27 August 2022, the Spencer, IA observation site has not reported more than 0.75" of precipitation on a given day making for a streak of about 258 days with such an event. The featured chart presents some precipitation metrics for the site with the top panel showing the longest consecutive period without any measurable precipitation and under 0.75" inches for a day. The bottom panel shows the record daily rainfall. So the current 258 day streak isn't too far from the longest on record, but it is difficult to imagine the streak lasting into late July to surpass the longest on record.
Voting: Good - 13 Bad - 1
Generate This Chart on Website
Mon May 15, 2023
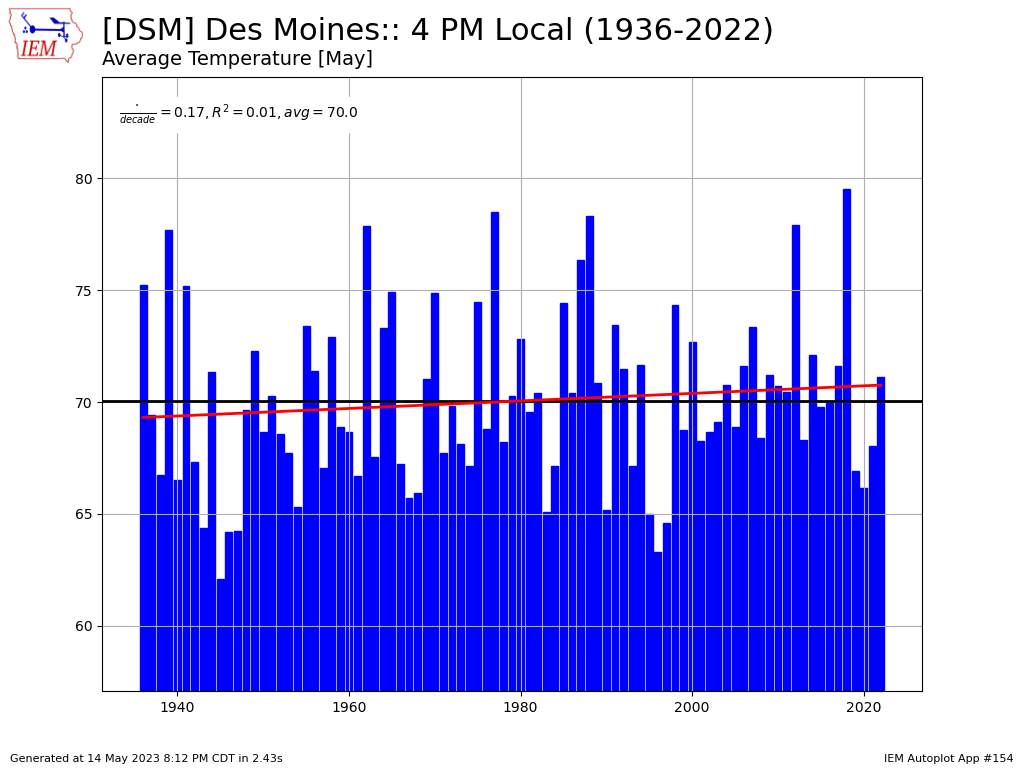
Chilly Afternoon for May
15 May 2023 05:30 AM
Hopefully the warmth for your mother made up for the lack of warmth outside as drizzle, thick clouds and breezy winds made for a chilly May afternoon. The featured chart presents the yearly May average 4 PM temperature for Des Moines. The 4 PM temperature yesterday was just 60 degrees, so about 10 degrees below a simple average. It is interesting to denote that the previous three years were all below long term average, with the month to date this May being slightly above. Monday will be a bit chilly as well before warm returns on Tuesday.
Voting: Good - 9 Bad - 1
Generate This Chart on Website
Tue May 16, 2023
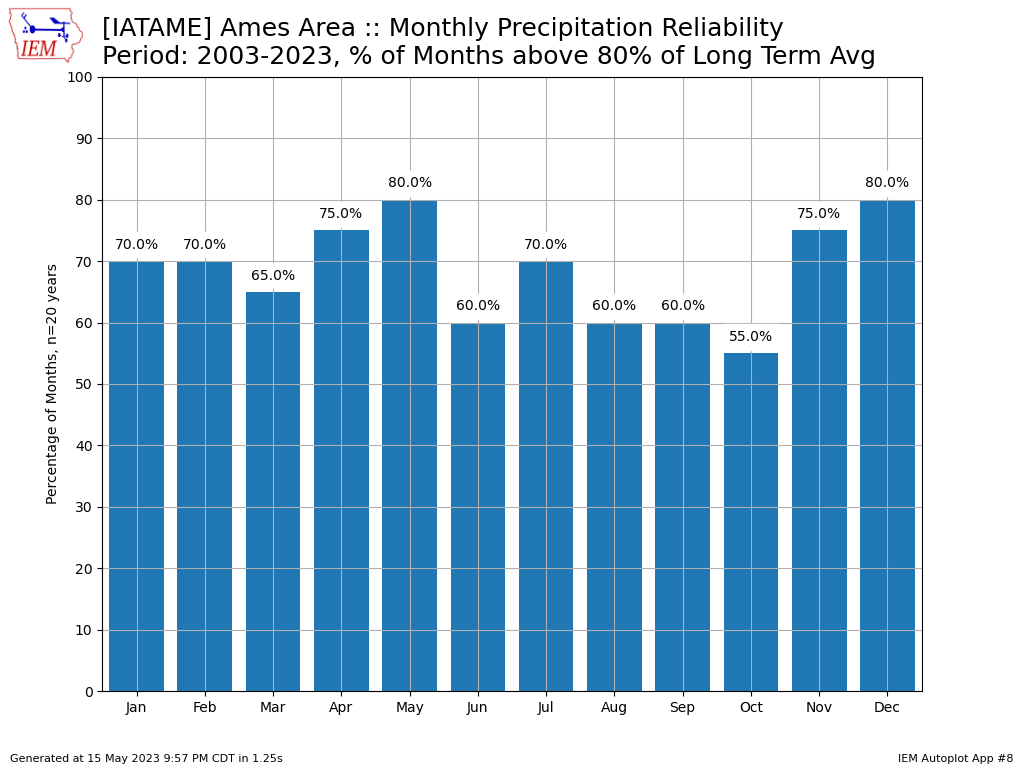
May Precip Reliability
16 May 2023 05:30 AM
At the half way point of May, the precipitation total for Ames is on pace to meet the monthly climatology by the end of the month. The featured chart looks into the reliability of a given month meeting at least 80% of the climatology over the past 20 years. Rewording, which months over the past 20 years have been the most reliable for producing climatological rainfall. It is interesting to see the months of May and December tied for most reliable on this chart. The month of October is shown as the laggard. The forecast for the next seven days just has a good chance of rain on Thursday into Friday, but dry and warmer otherwise.
Voting: Good - 9 Bad - 1
Generate This Chart on Website
Wed May 17, 2023
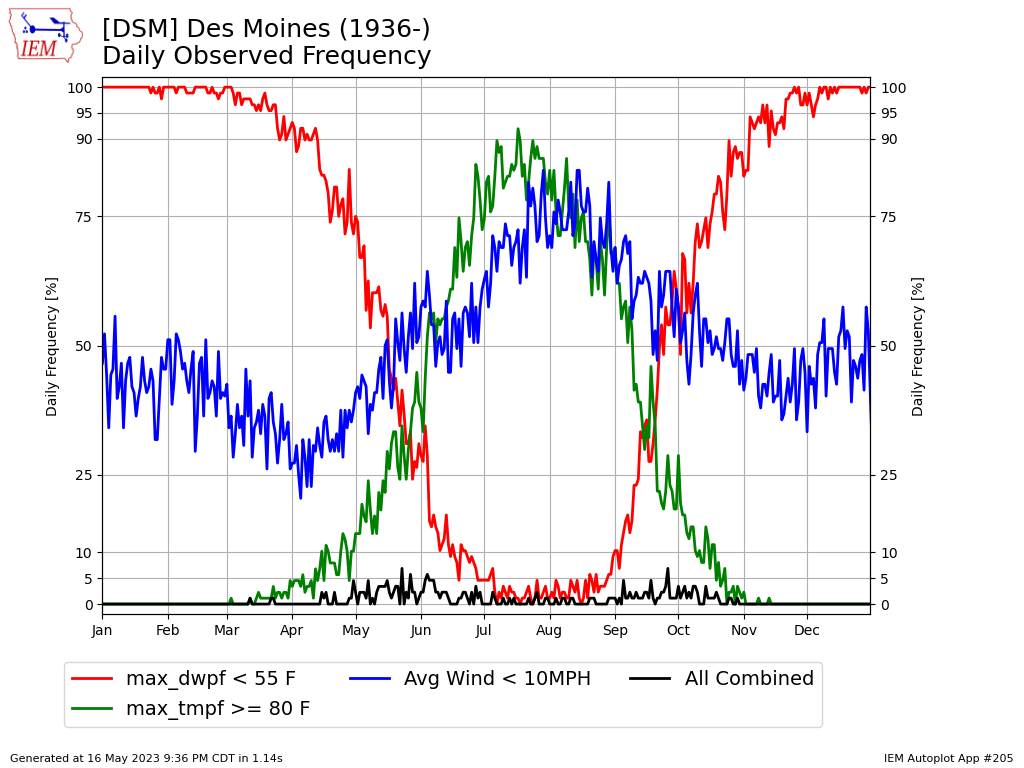
Great Day in May
17 May 2023 05:30 AM
Tuesday was a very nice day with sunshine, warm temperatures, not much humidity, and not much wind! The featured chart looks at the frequency of having a day with the combination of a high of at least 80, a max daily dew point below 55, and an average wind speed below 10 MPH. While individual frequencies have clear annual cycles, the combination of these three is a rather rare occurrence, but you can see how May is a month these are possible as the three individual frequencies have substantial non-zero values during the month. The same juxtaposition happens during September.
Voting: Good - 7 Bad - 0
Generate This Chart on Website
Thu May 18, 2023

Smoke Impact on Solar Rad
18 May 2023 05:30 AM
Smoke from the Canadian wildfires was very noticeable on Wednesday and without much for clouds in the sky, the impact of the smoke on received solar radiation can be generally inferred. The featured chart compares a one minute time series of solar radiation from the ISU Soil Moisture Network station at Kanawha for Wednesday and the previous day, which was a mostly clear day. The bottom panel directly contrasts the two and the smoke impact of about negative 75 Watts per meter squared can be seen. The legend shows the integrated radiation total expressed in megajoules. The net impact was about a 10% decrease in solar radiation. So is the net impact of smoke filled skies always negative for solar radiation? Well, maybe not as smoke filled skies can suppress afternoon cloud development, which would have decreased received solar radiation by perhaps higher amounts. But the general case is likely often negative.
Voting: Good - 10 Bad - 0
Fri May 19, 2023

May Precipitation
19 May 2023 05:30 AM
A new growing season is underway and precipitation is again being fickle. The featured map presents IEM computed precipitation departures for May through the 18th based on NOAA MRMS estimates. The recently released US Drought Monitor is overlaid as well. A number of pockets of dryness are apparent with the worst conditions shown south of Ottumwa and near Omaha. Having dry weather this time of year can be good to allow spring field operations to complete, but this is also a time of the year when we should be getting substantial rainfall to recharge soil moisture. Additionally, newly germinated crops need to find moisture at shallow depths to support growth. The forecast for the next seven days looks very dry, so it appears drought will continue to be of great concern.
Voting: Good - 16 Bad - 0
Generate This Chart on Website
Mon May 22, 2023
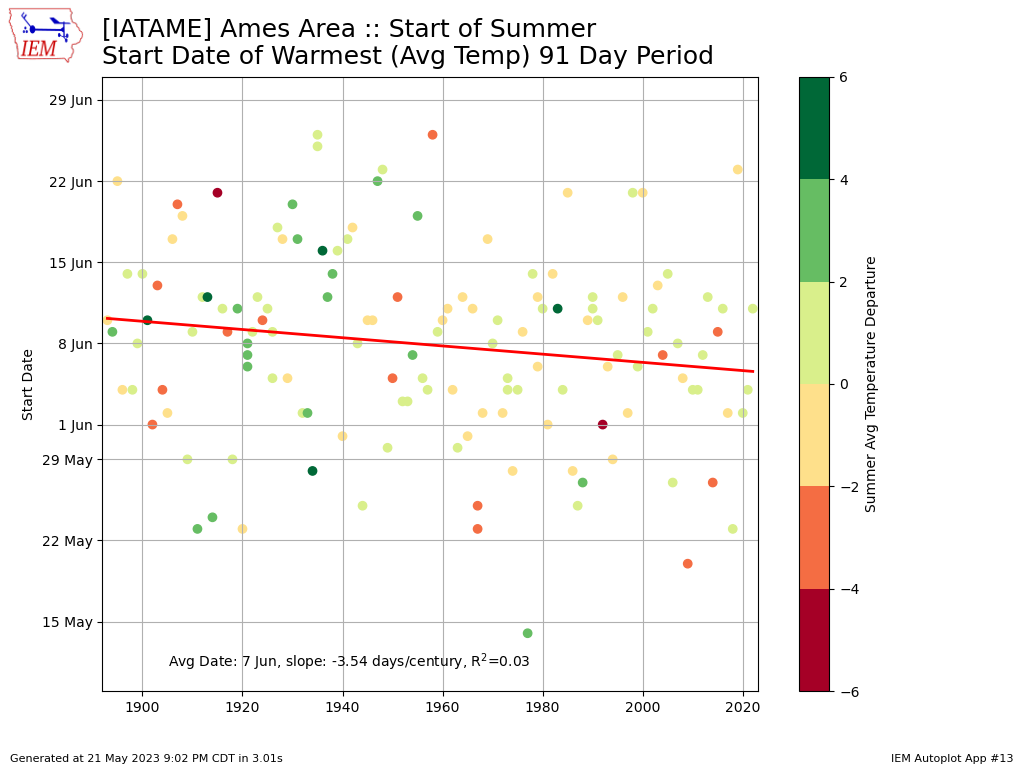
Summer is Nigh
22 May 2023 05:30 AM
With Memorial Day weekend clearly in view, the summer season is at hand. Some say summer starts with Memorial Day weekend, others say 1 June, and others say the solstice around 21 June. A data driven and backward looking approach could consider the 91 consecutive days for a given year with the warmest average temperature as the summer season. The featured chart presents the start date of each yearly period for Ames. A simple trend line is fit to the data and the dots are colored by the temperature departure from average for that given year. The simple average is indicated to be around 7 June, so perhaps we can enjoy the spring season for ten more days!
Voting: Good - 8 Bad - 0
Tags: season summer
Generate This Chart on Website
Tue May 23, 2023
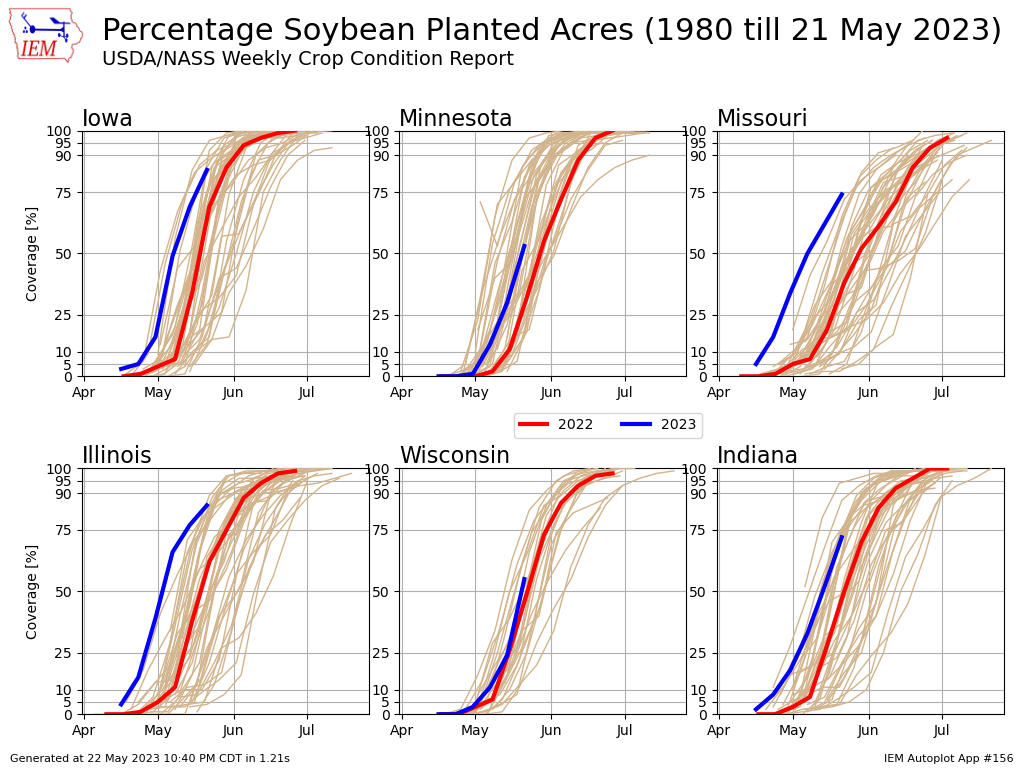
Soybean Progress
23 May 2023 05:30 AM
While we certainly could use some rain, the recent dry weather has allowed significant planting progress to be made as shown by the weekly USDA NASS update released yesterday. The featured chart presents the weekly soybean crop planting progress for six states. All of the years with data are plotted and this year along with last year are highlighted for comparison. All of the states shown are ahead of last year and above 50% completed.
Voting: Good - 12 Bad - 1
Tags: nass soybean planting
Generate This Chart on Website
Wed May 24, 2023

Weather Three-Peat
24 May 2023 05:30 AM
The weather has had a remarkable consistency to it for the past few days with the featured chart presenting a meteogram for Ames between Sunday and Tuesday. The diurnal cycle for the three days shows the consistency with daytime heating warming air temperatures nicely and increasing winds only to cool off and slacken to calm during the overnight hours. Brief drops in visibility for the first two days can be seen during the early morning hours as the temperature reaches the dew point and some fog develops. This weather is certainly nice to enjoy while being outside, but we really could use some rain. The near term forecast continues to look bone dry with rain chances staying off to our west.
Voting: Good - 11 Bad - 0
Generate This Chart on Website
Thu May 25, 2023
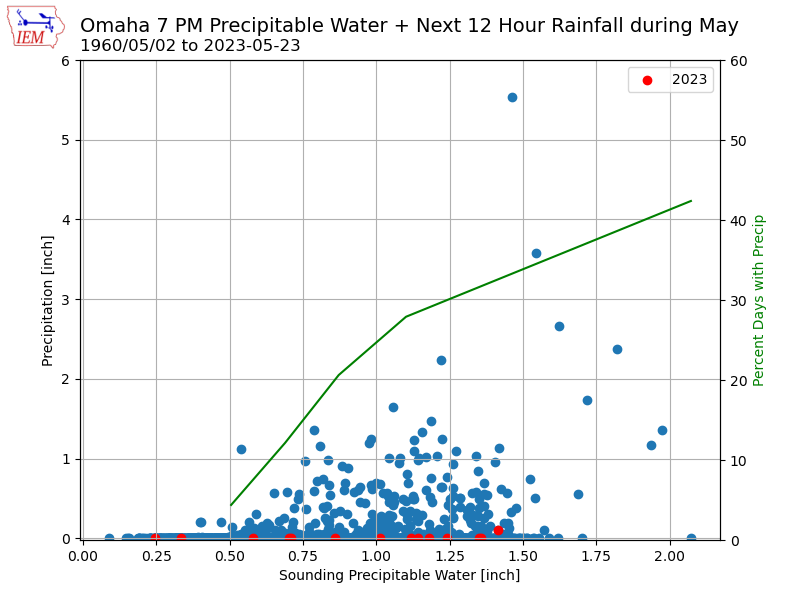
May Precipitable Water + Rain
25 May 2023 05:20 AM
The NWS office near Omaha launches a weather balloon at 7 AM and 7 PM each day to sample the troposphere for weather variables like temperature, humidity, pressure, and wind speed. This vertical profile can be evaluated for the amount of water vapor present and is expressed as a liquid water depth called precipitable water. Rewording, if you condensed all the water vapor in a column of air, what depth of water would that equate to. This metric is very useful for a number of weather forecasting needs as it can ballpark potential rainfall rates. The featured chart compares the 7 PM sounding for May precipitable water against the following twelve hours of accumulated precipitation for Omaha. The dots represent the combination of those two and the line is an estimate of the percentage of days with precipitation. The chart nicely shows the usefulness of this metric for precipitation forecasting. It is very difficult for a dry (low precipitable water) atmosphere to produce precipitation and higher precipitable water amounts allow for larger precipitation totals. The red dots show the 2023 values.
Voting: Good - 11 Bad - 0
Tags: precipitablewater sounding
Fri May 26, 2023
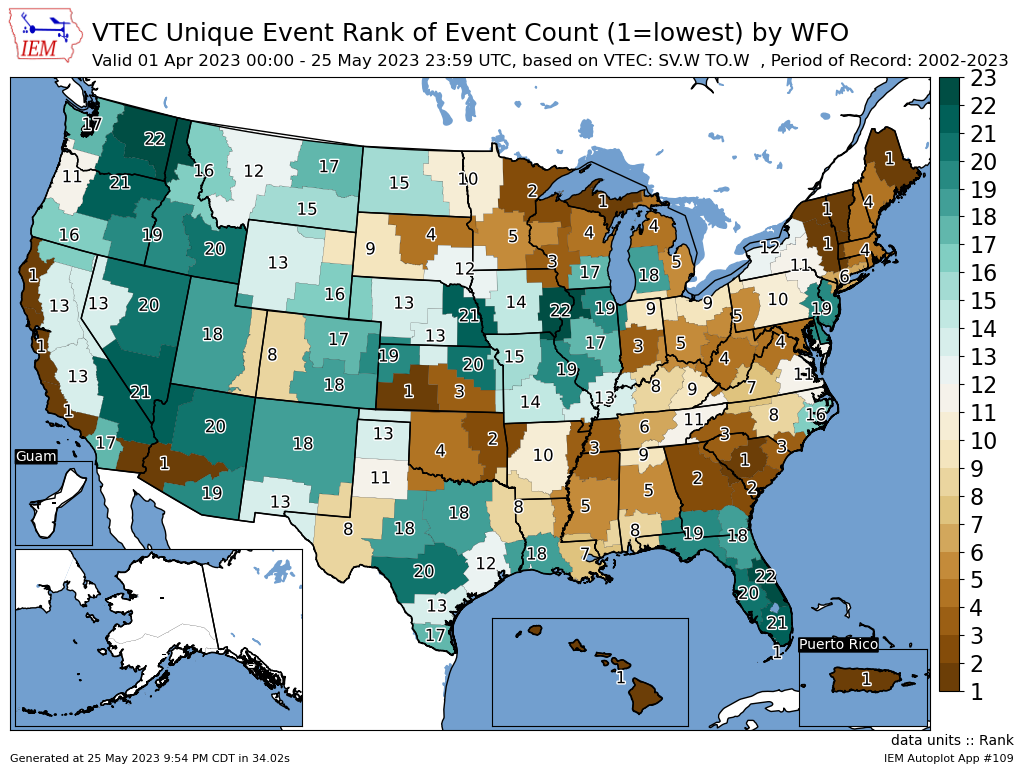
SVR + TOR Warning Ranks
26 May 2023 05:30 AM
The featured map is an unofficial attempt by the IEM to rank the total number of severe thunderstorm and tornado warnings issued since 1 April this year vs each year since 2002 by NWS Office. With 22 years of record, a value of 22 would indicate the highest total over this period of days. This map shows a lot of variability, but some regional signals can be seen. For Iowa, Davenport ranks at the top and Omaha with the second highest total for each respective office. La Crosse, WI is at the other end with the third lowest total. While severe weather is not desired at any point in the year, they are coincident with thunderstorms and storm complexes that often bring needed rainfall. The present forecast continues to be very dry with perhaps our first chance of storms returning late into next week.
Voting: Good - 12 Bad - 1
Generate This Chart on Website
Mon May 29, 2023

Two Dry Weeks
29 May 2023 05:33 AM
The featured map presents NOAA MRMS precipitation estimates over the past two weeks. The vast majority of the state has seen little to no rainfall over this period. Considering that May should be one of our wettest months of the year, having dryness now does not bode well. The weather is changing this week though with many chances of rain and thunderstorms along with more humid conditions. Air temperatures will be warmer as well with highs into the 90s. It will certainly feel like summer.
Voting: Good - 6 Bad - 0
Generate This Chart on Website
Tue May 30, 2023

Dry Two Weeks for Corn Belt
30 May 2023 05:30 AM
Since mid May, it has been very dry for much of the Corn Belt region of the US. The featured map presents the number of consecutive days without measurable precipitation (red numbers) or number of consecutive days with precipitation (negative blue numbers). A majority of the corn belt is shown in the 10 to 15 day range ending on Monday. While chances of rain are in the forecast for Iowa this week, the extent to which those chances make it east to other portions of the corn belt remains in doubt.
Voting: Good - 11 Bad - 0
Generate This Chart on Website
Wed May 31, 2023

Omaha May Min Precipitation
31 May 2023 05:30 AM
One of the driest areas of the state this May has been far southwestern Iowa near Omaha. Across the border in Omaha itself, it has been even drier. Omaha currently stands to set a minimum precipitation total record for May of just 0.17 inches. The featured chart presents the May precipitation totals for the site over the period of record. Of course, there is a chance of showers there today, which would count for the May precipitation total. The second highest total is 0.55 inches back in 1925 and 1989, so it could rain there some today and still set a record!
Voting: Good - 11 Bad - 0
Generate This Chart on Website