Past Features
This page lists out the IEM Daily Features for a month at a time. Features have been posted on most days since February 2002. List all feature titles.
Wed Feb 01, 2023
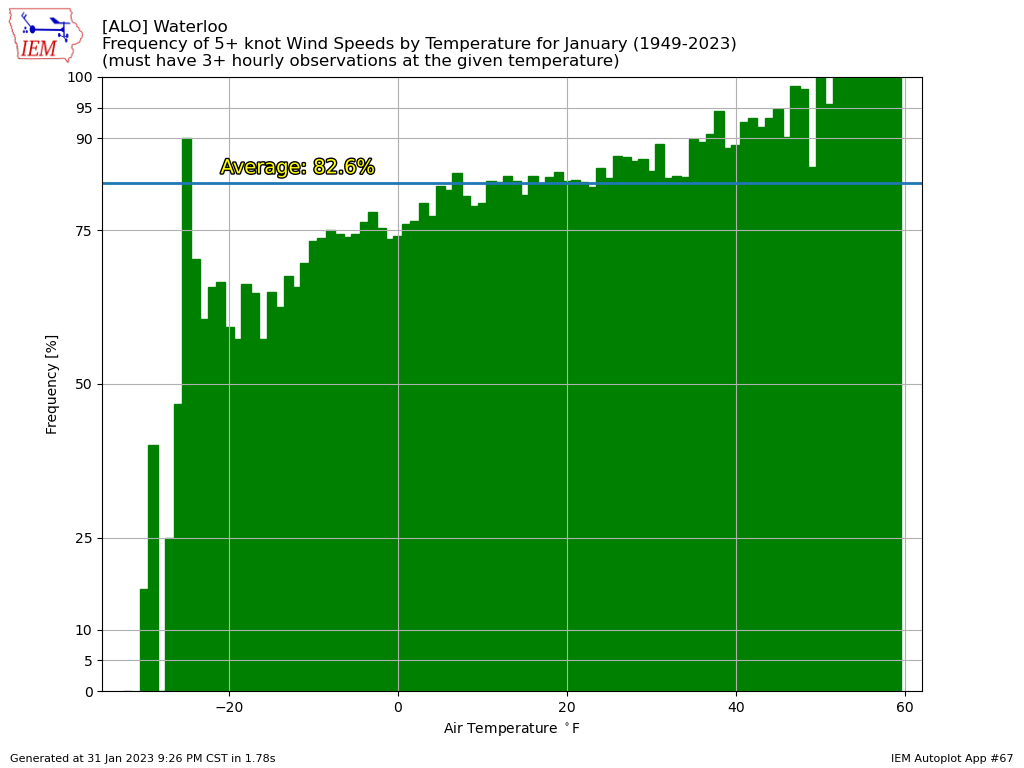
January Wind Frequency by Temp
01 Feb 2023 05:30 AM
The bottom dropped out for temperatures over northern Iowa on Tuesday morning thanks to ample new snow cover, a surface high nearby allowing for clear skies and calm winds. Waterloo was able to reach -21 degrees and the Osborne Nature Center south of Elkader was able to reach -25! Having calm winds certainly helps to increase the cooling of the air near the surface as warmer air aloft is not mixed downward. The featured chart presents the frequency of having a 5+ knot (~6 MPH) wind speed by air temperature during January for Waterloo. The relationship is rather clear as colder temperatures have less frequent winds at the given speed. Note that for values below -20, the dataset population rapidly decreases and thus gets a bit noisy.
Voting: Good - 10 Bad - 0
Generate This Chart on Website
Thu Feb 02, 2023
January Min Wind Chill
02 Feb 2023 05:30 AM
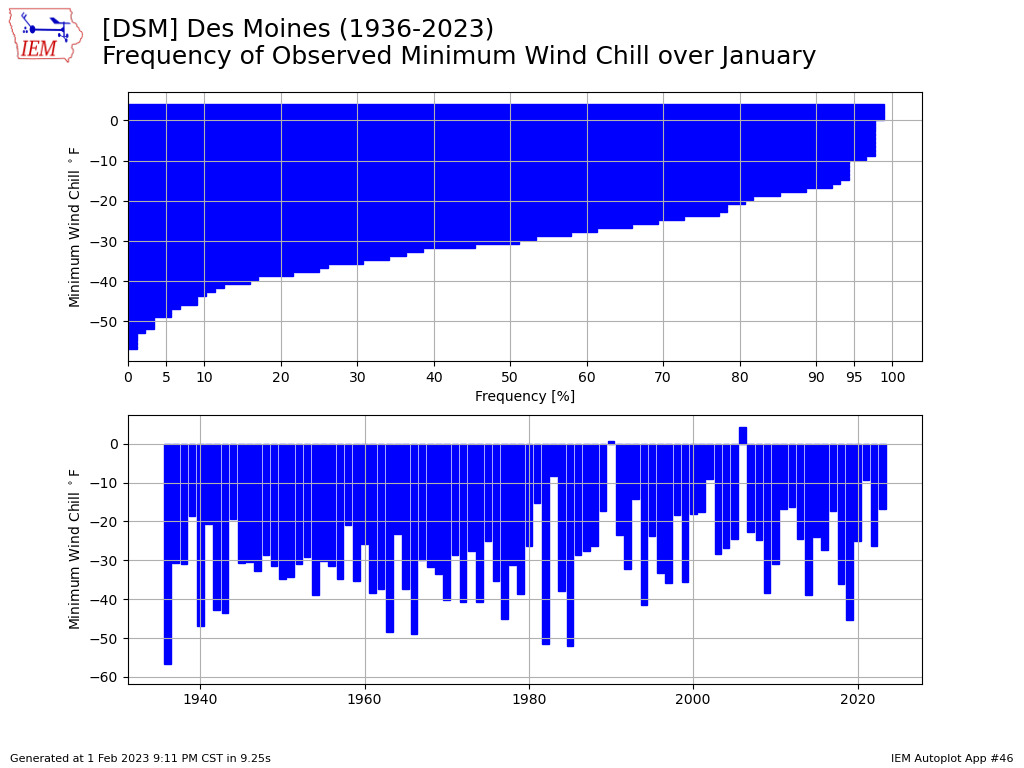
Outside of the cold experienced to end the month, January was not all that bad for temperatures in Iowa. One measure of how bad it was is shown by the featured chart of yearly minimum wind chill temperatures for Des Moines during January. The 2023 value comes in near the 95th percentile. Approximately 19 out of every 20 previous Januaries had a colder value. It is kind of interesting to note two of the years failed to even reach a sub zero Fahrenheit value! Temperatures did warm nicely for the first day of February for most of the state, but a reinforcing shot of colder air arrives on Thursday.
Voting: Good - 9 Bad - 0
Tags: jan windchill
Generate This Chart on Website
02 Feb 2023 05:30 AM
Outside of the cold experienced to end the month, January was not all that bad for temperatures in Iowa. One measure of how bad it was is shown by the featured chart of yearly minimum wind chill temperatures for Des Moines during January. The 2023 value comes in near the 95th percentile. Approximately 19 out of every 20 previous Januaries had a colder value. It is kind of interesting to note two of the years failed to even reach a sub zero Fahrenheit value! Temperatures did warm nicely for the first day of February for most of the state, but a reinforcing shot of colder air arrives on Thursday.
Voting: Good - 9 Bad - 0
Tags: jan windchill
Generate This Chart on Website
Fri Feb 03, 2023

Wind Chill Advisory Timing
03 Feb 2023 05:30 AM
A Wind Chill Advisory is in effect for a good chunk of northern Iowa until 9 AM this Friday morning. The wind is also blowing snow around making for dangerous and variable driving conditions. The featured chart presents the time of day frequency of when Wind Chill Advisories are in effect as issued by NWS Des Moines. The overnight and especially early morning pre-dawn hours are certainly the favored time of day as that is typically when air temperatures are the coldest and it does not take much wind to drop wind chills into advisory thresholds when air temperatures are already below zero Fahrenheit. One quirk of the plot you may wonder about is the rapid changes in frequency every three hours. The reason is that NWS products are geared toward these hours of the day, so they are preferred starting and stopping hours for long fuse products like this advisory type.
Voting: Good - 12 Bad - 1
Generate This Chart on Website
Mon Feb 06, 2023

Mount Washington Wind Chill
06 Feb 2023 05:30 AM
A remarkably brief and extreme blast of cold air impacted the northeastern US on Saturday morning with air temperatures at a number of locations hitting values unseen for a number of decades. What grabbed the headlines though was the extreme conditions observed at the Mount Washington Observatory in New Hampshire. As the name implies, this weather station sits high atop a mountain. Early Saturday morning it reported a wind speed of 89 MPH and an air temperature of -47F, which computes to a -108F wind chill! The featured chart presents the top 10 wind chill reports from this site as computed by the IEM and you can see how Saturday's event dominates the top 10.
Voting: Good - 14 Bad - 0
Generate This Chart on Website
Tue Feb 07, 2023

February Contrast
07 Feb 2023 05:31 AM
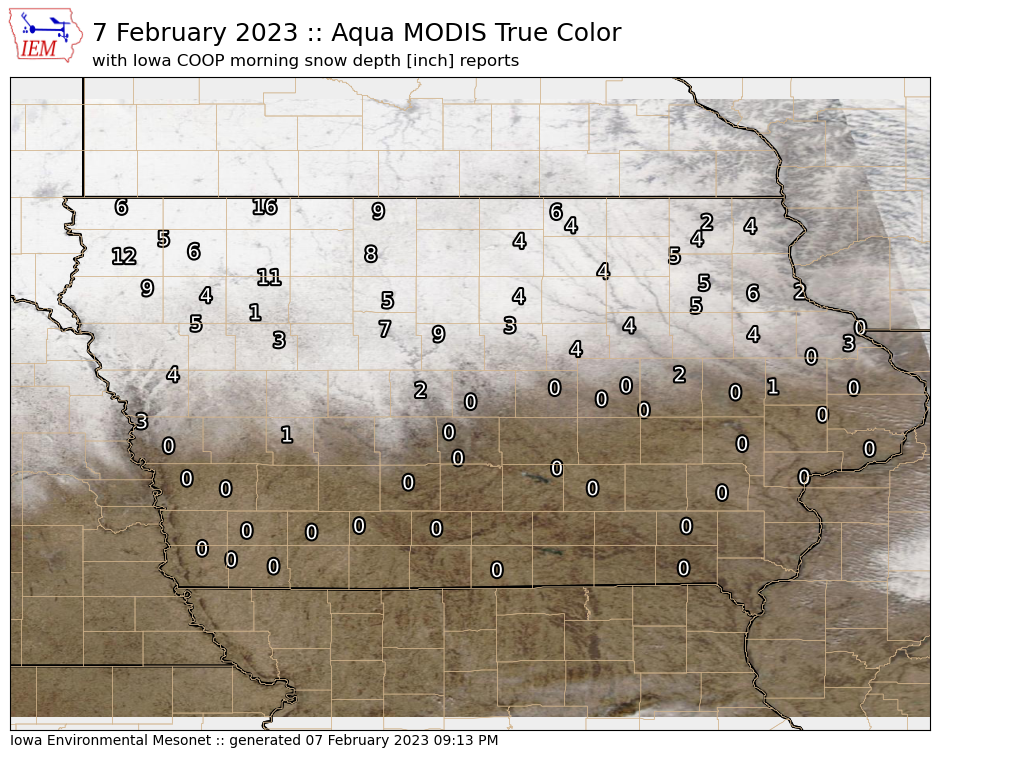
For those who live in Iowa, your location made a huge difference for how nice the weather felt Monday. The featured map presents an analysis of high temperature based on airport weather stations. Quite the contrast is shown with values ranging from the mid 30s to the mid 60s! The difference was aided by the gradient in snow cover over the state and one can easily guess where the deepest snow pack still lies. More mild weather is expected for this week, so hopefully warmer temperatures can continue to work northward as the snow retreats.
Voting: Good - 12 Bad - 1
Generate This Chart on Website
07 Feb 2023 05:31 AM
For those who live in Iowa, your location made a huge difference for how nice the weather felt Monday. The featured map presents an analysis of high temperature based on airport weather stations. Quite the contrast is shown with values ranging from the mid 30s to the mid 60s! The difference was aided by the gradient in snow cover over the state and one can easily guess where the deepest snow pack still lies. More mild weather is expected for this week, so hopefully warmer temperatures can continue to work northward as the snow retreats.
Voting: Good - 12 Bad - 1
Generate This Chart on Website
Wed Feb 08, 2023
View of snow cover
08 Feb 2023 05:30 AM
Whenever there are clear skies overhead, it is always a good time to check out what the various satellites show! The featured map presents the combination of Aqua MODIS True Color and morning NWS COOP snow depth reports for yesterday. It should not take much explaining to explain what is going on within the map! Considerable snow cover remains over portions of northern Iowa and more snow is forecast for Wednesday evening into Thursday with the heaviest totals over northeastern Iowa. While the warm temperatures on Monday for some in the state was a welcome taste of spring, we still have plenty of winter to go yet!
Voting: Good - 14 Bad - 1
Tags: modis
Thu Feb 09, 2023

Dicey Morning Commute
09 Feb 2023 05:47 AM
It has been a while since we featured a map from the IEM Freeze application! The map presents the combination of current RADAR, RWIS pavement temperatures (colored dots) and available air temperature reports (numbers). There's a lot going on this morning over Iowa, but temperatures remain marginally above freezing over much of where precipitation is falling. The caveat is that the more intense precipitation areas are likely able to overcome this with slick and heavy slush accumulating on the roadways making for slick travel. Wet bulb temperatures further north are below freezing, which will likely allow more accumulating of snow to happen there today.
Voting: Good - 15 Bad - 1
Generate This Chart on Website
Fri Feb 10, 2023
'22-'23 Winter Storm #17
10 Feb 2023 07:56 AM
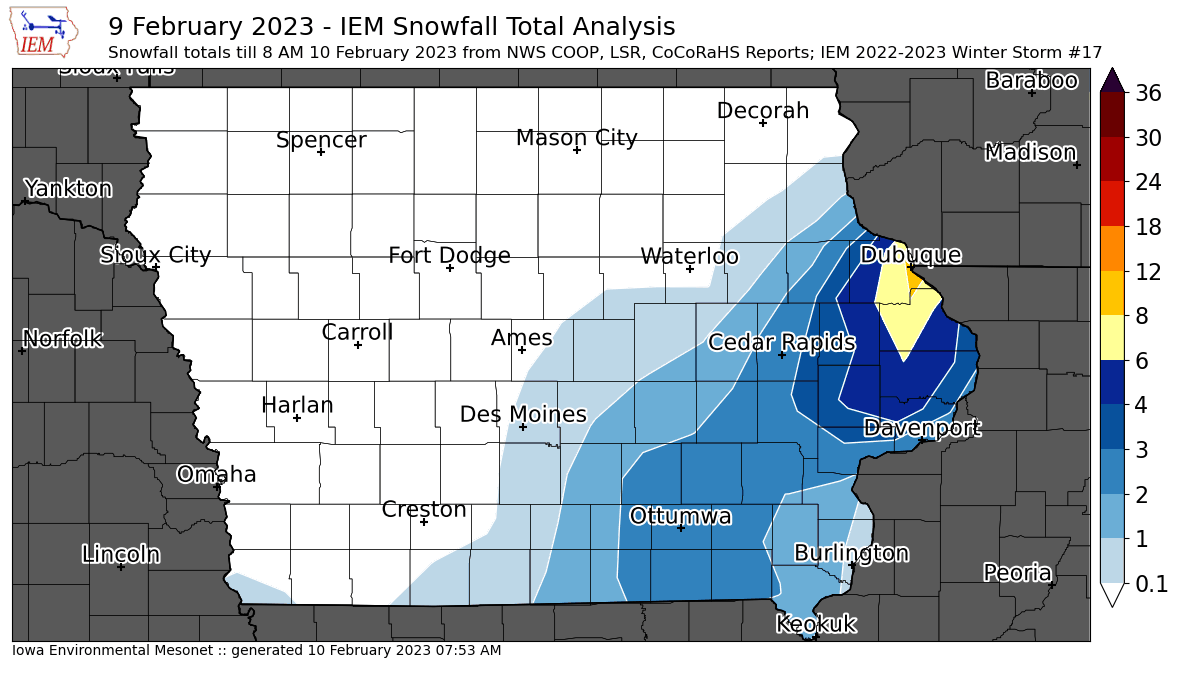
The featured map presents a smoothed analysis of available NWS and CoCoRaHS snowfall reports for the event on Thursday over Iowa. Events like this one are tough to observe as snowfall totals were highly variable and melting was occurring as the snow was also falling. The clear "winner" for this event was the Dubuque area which had a number of nine inch reports and that snow fell quickly Thursday morning. The good news is that the forecast continues to look mild, so continued melting for this snow and the remaining snow pack over northern Iowa will occur.
Voting: Good - 12 Bad - 1
Tags: winter2223
10 Feb 2023 07:56 AM
The featured map presents a smoothed analysis of available NWS and CoCoRaHS snowfall reports for the event on Thursday over Iowa. Events like this one are tough to observe as snowfall totals were highly variable and melting was occurring as the snow was also falling. The clear "winner" for this event was the Dubuque area which had a number of nine inch reports and that snow fell quickly Thursday morning. The good news is that the forecast continues to look mild, so continued melting for this snow and the remaining snow pack over northern Iowa will occur.
Voting: Good - 12 Bad - 1
Tags: winter2223
Mon Feb 13, 2023
Reaching 55+ in February
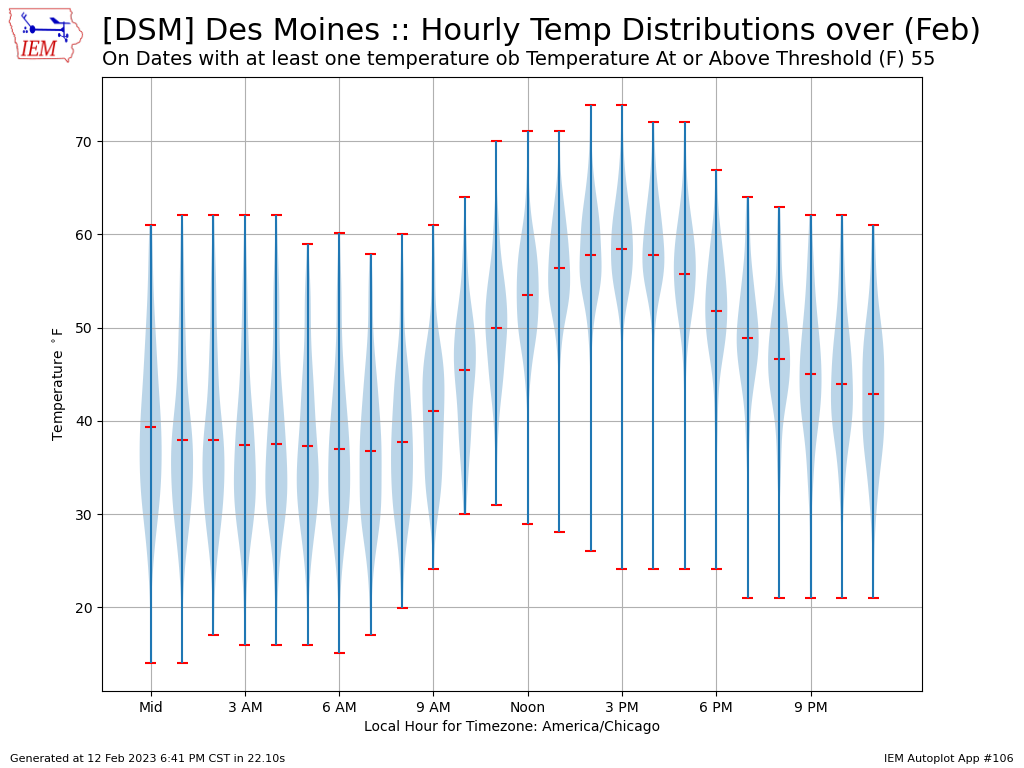
13 Feb 2023 05:30 AM
Temperatures on Monday are forecast to continue the recent trend of having quite the contrast over the state with well above average temperatures over the snow-free south and about average values over the snow-covered north. Des Moines is forecast to reach 55 degrees and the featured chart presents hourly temperature distributions on February days with at least one hourly observation of 55+ degrees. The distributions are presented as violin plots, which provide some visual measure of where the most populous portion of the distribution lies. It is interesting to note the mean values begin above freezing for all hours of the day. This is likely homage to having snow free conditions as it is generally very difficult to be above freezing during overnight hours when snow cover is present.
Voting: Good - 11 Bad - 2
Tue Feb 14, 2023
February Difference
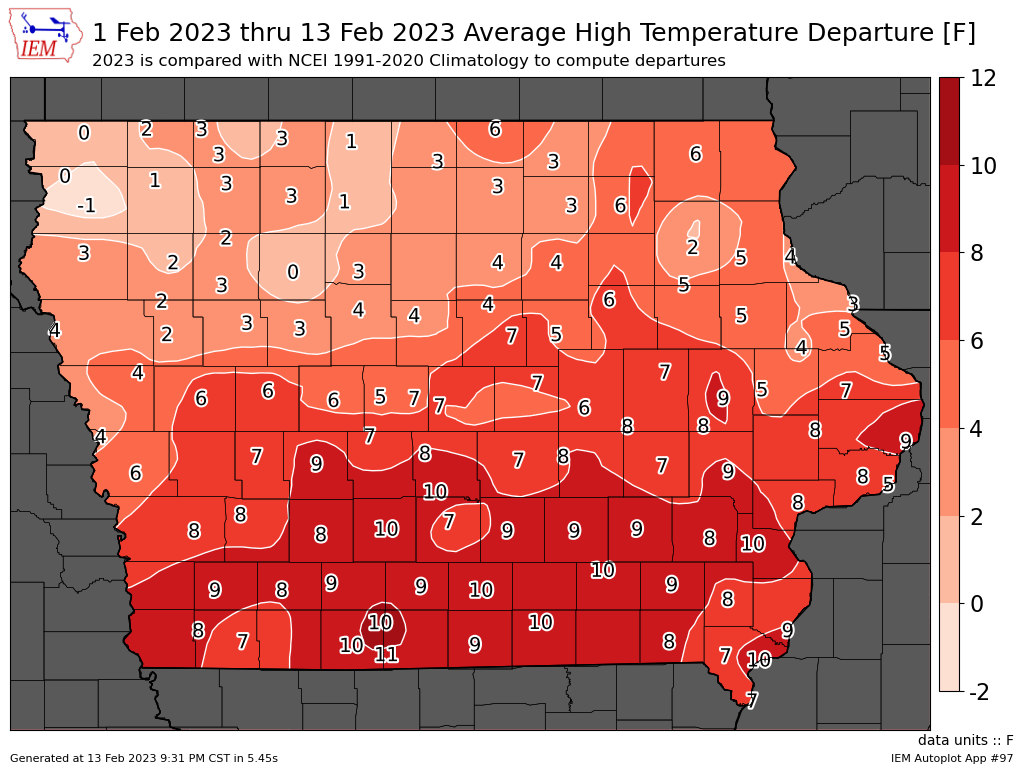
14 Feb 2023 05:30 AM
The amount of snow cover around you again made a difference for how nice Monday felt as southern Iowa enjoyed mid 50s and northern Iowa 40s and lower. The featured map presents an analysis of average high temperature departures from average for February. The north to south gradient is readily apparent, but it is also worth noting that almost the entire state has been above average. The good news is that considerable melting did take place on Monday and the northward progress of the 50+ degree air did occur. The bad news is that after some rain on Tuesday, colder weather and more snow is in the forecast.
Voting: Good - 12 Bad - 0
Generate This Chart on Website
Wed Feb 15, 2023
Nice February Rainfall
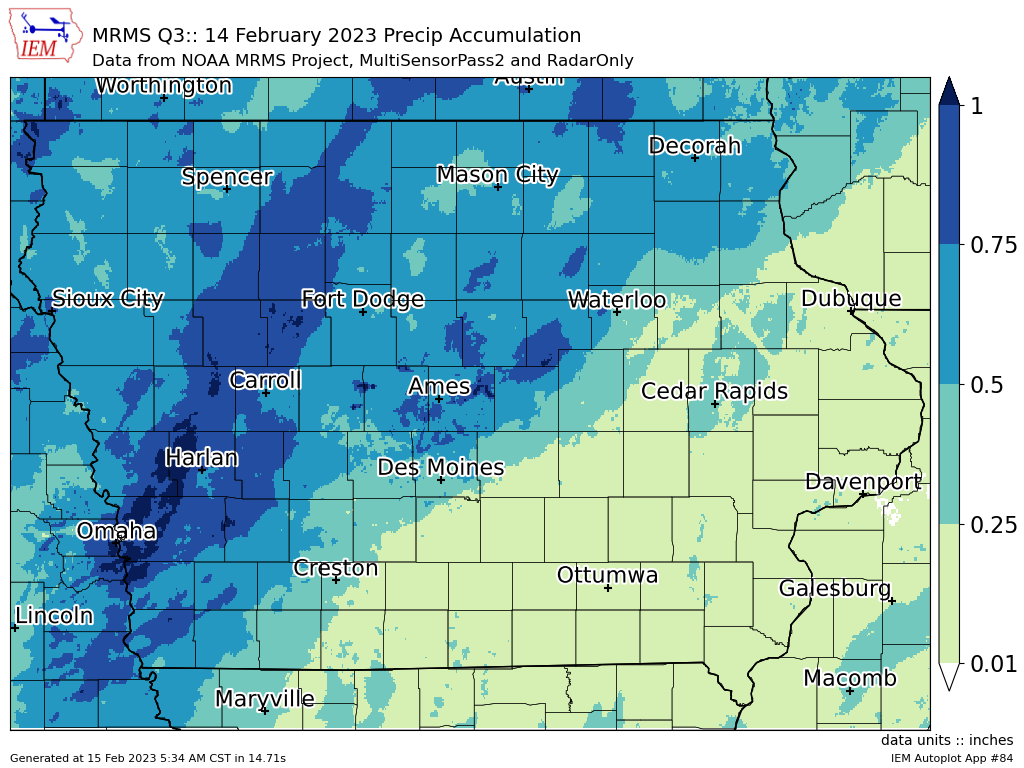
15 Feb 2023 05:38 AM
The first of two big storms this week brought all rain to the state. The featured map presents NOAA MRMS precipitation estimates for Tuesday. Most of the northwestern half of the state is shown in the half to one inch range, with a few isolated spots over an inch. The next system arrives this evening and will be bring snow, with the heaviest totals expected over southeastern Iowa.
Voting: Good - 10 Bad - 20
Generate This Chart on Website
Thu Feb 16, 2023
Tuesday's rain sink in?
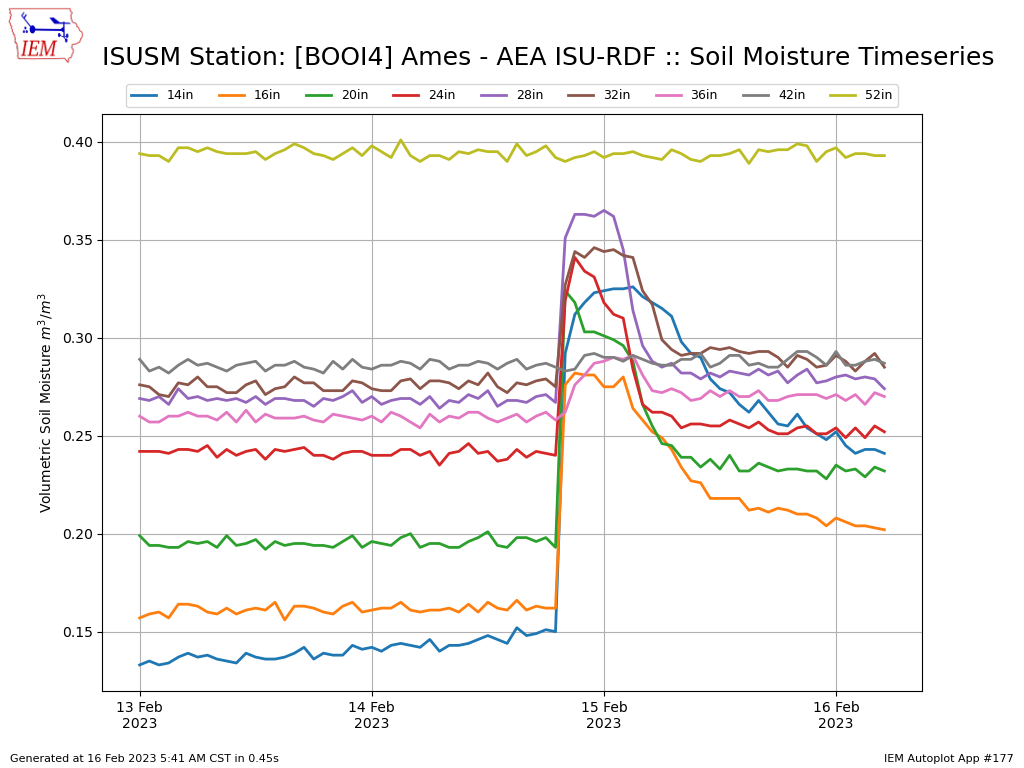
16 Feb 2023 05:52 AM
One of the reasons drought busting during the winter season can be problematic is that soils are often still frozen and received rainfall is more likely to run off than infiltrate the ground. For some parts of the country, the runoff greatly helps as it fills reservoirs. For Iowa, we generally want the water to fill the reservoir that exists in our fertile top soil and thus be used by the next growing season's crop. So with the rainfall event on Tuesday, one wonders how much of it infiltrated as frozen soil still exists over much of the state. The featured chart is from the ISU Soil Moisture station just west of Ames and displays the soil moisture readings from a problem recently buried to a 12 inch depth within the field. It clearly and nicely shows the rain water reaching those levels, but there are caveats if this can be extrapolated to other sites due to this site being recently installed, in a field, in a field without ground cover which should allow for warmer top soils, and perhaps some other quirks allowing rain water to infiltrate. Our other stations nearby are not as convincing that water reached at least twelve inches depth.
Voting: Good - 14 Bad - 3
Generate This Chart on Website
Fri Feb 17, 2023
'22-'23 Winter Storm #18
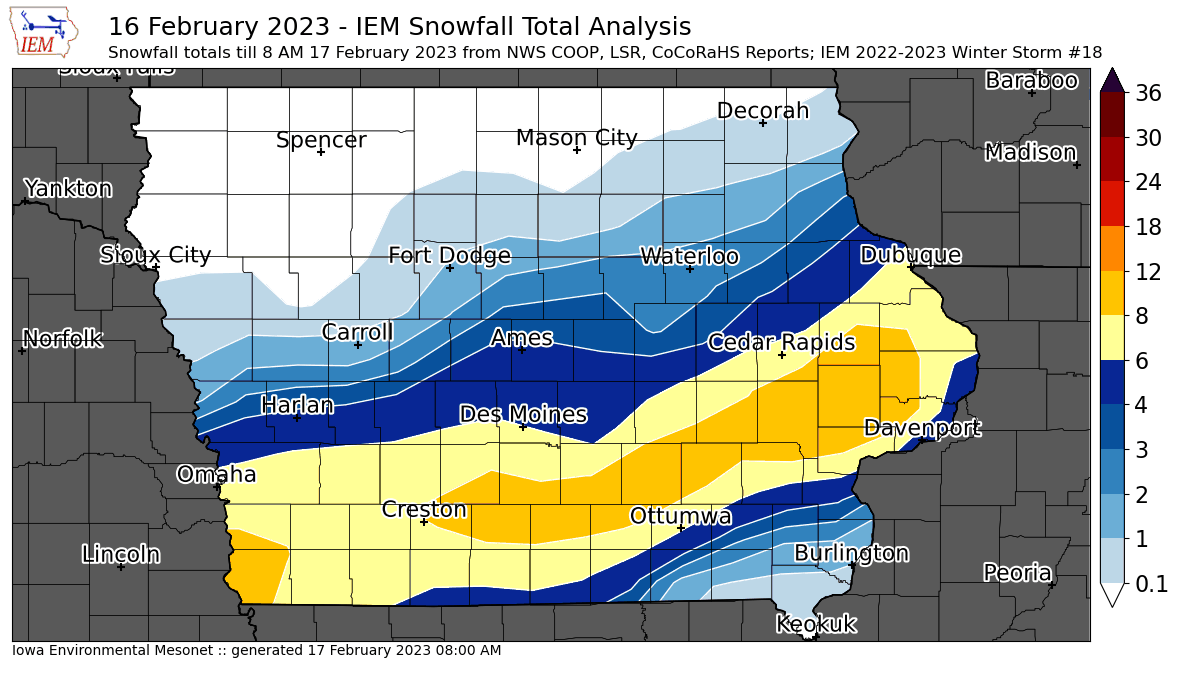
17 Feb 2023 08:05 AM
After the first big storm this week brought mostly rain, the second big storm brought mostly snow and quite a bit of it over portions of southern Iowa. The featured map presents an analysis of available NWS and CoCoRaHS reports. The highest totals around 10 inches were found near Iowa City and points off to the southwest. The snow was really dumping at times during the day and made for horrible driving conditions. Additionally, a rapid drop in temperatures after the snow stopped turned things to ice late Thursday afternoon. After a very chilly start this Friday morning, sunshine today and warmer temperatures this weekend will help melt this snowfall away.
Voting: Good - 23 Bad - 2
Tags: winter2223
Mon Feb 20, 2023
Finishing out February
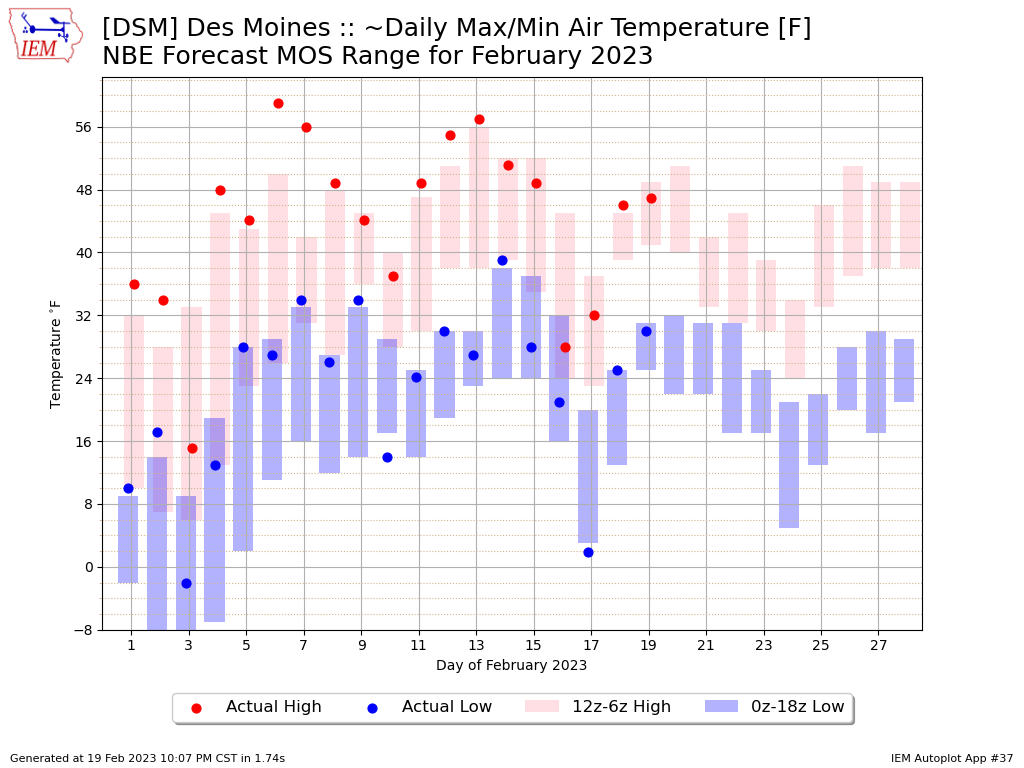
20 Feb 2023 05:30 AM
With only eight days remaining in February, it is a good time to check in on forecast temperatures to finish out the month. The featured chart presents a diagnostic for the National Blend of models Extended (NBE) Model Output Statistics (MOS) forecast daily high and low temperatures along with observed values for Des Moines. The bars represent the range of time-lagged ensemble forecast values for the given date. The dots are the verification based on available observations. The range of forecast MOS values has been consistently under observed values and with not much cold to speak of, this are looking up at the moment for a decent end of the month temperature wise. The current caveat to this is the forecast big winter storm system arriving midweek and if the significant snow stays off to the north of Iowa or not.
Voting: Good - 10 Bad - 2
Generate This Chart on Website
Tue Feb 21, 2023
Recent Snow Mostly Gone
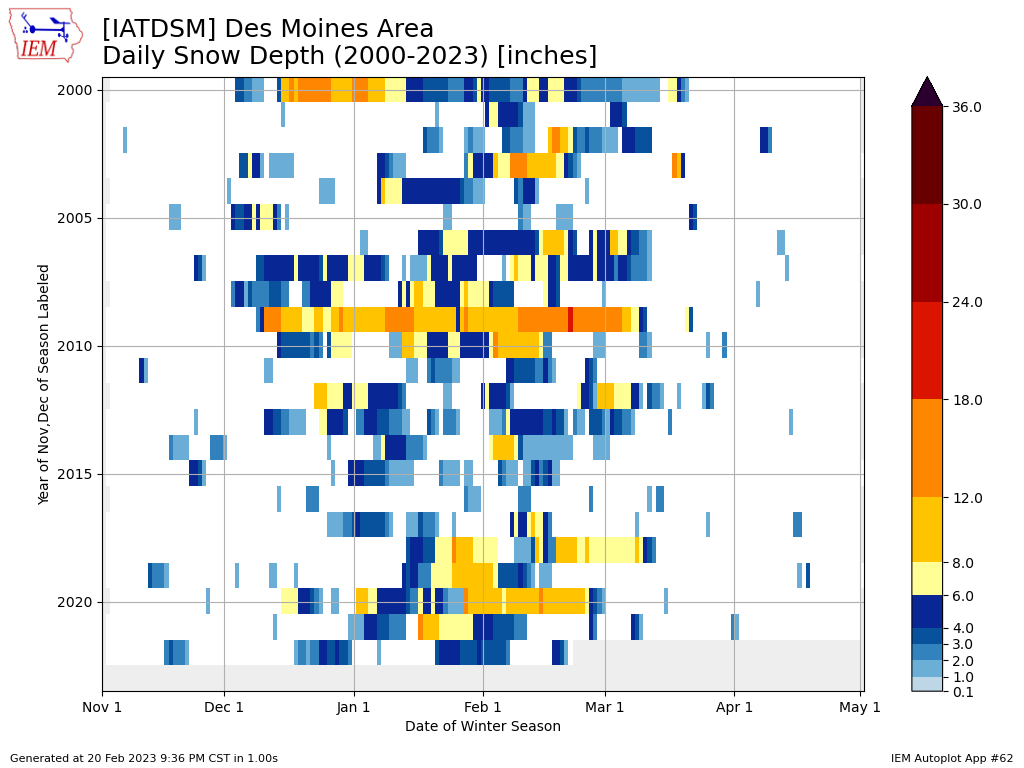
21 Feb 2023 05:30 AM
The big snowfall of last week didn't last very long thanks to increasingly effective sunshine and warm temperatures. The featured chart presents a heatmap of daily snow depth reports for Des Moines for each winter since 2000. The year's are labelled by the year of the associated fall/winter season, so this year's values are found labelled 2022. The most recent white boxes for 2022 show the snow be reported as gone for Des Moines. It is fun to compare the various years as the depth and duration of the snow cover vary wildly by year. The winter's of 2000-2001 and 2009-2010 are remarkable compared with other winters like 2016-2017.
Voting: Good - 10 Bad - 1
Tags: snowcover
Generate This Chart on Website
Wed Feb 22, 2023
Lit Up Map
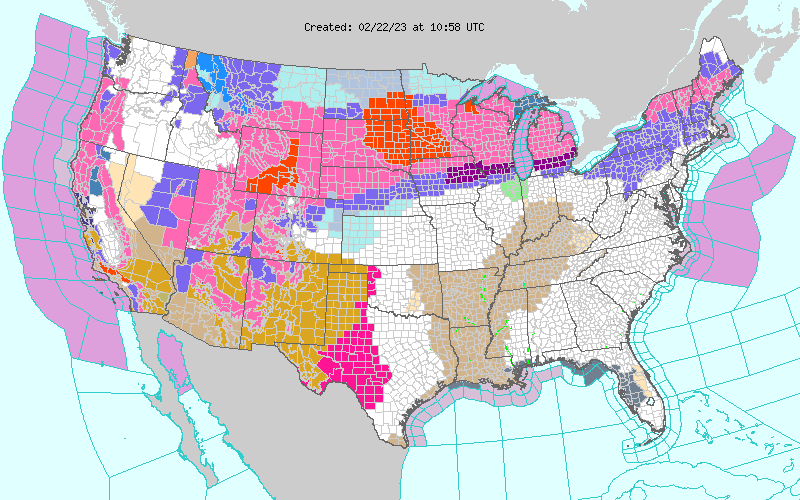
22 Feb 2023 05:40 AM
For all of its faults, the National Weather Service Watch, Warning, and Advisory (WaWA) map provides an interesting look at how active things are over the contiguous US this Wednesday morning. Iowa presently is under a Blizzard Warning, Winter Storm Warning, Winter Weather Advisory, and Ice Storm Warning. To our north, an epic dump of snow is expected over southern Minnesota. To our south, severe convective weather is possible over much of Missouri. The IEM has an archive of the NWS WaWA map since 2013 at the "Generate this Chart on Website" button below the map.
Voting: Good - 17 Bad - 1
Generate This Chart on Website
Thu Feb 23, 2023
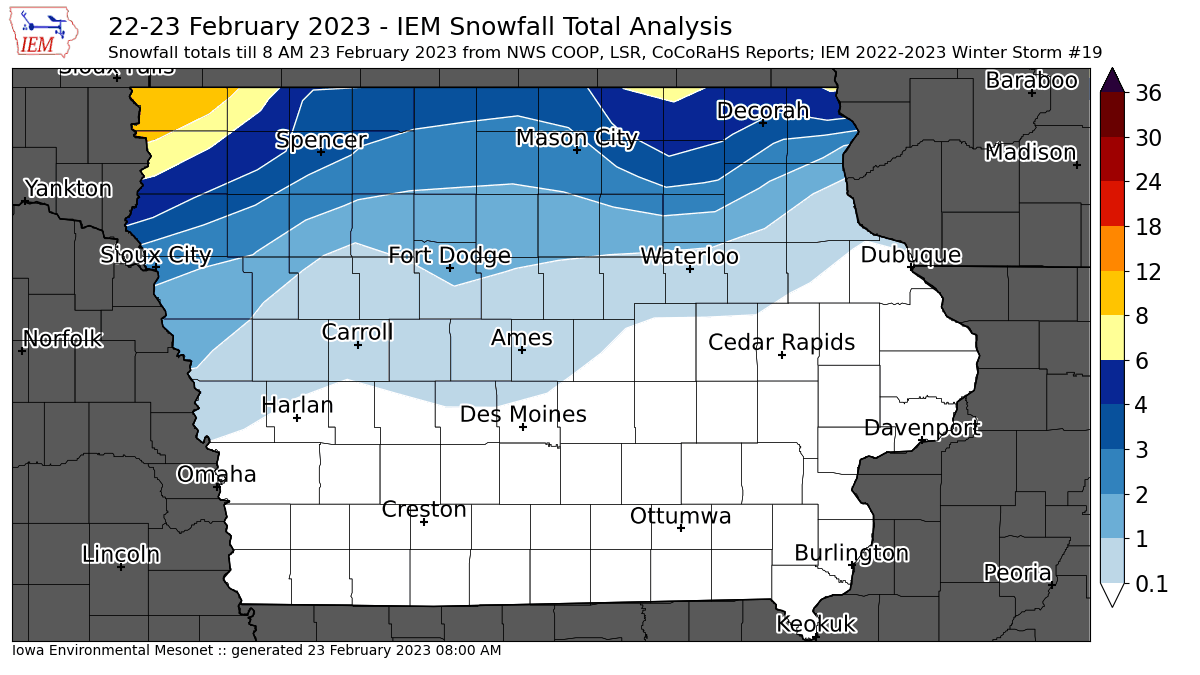
'22-'23 Winter Storm #19
23 Feb 2023 08:04 AM
The last of the big winter storm is about to exit the state this Thursday morning and a large mess is left behind over northern Iowa. The featured map presents an analysis of available snowfall reports with the highest totals to be found over far northwestern Iowa. Much of northern Iowa picked up significant amounts of freezing rain and sleet. Travel remains very difficult as plummeting temperatures today are not helping with the snow and ice removal from roads. Will likely have a featured map tomorrow of available freezing rain and sleet reports.
Voting: Good - 12 Bad - 0
Tags: winter2223
Fri Feb 24, 2023
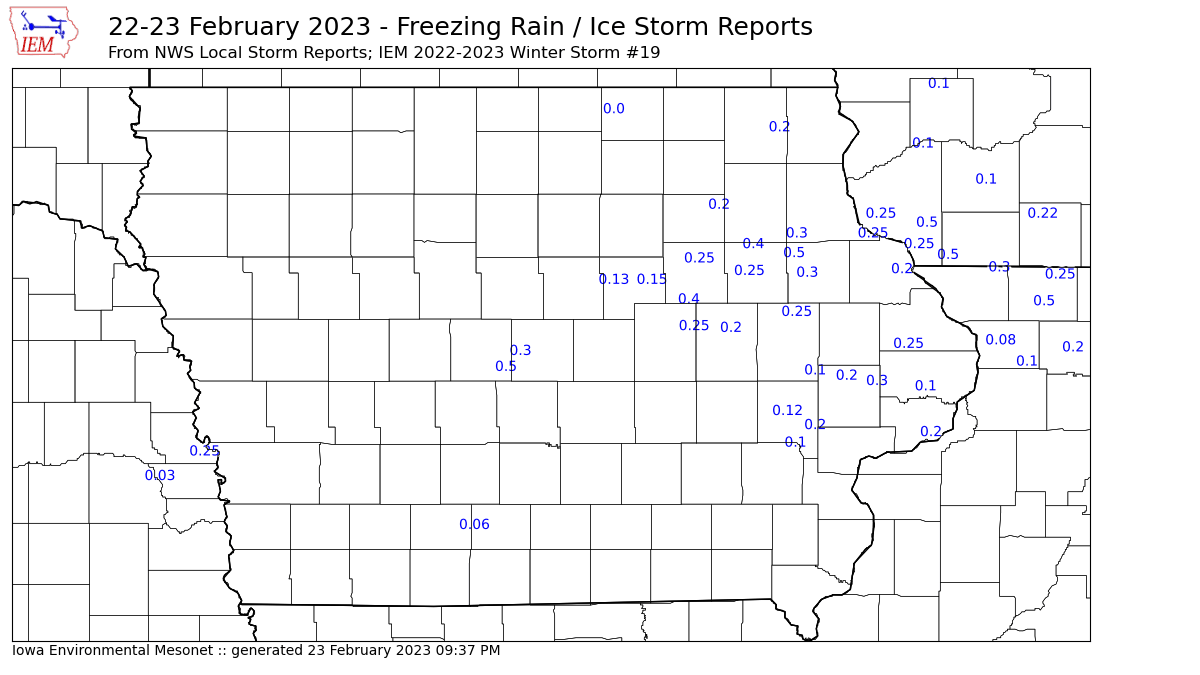
'22-'23 Winter Storm #19 - Icing Reports
24 Feb 2023 05:30 AM
Besides bringing heavy snowfall to far northern Iowa, a good chunk of Iowa roughly between highways 20 and 30 received significant amounts of ice. The featured map presents available NWS Local Storm Reports of ice accumulation. If you think measuring snowfall is difficult, measuring ice accumulation is next level! That issue aside, reports in the tenth to half an inch range can be found from around Ames to Dubuque and then to points east to Michigan. Unfortunately a round of light snow arrives on Friday, which will delay the melting of this ice until Saturday when warmer air works its way back into the state.
Voting: Good - 15 Bad - 0
Tags: winter2223
Mon Feb 27, 2023
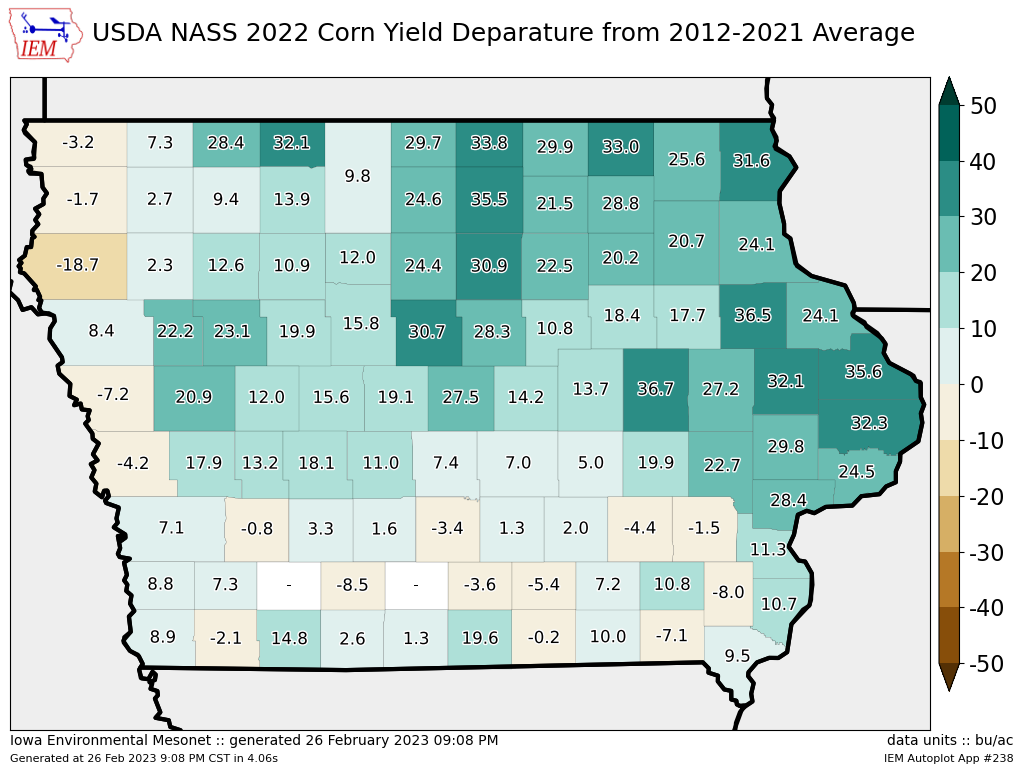
2022 Corn Yield Departures
27 Feb 2023 05:30 AM
The USDA National Agricultural Statistics Service (NASS) released their county level 2022 yield estimates on Friday. The featured map presents an IEM computed corn yield departure of the 2022 value from a simple average over the ten most recent years. A negative value would indicate a yield that was below the past ten year average. The varying impacts of the 2022 drought are generally reflected in this map with most negative numbers found over southern Iowa and far western Iowa. It is rather interesting to see the variability shown over northwestern Iowa. Drought conditions were highly variable in this area as well. It wasn't as if the drought of 2022 featured no rainfall over large chunks of the state over large number of days, instead rainfalls were fickle and some fields got just enough and timely rainfalls to make a good crop, while others nearby were not so lucky. You can generate this map for big drought years like 2012 and you will see a remarkable difference in impact.
Voting: Good - 12 Bad - 1
Generate This Chart on Website
Tue Feb 28, 2023

Wettest Winter?
28 Feb 2023 05:30 AM
We have just one day left in February and can close the book on the winter season comprising December through February! It has been an active winter season and the precipitation totals are rather impressive. The featured map presents unofficial IEM estimated climate district precipitation ranks for this winter season vs each previous one since 1893. A plotted value of 1 would indicate that this winter was the wettest on record! There's a lot of ones to be found on the map and even the northwestern district in Iowa. Other climate districts in Iowa are not far behind. It will be interesting to see how the official data from NCEI that comes out in a few weeks compares to this preliminary data.
Voting: Good - 11 Bad - 1
Generate This Chart on Website