The following tables present IEM computed monthly data summaries based on
daily data provided by or computed for the IEM. A download interface
exists for the daily summary information. The climatology is provided by the
nearest NCEI climate station (USC00261485) within the current 1991-2020
dataset.
To load shown data into Microsoft Excel,
highlight the table information with your mouse and then copy/paste into Excel.
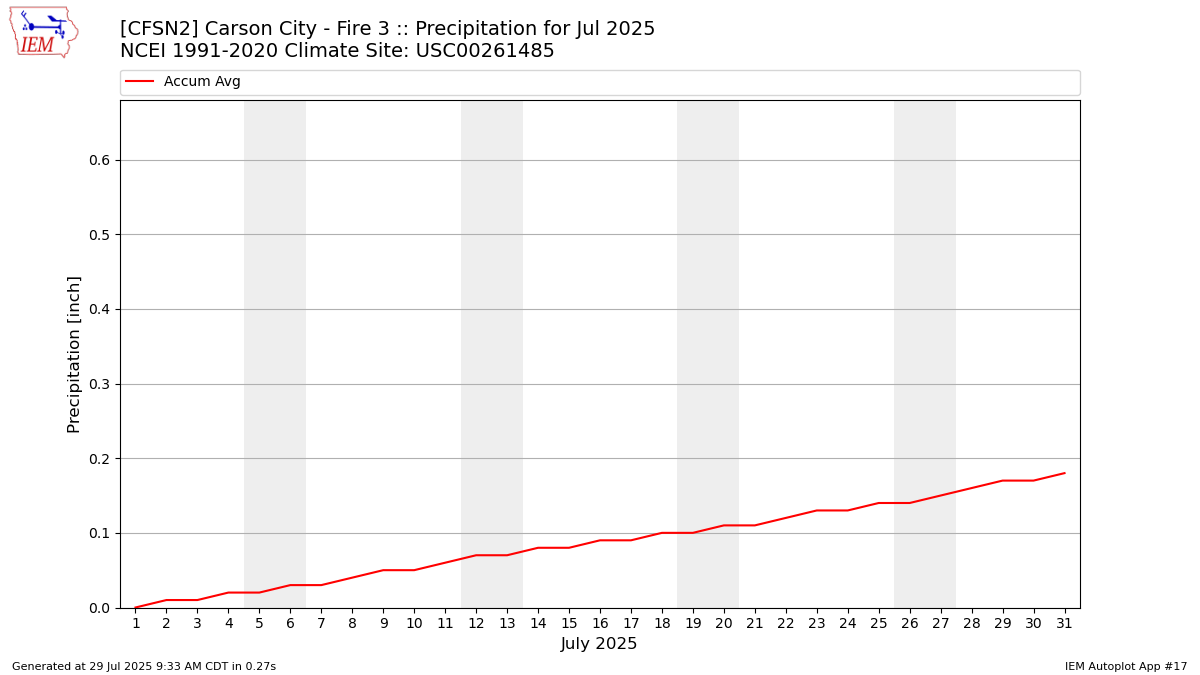
Precipitation Totals [inch]
Year
Jan
Feb
Mar
Apr
May
Jun
Jul
Aug
Sep
Oct
Nov
Dec
2024
M
M
M
M
M
M
M
M
M
M
M
M
2025
M
M
M
M
M
M
M
M
M
M
M
M
NCEI Climatology
1.72
1.53
1.24
0.51
0.51
0.37
0.18
0.14
0.24
0.55
0.90
1.50
Average Wind Speed [MPH]
Year
Jan
Feb
Mar
Apr
May
Jun
Jul
Aug
Sep
Oct
Nov
Dec
2024
M
M
M
M
M
M
M
M
M
M
M
M
2025
M
M
M
M
M
M
M
M
M
M
M
M
NCEI Climatology
M
M
M
M
M
M
M
M
M
M
M
M
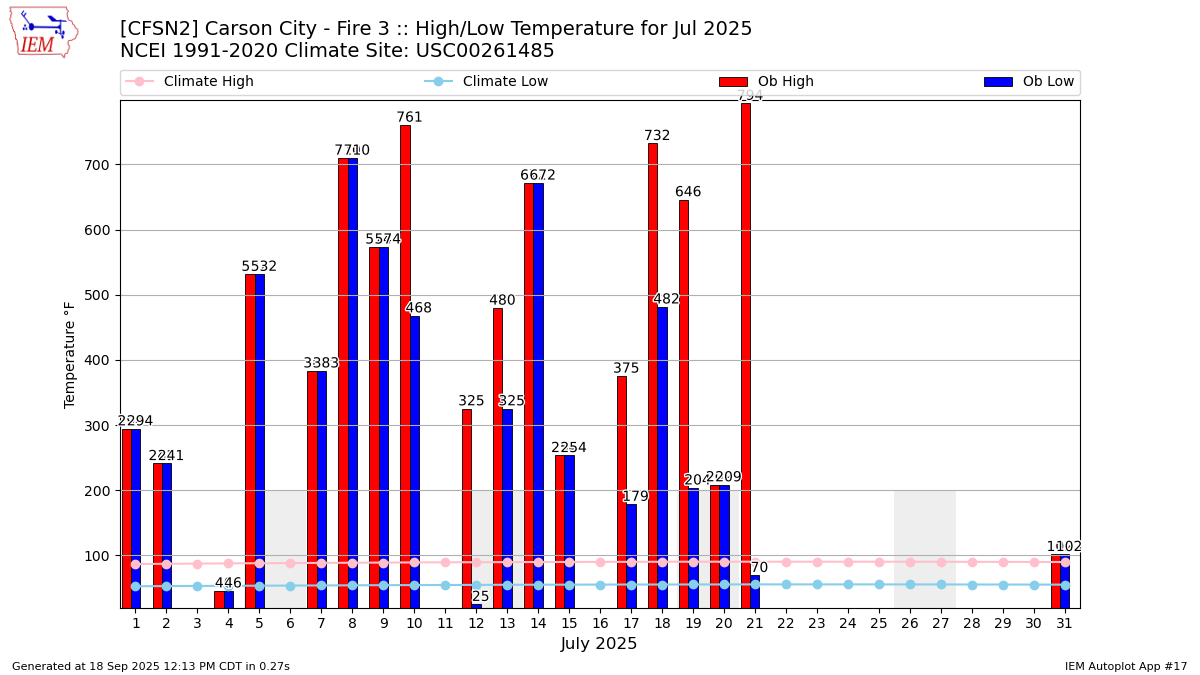
Average Daily High Temperature [F]
Year
Jan
Feb
Mar
Apr
May
Jun
Jul
Aug
Sep
Oct
Nov
Dec
2024
M
M
547.22
495.09
465.18
350.69
494.24
474.50
380.42
421.64
345.85
498.83
2025
355.31
397.85
524.86
461.77
457.42
496.59
472.20
M
M
M
M
M
NCEI Climatology
45.49
49.62
56.19
61.70
70.40
80.91
89.50
87.80
80.70
68.01
54.50
44.60
Average Daily Low Temperature [F]
Year
Jan
Feb
Mar
Apr
May
Jun
Jul
Aug
Sep
Oct
Nov
Dec
2024
M
M
315.91
324.27
363.43
222.81
348.56
341.05
235.14
221.63
232.12
322.95
2025
304.86
252.40
346.87
300.28
282.40
304.30
333.28
M
M
M
M
M
NCEI Climatology
24.10
27.18
31.60
35.80
42.90
49.20
54.81
52.51
45.60
36.31
28.40
23.90
Average Daily Temperature (high+low)/2 [F]
Year
Jan
Feb
Mar
Apr
May
Jun
Jul
Aug
Sep
Oct
Nov
Dec
2024
M
M
431.57
409.68
414.30
286.75
421.40
407.77
307.78
321.64
288.99
410.89
2025
330.09
325.12
435.86
381.03
369.91
400.45
402.74
M
M
M
M
M
NCEI Climatology
34.80
38.40
43.90
48.75
56.65
65.05
72.15
70.15
63.15
52.16
41.45
34.25
Average Relative Humidity [%]
This value is computed via a simple average of available observations weighted
by the duration between observations.