Info-circleInformation ClockLast Ob CameraPhotographs Graph-upMeteogram TableNetwork Table PeopleNeighbors Calendar-monthMonthly Summaries Clock-historyObservation History Diagram-3Wind Roses Diagram-3Custom Wind Roses CalendarData Calendar CloudSatellite Cloud Product DownloadDownload CloudTerminal Aerodome Forecast
| Nov 2025 | Dec 2025 | Jan 2026 | ||||
|---|---|---|---|---|---|---|
| Sunday | Monday | Tuesday | Wednesday | Thursday | Friday | Saturday |
| 30 | 01 High: 22 Low: 0 Precip: 0.04 Snow: 0.8 Snow Depth: 4 Avg Wind: SW @ 3.3 Gust: SW @ 10 (11:09 AM) RH% Min/Max: 74-96 Feel Min/Max: -4 to 21 | 02 High: 24 Low: 14 Precip: Trace Snow: 0.2 Snow Depth: 5 Avg Wind: SW @ 9.5 Gust: SSW @ 24 (7:31 PM) RH% Min/Max: 80-96 Feel Min/Max: 2 to 14 | 03 High: 27 Low: 8 Precip: 0.05 Snow: 0.9 Snow Depth: 6 Avg Wind: W @ 11.7 Gust: NW @ 26 (4:26 PM) RH% Min/Max: 55-92 Feel Min/Max: -5 to 19 | 04 High: 12 Low: -2 Precip: 0.00 Snow: 0 Snow Depth: 6 Avg Wind: WSW @ 8.2 Gust: SSW @ 23 (9:38 PM) RH% Min/Max: 48-75 Feel Min/Max: -18 to 2 | 05 High: 15 Low: 13 Precip: M Gust: SSW @ 30 (1:31 AM) RH% Min/Max: 46-48 Feel Min/Max: -3 to -0 | 06 Precip: M |
| 07 | 08 | 09 | 10 | 11 | 12 | 13 |
| 14 | 15 | 16 | 17 | 18 | 19 | 20 |
| 21 | 22 | 23 | 24 | 25 | 26 | 27 |
| 28 | 29 | 30 | 31 | 01 | 02 | 03 |
The data presented here provided by IEM API webservice: daily.json. A simple CSV option exists as well.
Daily High/Low Plot
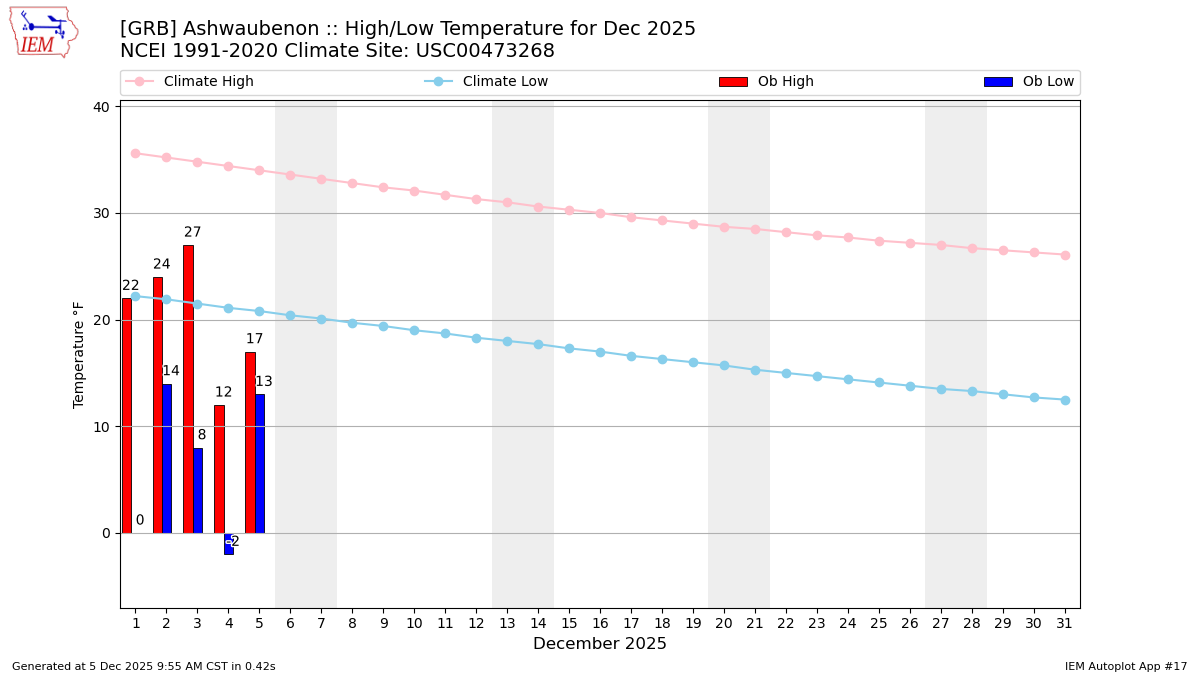
Description: This chart of the monthly temperature data. The bars are the observations and the dots are climatology.
Daily Rainfall
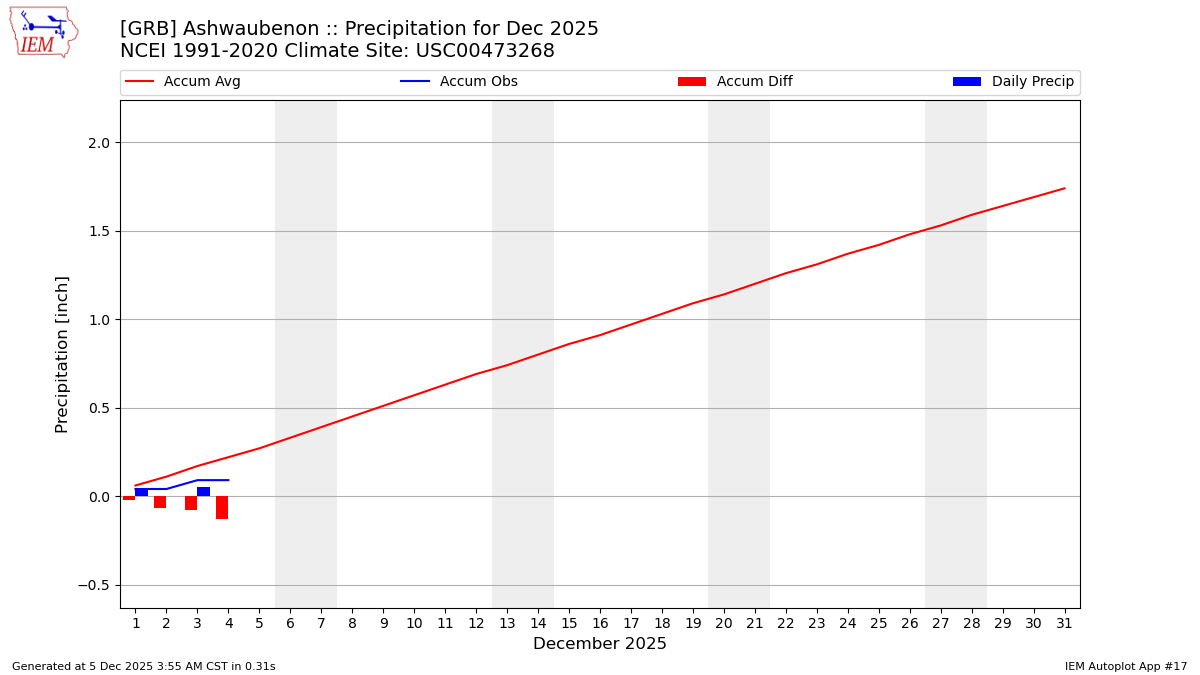
Description: This chart is of daily precipitation for the month. The red line would be an average month while the blue line and bars are observations.
Daily Average Wind Speeds
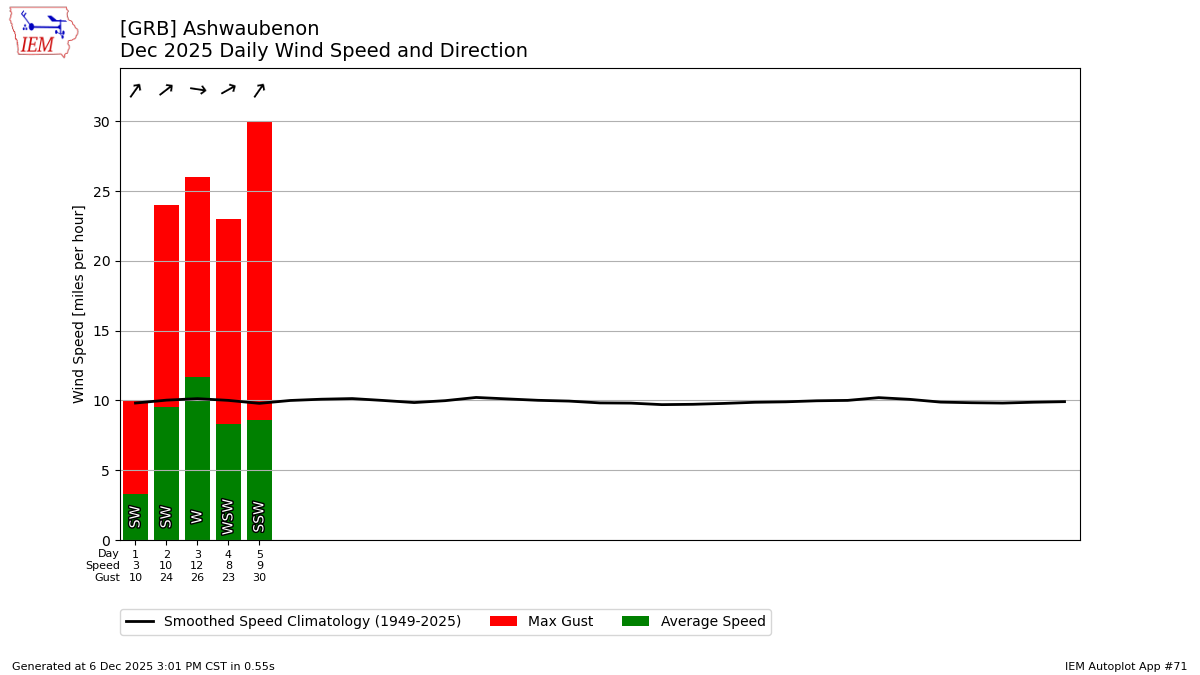
Description: This chart is of the daily average wind speeds.
The data presented here provided by IEM API webservice: daily.json. A simple CSV option exists as well.