| Jun 2025 | Jul 2025 | Aug 2025 | ||||
|---|---|---|---|---|---|---|
| Sunday | Monday | Tuesday | Wednesday | Thursday | Friday | Saturday |
| 29 | 30 | 01 High: 96.000786 Low: 51.499405 Precip: M Avg Wind: SSW @ 4.8 Gust: 33 (3:00 PM) RH% Min/Max: 12-76 Feel Min/Max: 51 to 91 | 02 High: 90.1994 Low: 57.459213 Precip: M Avg Wind: ENE @ 4.7 Gust: 27 (5:40 PM) RH% Min/Max: 16-75 Feel Min/Max: 57 to 86 | 03 High: 86.10079 Low: 58.150417 Precip: M Avg Wind: SSE @ 2.9 Gust: 14 (9:30 PM) RH% Min/Max: 25-83 Feel Min/Max: 58 to 83 | 04 High: 85.60042 Low: 53.72062 Precip: M Avg Wind: NW @ 5.0 Gust: 42 (6:00 PM) RH% Min/Max: 23-88 Feel Min/Max: 54 to 83 | 05 High: 85.60042 Low: 49.09999 Precip: M Avg Wind: NNW @ 4.6 Gust: 23 (3:00 PM) RH% Min/Max: 18-95 Feel Min/Max: 49 to 83 |
| 06 High: 87.20058 Low: 47.04082 Precip: M Avg Wind: NNW @ 4.4 Gust: 21 (4:40 PM) RH% Min/Max: 13-83 Feel Min/Max: 47 to 84 | 07 High: 91.799614 Low: 45.33981 Precip: M Avg Wind: NNW @ 3.5 Gust: 21 (3:30 PM) RH% Min/Max: 10-79 Feel Min/Max: 45 to 87 | 08 High: 94.299774 Low: 46.459427 Precip: M Avg Wind: NW @ 3.1 Gust: 19 (2:10 PM) RH% Min/Max: 7-73 Feel Min/Max: 46 to 88 | 09 High: 95.199776 Low: 47.64919 Precip: M Avg Wind: WNW @ 4.0 Gust: 32 (8:40 PM) RH% Min/Max: 10-72 Feel Min/Max: 47 to 91 | 10 High: 86.10079 Low: 59.61918 Precip: M Avg Wind: NNW @ 7.3 Gust: 28 (2:30 PM) RH% Min/Max: 14-51 Feel Min/Max: 60 to 83 | 11 High: 85.8002 Low: 45.590023 Precip: M Avg Wind: NW @ 4.4 Gust: 24 (1:30 PM) RH% Min/Max: 15-75 Feel Min/Max: 46 to 82 | 12 High: 89.20042 Low: 47.71939 Precip: M Avg Wind: NNW @ 4.0 Gust: 23 (3:20 PM) RH% Min/Max: 10-77 Feel Min/Max: 48 to 85 |
| 13 High: 91.70058 Low: 45.550415 Precip: M Avg Wind: NNW @ 4.5 Gust: 24 (2:00 PM) RH% Min/Max: 10-72 Feel Min/Max: 46 to 87 | 14 High: 61.019608 Low: 46.41982 Precip: M Gust: 10 (1:20 AM) RH% Min/Max: 38-73 Feel Min/Max: 46 to 61 | 15 Precip: M | 16 | 17 | 18 | 19 |
| 20 | 21 | 22 | 23 | 24 | 25 | 26 |
| 27 | 28 | 29 | 30 | 31 | 01 | 02 |
The data presented here provided by IEM API webservice: daily.json. A simple CSV option exists as well.
Daily High/Low Plot

Description: This chart of the monthly temperature data. The bars are the observations and the dots are climatology.
Daily Rainfall

Description: This chart is of daily precipitation for the month. The red line would be an average month while the blue line and bars are observations.
Daily Average Wind Speeds
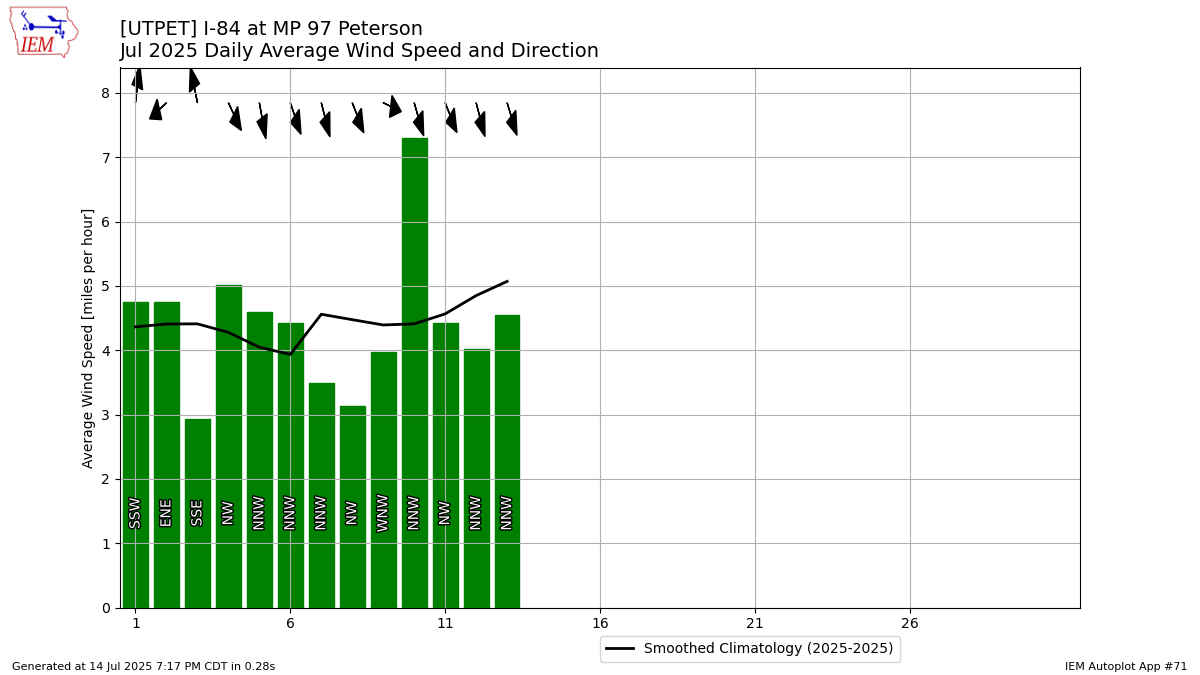
Description: This chart is of the daily average wind speeds.
The data presented here provided by IEM API webservice: daily.json. A simple CSV option exists as well.