| Nov 2025 | Dec 2025 | Jan 2026 | ||||
|---|---|---|---|---|---|---|
| Sunday | Monday | Tuesday | Wednesday | Thursday | Friday | Saturday |
| 30 | 01 High: 32.739807 Low: 12.759797 Precip: M Avg Wind: SSE @ 3.1 Gust: 14 (1:30 PM) RH% Min/Max: 60-97 Feel Min/Max: 12 to 33 | 02 High: 35.229202 Low: 18.109425 Precip: M Avg Wind: SE @ 5.0 Gust: 15 (8:50 AM) RH% Min/Max: 61-98 Feel Min/Max: 9 to 35 | 03 High: 32.2808 Low: 19.940022 Precip: M Avg Wind: NNW @ 5.5 Gust: 21 (3:50 PM) RH% Min/Max: 69-99 Feel Min/Max: 15 to 27 | 04 High: 33.119606 Low: 19.790607 Precip: M Avg Wind: SSE @ 5.1 Gust: 16 (1:40 PM) RH% Min/Max: 59-97 Feel Min/Max: 13 to 31 | 05 High: 35.27062 Low: 21.340395 Precip: M Avg Wind: SE @ 7.2 Gust: 16 (3:00 PM) RH% Min/Max: 67-95 Feel Min/Max: 14 to 30 | 06 High: 40.159424 Low: 26.419977 Precip: M Avg Wind: ESE @ 6.7 Gust: 23 (1:00 PM) RH% Min/Max: 60-98 Feel Min/Max: 21 to 36 |
| 07 High: 42.209583 Low: 20.350416 Precip: M Avg Wind: SSE @ 3.9 Gust: 17 (1:50 PM) RH% Min/Max: 46-93 Feel Min/Max: 17 to 39 | 08 High: 47.530373 Low: 25.100574 Precip: M Avg Wind: S @ 4.9 Gust: 16 (1:50 PM) RH% Min/Max: 42-88 Feel Min/Max: 18 to 45 | 09 High: 49.580585 Low: 24.720778 Precip: M Avg Wind: SSE @ 7.5 Gust: 17 (2:50 PM) RH% Min/Max: 36-87 Feel Min/Max: 15 to 46 | 10 High: 51.310383 Low: 28.219978 Precip: M Avg Wind: SSE @ 5.4 Gust: 14 (2:30 PM) RH% Min/Max: 44-84 Feel Min/Max: 21 to 51 | 11 High: 56.730213 Low: 29.03 Precip: M Avg Wind: SSE @ 4.4 Gust: 14 (3:00 PM) RH% Min/Max: 30-91 Feel Min/Max: 23 to 57 | 12 High: 31.819979 Low: 28.619606 Precip: M Gust: 5 (2:30 AM) RH% Min/Max: 69-75 Feel Min/Max: 24 to 32 | 13 Precip: M |
| 14 | 15 | 16 | 17 | 18 | 19 | 20 |
| 21 | 22 | 23 | 24 | 25 | 26 | 27 |
| 28 | 29 | 30 | 31 | 01 | 02 | 03 |
The data presented here provided by IEM API webservice: daily.json. A simple CSV option exists as well.
Daily High/Low Plot

Description: This chart of the monthly temperature data. The bars are the observations and the dots are climatology.
Daily Rainfall

Description: This chart is of daily precipitation for the month. The red line would be an average month while the blue line and bars are observations.
Daily Average Wind Speeds
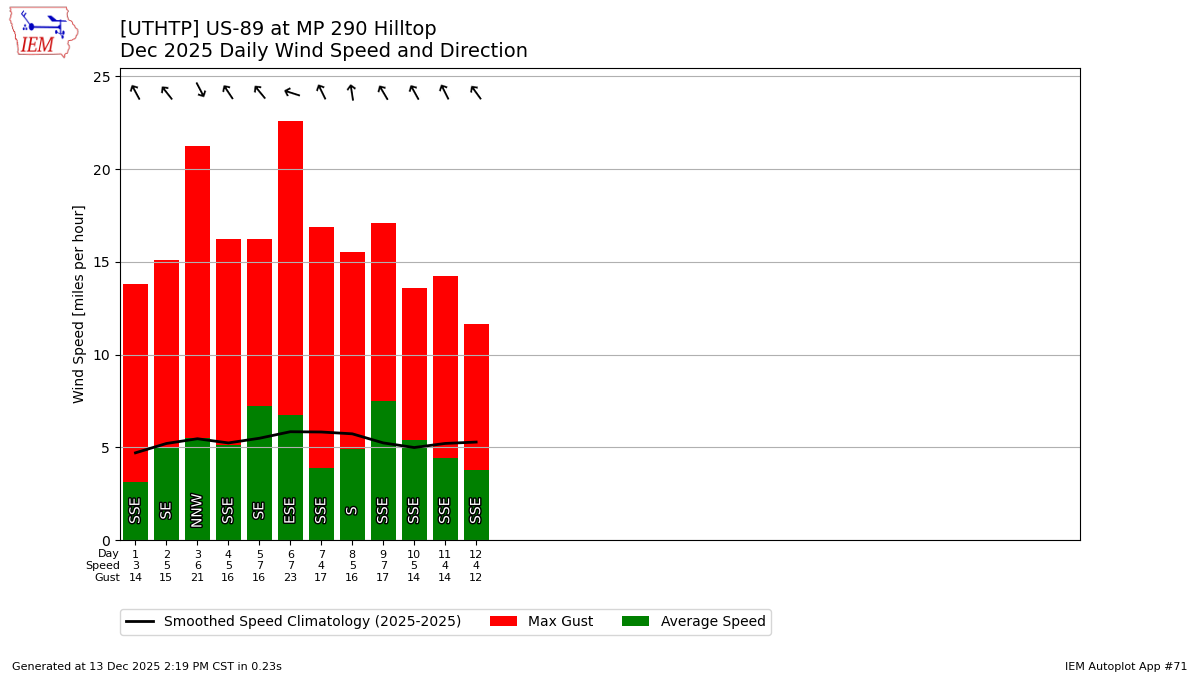
Description: This chart is of the daily average wind speeds.
The data presented here provided by IEM API webservice: daily.json. A simple CSV option exists as well.