| Jun 2025 | Jul 2025 | Aug 2025 | ||||
|---|---|---|---|---|---|---|
| Sunday | Monday | Tuesday | Wednesday | Thursday | Friday | Saturday |
| 29 | 30 | 01 High: 73.81039 Low: 53.04018 Precip: M Avg Wind: ENE @ 9.6 Gust: 34 (1:30 PM) RH% Min/Max: 24-43 Feel Min/Max: 53 to 74 | 02 High: 66.39983 Low: 49.339382 Precip: M Avg Wind: WNW @ 14.0 Gust: 33 (4:00 PM) RH% Min/Max: 35-92 Feel Min/Max: 42 to 66 | 03 High: 60.999775 Low: 49.35921 Precip: M Avg Wind: WSW @ 7.3 Gust: 28 (12:00 AM) RH% Min/Max: 46-92 Feel Min/Max: 43 to 61 | 04 High: 72.1292 Low: 45.049988 Precip: M Avg Wind: WSW @ 16.4 Gust: 36 (7:40 PM) RH% Min/Max: 20-84 Feel Min/Max: 38 to 72 | 05 High: 74.28922 Low: 48.129787 Precip: M Avg Wind: WSW @ 15.9 Gust: 36 (12:40 AM) RH% Min/Max: 10-52 Feel Min/Max: 42 to 74 |
| 06 High: 76.6994 Low: 46.320778 Precip: M Avg Wind: WSW @ 11.8 Gust: 35 (4:10 PM) RH% Min/Max: 6-31 Feel Min/Max: 41 to 77 | 07 High: 77.46081 Low: 50.739807 Precip: M Avg Wind: W @ 10.0 Gust: 48 (5:10 PM) RH% Min/Max: 11-25 Feel Min/Max: 51 to 77 | 08 High: 79.32019 Low: 53.749405 Precip: M Avg Wind: WSW @ 16.6 Gust: 40 (2:20 PM) RH% Min/Max: 7-30 Feel Min/Max: 54 to 79 | 09 High: 77.0792 Low: 53.52078 Precip: M Avg Wind: WSW @ 15.3 Gust: 38 (3:00 PM) RH% Min/Max: 19-45 Feel Min/Max: 54 to 77 | 10 High: 74.03 Low: 53.470406 Precip: M Avg Wind: W @ 22.2 Gust: 45 (3:40 PM) RH% Min/Max: 8-35 Feel Min/Max: 53 to 74 | 11 High: 74.24061 Low: 55.999405 Precip: M Avg Wind: W @ 14.8 Gust: 39 (2:20 PM) RH% Min/Max: 15-30 Feel Min/Max: 56 to 74 | 12 High: 76.47078 Low: 52.230213 Precip: M Avg Wind: W @ 15.9 Gust: 45 (2:20 PM) RH% Min/Max: 15-42 Feel Min/Max: 52 to 76 |
| 13 High: 62.799774 Low: 61.0808 Precip: M Gust: 18 (12:30 AM) RH% Min/Max: 26-27 Feel Min/Max: 61 to 63 | 14 Precip: M | 15 | 16 | 17 | 18 | 19 |
| 20 | 21 | 22 | 23 | 24 | 25 | 26 |
| 27 | 28 | 29 | 30 | 31 | 01 | 02 |
The data presented here provided by IEM API webservice: daily.json. A simple CSV option exists as well.
Daily High/Low Plot

Description: This chart of the monthly temperature data. The bars are the observations and the dots are climatology.
Daily Rainfall

Description: This chart is of daily precipitation for the month. The red line would be an average month while the blue line and bars are observations.
Daily Average Wind Speeds
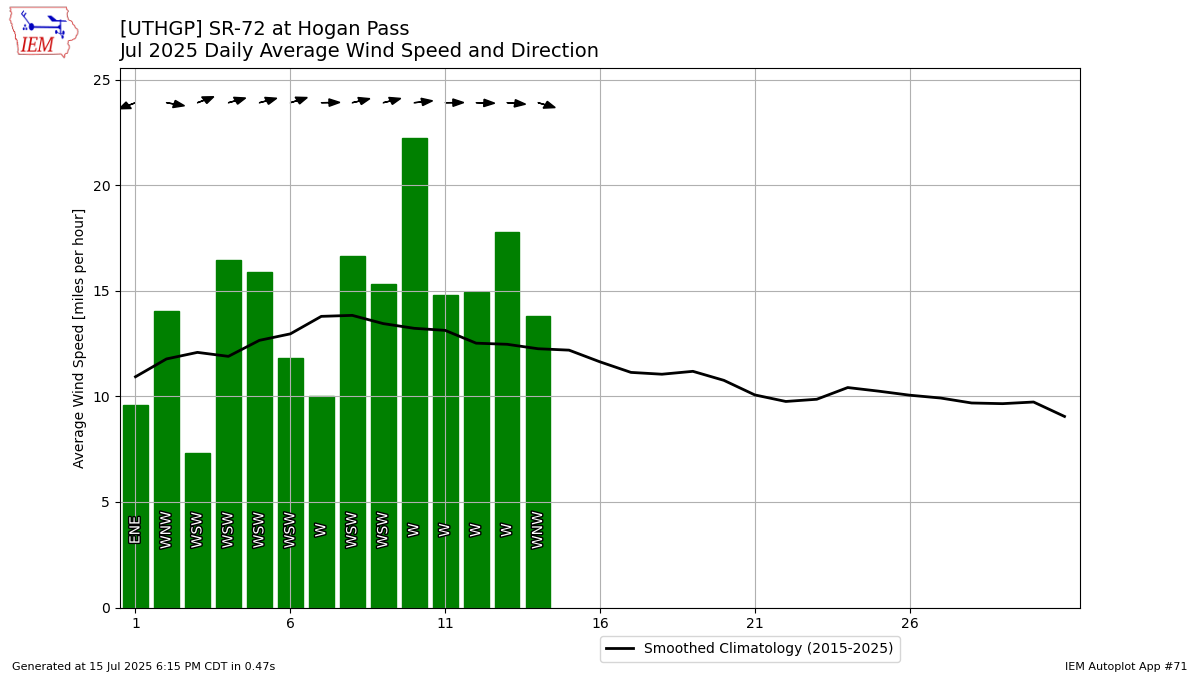
Description: This chart is of the daily average wind speeds.
The data presented here provided by IEM API webservice: daily.json. A simple CSV option exists as well.