| Oct 2025 | Nov 2025 | Dec 2025 | ||||
|---|---|---|---|---|---|---|
| Sunday | Monday | Tuesday | Wednesday | Thursday | Friday | Saturday |
| 26 | 27 | 28 | 29 | 30 | 31 | 01 High: 68.71998 Low: 27.440607 Precip: M Avg Wind: WSW @ 4.4 Gust: 17 (4:30 PM) RH% Min/Max: 12-57 Feel Min/Max: 21 to 69 |
| 02 High: 70.88 Low: 30.939808 Precip: M Avg Wind: WSW @ 4.9 Gust: 24 (1:40 PM) RH% Min/Max: 10-58 Feel Min/Max: 24 to 71 | 03 High: 67.17019 Low: 33.58037 Precip: M Avg Wind: WSW @ 4.2 Gust: 27 (12:20 PM) RH% Min/Max: 12-56 Feel Min/Max: 29 to 67 | 04 High: 65.800415 Low: 39.489807 Precip: M Avg Wind: WSW @ 4.3 Gust: 23 (10:50 AM) RH% Min/Max: 17-47 Feel Min/Max: 33 to 66 | 05 High: 67.249405 Low: 29.809425 Precip: M Avg Wind: SSE @ 4.8 Gust: 30 (11:40 AM) RH% Min/Max: 14-57 Feel Min/Max: 22 to 67 | 06 High: 56.08037 Low: 28.4792 Precip: M Avg Wind: W @ 5.5 Gust: 24 (4:00 AM) RH% Min/Max: 26-69 Feel Min/Max: 24 to 56 | 07 High: 58.44018 Low: 24.789223 Precip: M Avg Wind: WSW @ 5.4 Gust: 24 (1:10 PM) RH% Min/Max: 29-80 Feel Min/Max: 18 to 58 | 08 High: 54.120193 Low: 28.560225 Precip: M Avg Wind: WSW @ 4.2 Gust: 18 (3:30 PM) RH% Min/Max: 26-86 Feel Min/Max: 21 to 54 |
| 09 High: 57.050575 Low: 22.73 Precip: M Avg Wind: S @ 4.4 Gust: 14 (11:00 AM) RH% Min/Max: 21-87 Feel Min/Max: 17 to 57 | 10 High: 67.299774 Low: 25.419178 Precip: M Avg Wind: WSW @ 4.1 Gust: 17 (1:50 PM) RH% Min/Max: 13-70 Feel Min/Max: 19 to 67 | 11 High: 64.74018 Low: 30.590609 Precip: M Avg Wind: WSW @ 4.7 Gust: 18 (3:20 PM) RH% Min/Max: 17-53 Feel Min/Max: 25 to 65 | 12 High: 61.05921 Low: 29.600574 Precip: M Avg Wind: SW @ 2.5 Gust: 20 (1:00 PM) RH% Min/Max: 25-64 Feel Min/Max: 23 to 61 | 13 High: 64.76001 Low: 35.709797 Precip: M Avg Wind: SSW @ 3.3 Gust: 27 (11:30 AM) RH% Min/Max: 22-59 Feel Min/Max: 29 to 65 | 14 High: 63.24082 Low: 36.269608 Precip: M Avg Wind: ENE @ 3.6 Gust: 21 (8:10 AM) RH% Min/Max: 26-60 Feel Min/Max: 31 to 63 | 15 High: 62.400204 Low: 43.550575 Precip: M Avg Wind: SW @ 3.1 Gust: 13 (5:00 PM) RH% Min/Max: 34-69 Feel Min/Max: 40 to 62 |
| 16 High: 51.02957 Low: 35.200417 Precip: M Avg Wind: W @ 5.2 Gust: 22 (4:10 AM) RH% Min/Max: 49-86 Feel Min/Max: 30 to 51 | 17 High: 47.299988 Low: 29.879627 Precip: M Avg Wind: S @ 3.3 Gust: 21 (2:00 PM) RH% Min/Max: 52-90 Feel Min/Max: 24 to 47 | 18 High: 44.99061 Low: 30.740023 Precip: M Avg Wind: ESE @ 4.3 Gust: 23 (3:50 PM) RH% Min/Max: 65-91 Feel Min/Max: 26 to 42 | 19 High: 44.94018 Low: 32.129627 Precip: M Avg Wind: SW @ 3.7 Gust: 15 (1:40 PM) RH% Min/Max: 61-94 Feel Min/Max: 25 to 44 | 20 High: 44.40921 Low: 25.210382 Precip: M Avg Wind: WSW @ 3.6 Gust: 17 (1:00 PM) RH% Min/Max: 53-93 Feel Min/Max: 19 to 44 | 21 High: 43.80079 Low: 27.769978 Precip: M Avg Wind: S @ 2.8 Gust: 15 (1:40 PM) RH% Min/Max: 64-86 Feel Min/Max: 21 to 44 | 22 High: 45.449615 Low: 26.990608 Precip: M Avg Wind: ESE @ 3.5 Gust: 19 (11:50 AM) RH% Min/Max: 59-93 Feel Min/Max: 21 to 45 |
| 23 High: 51.310383 Low: 24.659584 Precip: M Avg Wind: WSW @ 5.2 Gust: 23 (2:00 PM) RH% Min/Max: 41-92 Feel Min/Max: 18 to 51 | 24 High: 50.700203 Low: 20.960596 Precip: M Avg Wind: WSW @ 5.3 Gust: 19 (11:40 AM) RH% Min/Max: 31-88 Feel Min/Max: 12 to 51 | 25 High: 47.049774 Low: 20.449404 Precip: M Avg Wind: WSW @ 4.4 Gust: 17 (2:30 PM) RH% Min/Max: 41-82 Feel Min/Max: 13 to 47 | 26 High: 52.129414 Low: 17.130213 Precip: M Avg Wind: WSW @ 3.5 Gust: 15 (12:40 PM) RH% Min/Max: 19-81 Feel Min/Max: 8 to 52 | 27 High: 59.610226 Low: 21.129786 Precip: M Avg Wind: WSW @ 3.6 Gust: 16 (3:10 PM) RH% Min/Max: 23-81 Feel Min/Max: 13 to 60 | 28 High: 56.58981 Low: 27.649403 Precip: M Avg Wind: WSW @ 8.6 Gust: 38 (2:40 PM) RH% Min/Max: 17-64 Feel Min/Max: 19 to 57 | 29 High: 44.97078 Low: 19.639381 Precip: M Avg Wind: WSW @ 4.4 Gust: 18 (2:40 PM) RH% Min/Max: 24-80 Feel Min/Max: 11 to 45 |
| 30 High: 41.52019 Low: 25.669392 Precip: M Avg Wind: SW @ 4.5 Gust: 23 (11:20 AM) RH% Min/Max: 27-88 Feel Min/Max: 16 to 41 | 01 | 02 | 03 | 04 | 05 | 06 |
The data presented here provided by IEM API webservice: daily.json. A simple CSV option exists as well.
Daily High/Low Plot
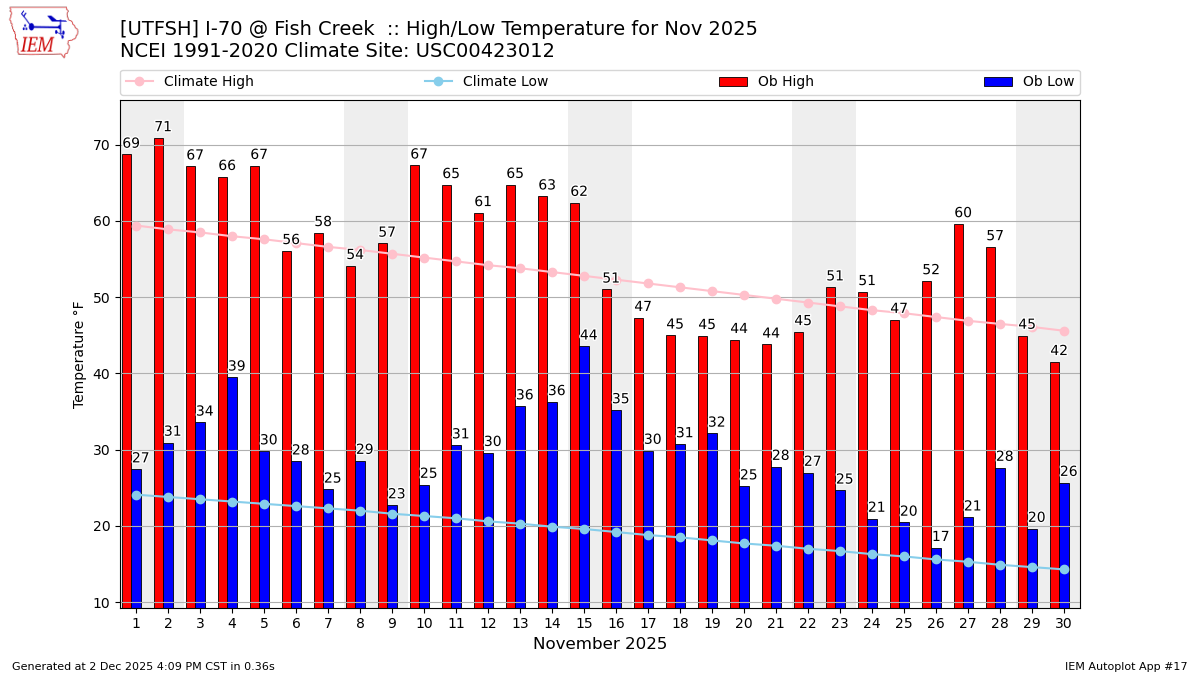
Description: This chart of the monthly temperature data. The bars are the observations and the dots are climatology.
Daily Rainfall

Description: This chart is of daily precipitation for the month. The red line would be an average month while the blue line and bars are observations.
Daily Average Wind Speeds
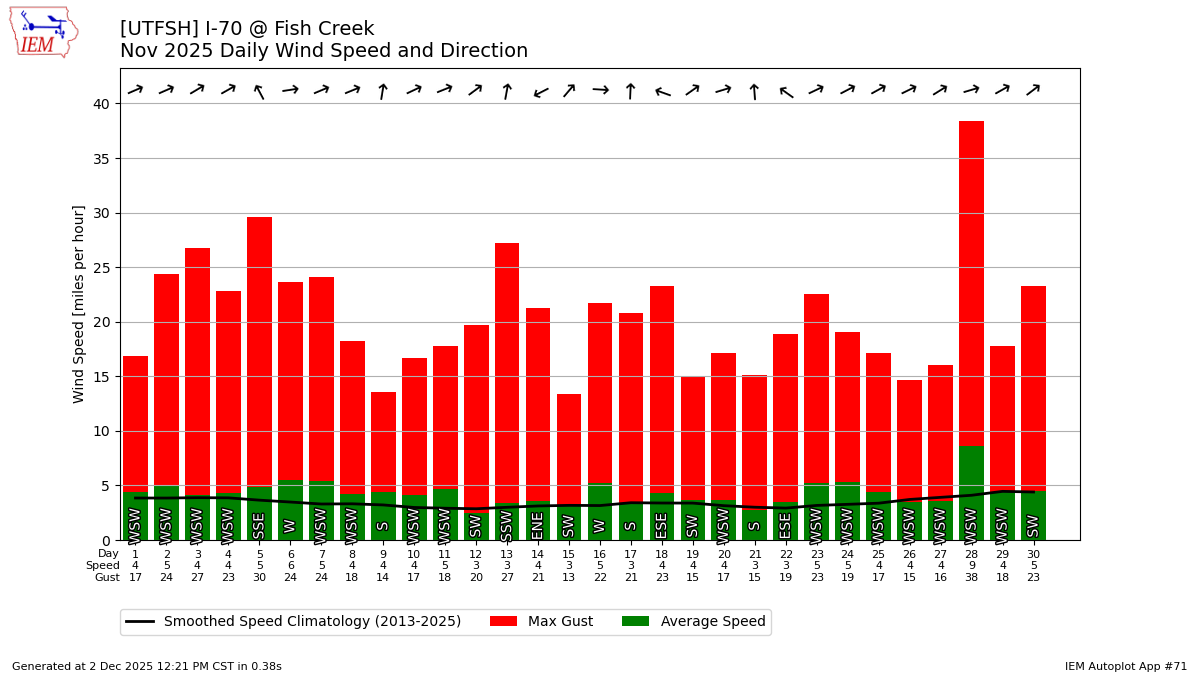
Description: This chart is of the daily average wind speeds.
The data presented here provided by IEM API webservice: daily.json. A simple CSV option exists as well.