| Jun 2025 | Jul 2025 | Aug 2025 | ||||
|---|---|---|---|---|---|---|
| Sunday | Monday | Tuesday | Wednesday | Thursday | Friday | Saturday |
| 29 | 30 | 01 High: 89.20042 Low: 62.850204 Precip: M Avg Wind: SSE @ 6.5 Gust: 30 (1:40 PM) RH% Min/Max: 12-35 Feel Min/Max: 63 to 85 | 02 High: 84.30079 Low: 62.290394 Precip: M Avg Wind: SSW @ 4.5 Gust: 27 (1:50 PM) RH% Min/Max: 19-63 Feel Min/Max: 62 to 82 | 03 High: 79.689224 Low: 57.74002 Precip: M Avg Wind: SW @ 4.9 Gust: 23 (6:40 PM) RH% Min/Max: 20-66 Feel Min/Max: 58 to 80 | 04 High: 84.99919 Low: 57.500576 Precip: M Avg Wind: SW @ 8.7 Gust: 29 (5:00 PM) RH% Min/Max: 15-52 Feel Min/Max: 58 to 82 | 05 High: 87.299614 Low: 58.38981 Precip: M Avg Wind: SW @ 7.2 Gust: 28 (12:30 PM) RH% Min/Max: 8-42 Feel Min/Max: 58 to 83 |
| 06 High: 89.99962 Low: 52.550575 Precip: M Avg Wind: WNW @ 4.5 Gust: 24 (6:40 PM) RH% Min/Max: 4-33 Feel Min/Max: 53 to 84 | 07 High: 91.90041 Low: 53.450577 Precip: M Avg Wind: WSW @ 5.1 Gust: 27 (3:00 PM) RH% Min/Max: 5-24 Feel Min/Max: 53 to 86 | 08 High: 91.999405 Low: 58.960384 Precip: M Avg Wind: WSW @ 5.6 Gust: 26 (1:40 PM) RH% Min/Max: 8-29 Feel Min/Max: 59 to 87 | 09 High: 93.000206 Low: 62.49018 Precip: M Avg Wind: SW @ 6.8 Gust: 32 (5:20 PM) RH% Min/Max: 13-42 Feel Min/Max: 62 to 89 | 10 High: 88.300415 Low: 61.300415 Precip: M Avg Wind: N @ 6.3 Gust: 33 (12:10 PM) RH% Min/Max: 4-30 Feel Min/Max: 61 to 83 | 11 High: 89.90057 Low: 53.090607 Precip: M Avg Wind: N @ 6.4 Gust: 32 (4:40 PM) RH% Min/Max: 7-37 Feel Min/Max: 53 to 85 | 12 High: 92.19919 Low: 57.230587 Precip: M Avg Wind: N @ 5.6 Gust: 25 (2:50 PM) RH% Min/Max: 9-41 Feel Min/Max: 57 to 87 |
| 13 High: 93.70042 Low: 59.509426 Precip: M Avg Wind: NNE @ 6.5 Gust: 28 (3:20 PM) RH% Min/Max: 7-33 Feel Min/Max: 60 to 88 | 14 High: 94.89919 Low: 60.220406 Precip: M Avg Wind: N @ 8.2 Gust: 23 (4:30 PM) RH% Min/Max: 7-28 Feel Min/Max: 60 to 89 | 15 High: 93.19999 Low: 69.380585 Precip: M Gust: 19 (1:30 PM) RH% Min/Max: 11-27 Feel Min/Max: 69 to 88 | 16 Precip: M | 17 | 18 | 19 |
| 20 | 21 | 22 | 23 | 24 | 25 | 26 |
| 27 | 28 | 29 | 30 | 31 | 01 | 02 |
The data presented here provided by IEM API webservice: daily.json. A simple CSV option exists as well.
Daily High/Low Plot

Description: This chart of the monthly temperature data. The bars are the observations and the dots are climatology.
Daily Rainfall

Description: This chart is of daily precipitation for the month. The red line would be an average month while the blue line and bars are observations.
Daily Average Wind Speeds
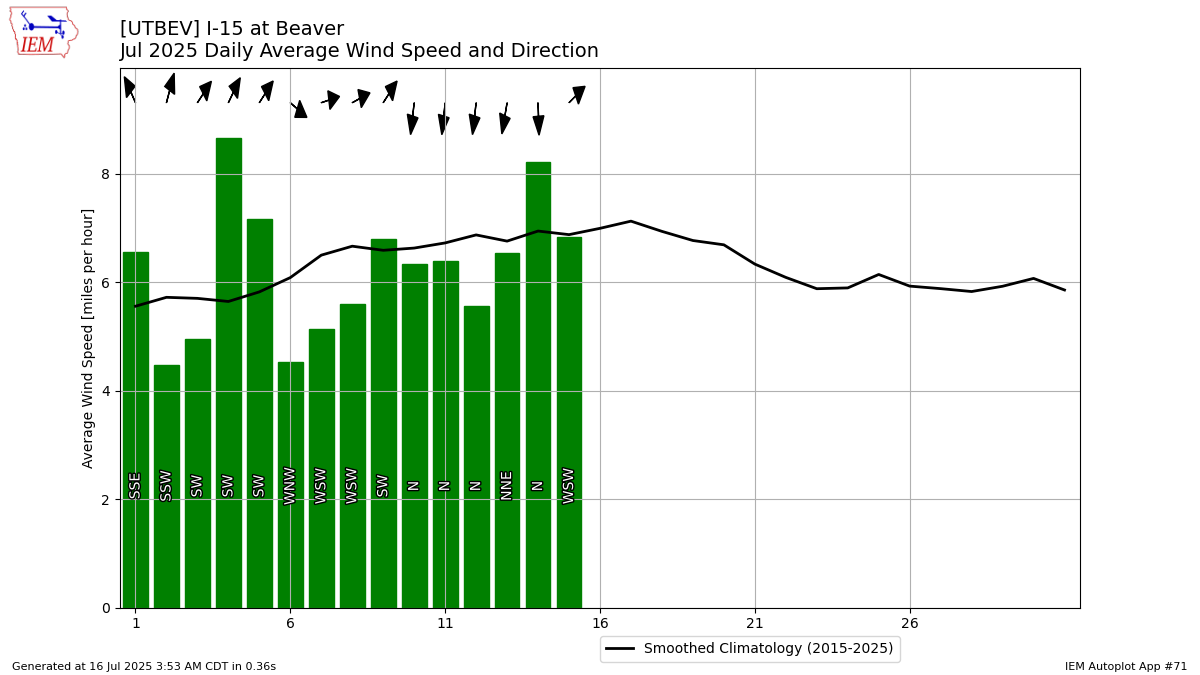
Description: This chart is of the daily average wind speeds.
The data presented here provided by IEM API webservice: daily.json. A simple CSV option exists as well.