| Jun 2025 | Jul 2025 | Aug 2025 | ||||
|---|---|---|---|---|---|---|
| Sunday | Monday | Tuesday | Wednesday | Thursday | Friday | Saturday |
| 29 | 30 | 01 High: 91.38922 Low: 74.37019 Precip: M Avg Wind: S @ 3.6 Gust: 36 (4:30 PM) RH% Min/Max: 82-100 Feel Min/Max: 74 to 121 | 02 High: 86.520195 Low: 71.4308 Precip: M Avg Wind: WSW @ 2.2 Gust: 10 (2:59 AM) RH% Min/Max: 72-100 Feel Min/Max: 71 to 102 | 03 High: 91.630424 Low: 73.43059 Precip: M Avg Wind: WSW @ 2.8 Gust: 14 (2:20 PM) RH% Min/Max: 44-100 Feel Min/Max: 73 to 99 | 04 High: 86.10079 Low: 68.419395 Precip: M Avg Wind: N @ 1.9 Gust: 13 (1:00 AM) RH% Min/Max: 52-100 Feel Min/Max: 68 to 92 | 05 High: 87.5696 Low: 67.73 Precip: M Avg Wind: SSE @ 2.1 Gust: 12 (3:00 PM) RH% Min/Max: 51-100 Feel Min/Max: 68 to 95 |
| 06 High: 88.82062 Low: 69.1502 Precip: M Avg Wind: SSE @ 2.4 Gust: 18 (6:00 PM) RH% Min/Max: 70-100 Feel Min/Max: 69 to 106 | 07 High: 88.359795 Low: 75.30079 Precip: M Avg Wind: NNE @ 1.7 Gust: 9 (2:20 PM) RH% Min/Max: 83-100 Feel Min/Max: 75 to 111 | 08 High: 91.95079 Low: 73.81039 Precip: M Avg Wind: SSW @ 2.6 Gust: 37 (5:49 PM) RH% Min/Max: 74-100 Feel Min/Max: 74 to 120 | 09 High: 89.040184 Low: 72.339806 Precip: M Avg Wind: SSW @ 2.6 Gust: 26 (7:30 PM) RH% Min/Max: 81-100 Feel Min/Max: 72 to 112 | 10 High: 83.64018 Low: 71.97078 Precip: M Avg Wind: SSW @ 1.6 Gust: 9 (2:09 AM) RH% Min/Max: 94-100 Feel Min/Max: 72 to 102 | 11 High: 89.76918 Low: 73.43059 Precip: M Avg Wind: NNE @ 1.5 Gust: 11 (1:50 PM) RH% Min/Max: 59-100 Feel Min/Max: 73 to 104 | 12 High: 89.729576 Low: 76.44919 Precip: M Avg Wind: ENE @ 1.8 Gust: 16 (10:10 PM) RH% Min/Max: 75-100 Feel Min/Max: 76 to 112 |
| 13 High: 87.220406 Low: 76.64002 Precip: M Avg Wind: SE @ 2.1 Gust: 12 (11:20 AM) RH% Min/Max: 90-100 Feel Min/Max: 77 to 110 | 14 High: 88.59018 Low: 72.1598 Precip: M Avg Wind: SSE @ 2.7 Gust: 27 (6:59 PM) RH% Min/Max: 83-100 Feel Min/Max: 72 to 114 | 15 High: 88.59018 Low: 72.89061 Precip: M Avg Wind: SSW @ 1.9 Gust: 11 (5:09 PM) RH% Min/Max: 77-100 Feel Min/Max: 73 to 109 | 16 High: 78.540825 Low: 76.44919 Precip: M Gust: 12 (2:10 AM) RH% Min/Max: 100-100 Feel Min/Max: 76 to 79 | 17 Precip: M | 18 | 19 |
| 20 | 21 | 22 | 23 | 24 | 25 | 26 |
| 27 | 28 | 29 | 30 | 31 | 01 | 02 |
The data presented here provided by IEM API webservice: daily.json. A simple CSV option exists as well.
Daily High/Low Plot

Description: This chart of the monthly temperature data. The bars are the observations and the dots are climatology.
Daily Rainfall
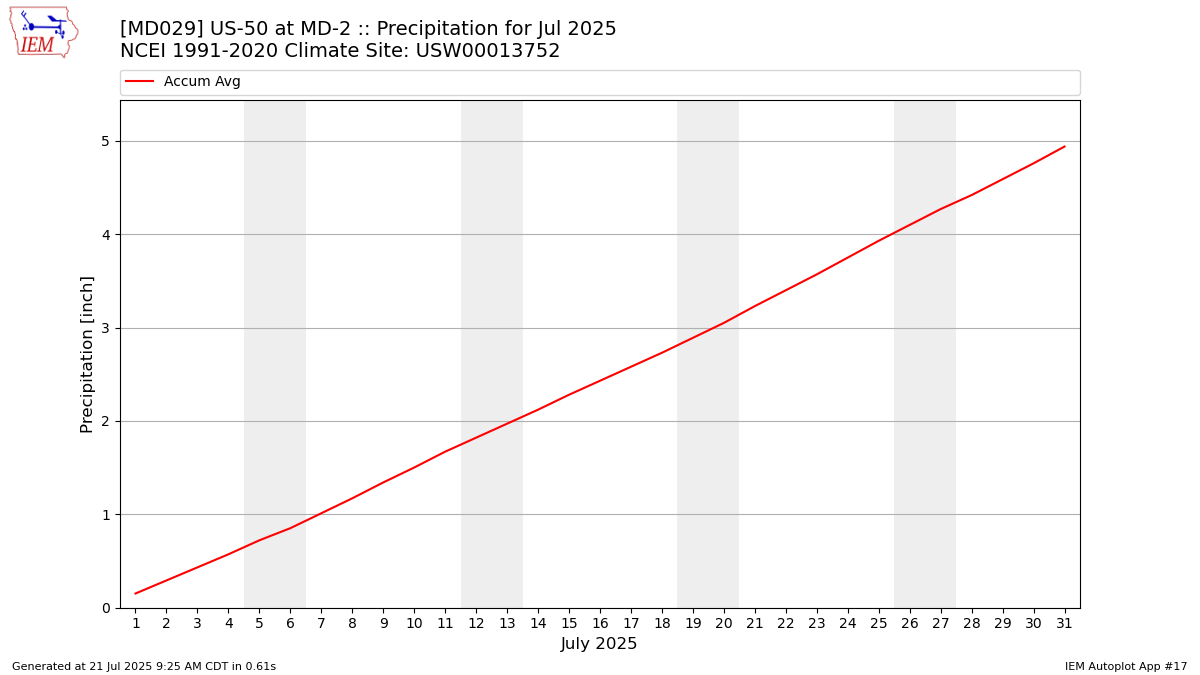
Description: This chart is of daily precipitation for the month. The red line would be an average month while the blue line and bars are observations.
Daily Average Wind Speeds

Description: This chart is of the daily average wind speeds.
The data presented here provided by IEM API webservice: daily.json. A simple CSV option exists as well.