Information Last Ob Photographs Calibration Meteogram Network Table Neighbors Monthly Summaries Observation History Wind Roses Custom Wind Roses Data Calendar
| Mar 2025 | Apr 2025 | May 2025 | ||||
|---|---|---|---|---|---|---|
| Sunday | Monday | Tuesday | Wednesday | Thursday | Friday | Saturday |
| 30 | 31 | 01 High: 38.2856 Low: 28.8032 Precip: 0.26 RH% Min/Max: 83-100 Feel Min/Max: 29 to 38 | 02 High: 52.97 Low: 33.08 Precip: 0.54 RH% Min/Max: 86-100 Feel Min/Max: 33 to 53 | 03 High: 42.4904 Low: 32.0756 Precip: 0.00 RH% Min/Max: 73-94 Feel Min/Max: 32 to 42 | 04 High: 48.524 Low: 28.6232 Precip: 0.00 RH% Min/Max: 64-100 Feel Min/Max: 29 to 49 | 05 High: 43.2302 Low: 29.2 Precip: 0.00 Gust: 1 (3:44 PM) RH% Min/Max: 37-99 Feel Min/Max: 26 to 43 |
| 06 High: 58.154 Low: 20.3288 Precip: 0.00 Gust: 1 (6:40 PM) RH% Min/Max: 29-91 Feel Min/Max: 20 to 58 | 07 High: 41.2232 Low: 25.9 Precip: 0.00 RH% Min/Max: 30-87 Feel Min/Max: 22 to 41 | 08 High: 52.574 Low: 16.736 Precip: 0.00 RH% Min/Max: 23-83 Feel Min/Max: 17 to 53 | 09 High: 65.246 Low: 30.2306 Precip: 0.00 RH% Min/Max: 33-78 Feel Min/Max: 30 to 65 | 10 High: 58.748 Low: 37.8266 Precip: 0.00 RH% Min/Max: 52-87 Feel Min/Max: 38 to 59 | 11 High: 55.868 Low: 37.148 Precip: 0.00 Gust: 1 (10:05 AM) RH% Min/Max: 51-95 Feel Min/Max: 37 to 56 | 12 High: 71.474 Low: 34.4732 Precip: 0.00 Gust: 11 (8:44 AM) RH% Min/Max: 33-93 Feel Min/Max: 34 to 71 |
| 13 High: 73.022 Low: 51.368 Precip: 0.00 Gust: 1 (7:05 PM) RH% Min/Max: 43-71 Feel Min/Max: 51 to 73 | 14 High: 56.732 Low: 38.2262 Precip: 0.00 RH% Min/Max: 40-82 Feel Min/Max: 38 to 57 | 15 High: 59.072 Low: 32.3924 Precip: 0.00 RH% Min/Max: 25-88 Feel Min/Max: 32 to 59 | 16 High: 73.4 Low: 31.7 Precip: 0.00 RH% Min/Max: 23-75 Feel Min/Max: 28 to 73 | 17 High: 80.798 Low: 51.512 Precip: 0.05 RH% Min/Max: 38-98 Feel Min/Max: 52 to 81 | 18 High: 53.942 Low: 43.2 Precip: 1.07 Gust: 6 (4:19 AM) RH% Min/Max: 68-100 Feel Min/Max: 42 to 54 | 19 High: 53.564 Low: 33.485 Precip: 0.00 RH% Min/Max: 42-93 Feel Min/Max: 33 to 54 |
| 20 High: 45.743 Low: 33.9818 Precip: 0.60 RH% Min/Max: 70-100 Feel Min/Max: 34 to 46 | 21 High: 62.528 Low: 39.5636 Precip: 0.10 RH% Min/Max: 52-100 Feel Min/Max: 40 to 63 | 22 High: 69.008 Low: 47.894 Precip: 0.01 RH% Min/Max: 39-98 Feel Min/Max: 48 to 69 | 23 High: 70.916 Low: 46.94 Precip: 0.42 Gust: 1 (2:25 PM) RH% Min/Max: 57-98 Feel Min/Max: 47 to 71 | 24 High: 58.082 Low: 46.544 Precip: 0.48 RH% Min/Max: 76-100 Feel Min/Max: 47 to 58 | 25 High: 52.808 Low: 42.9 Precip: 0.30 RH% Min/Max: 79-100 Feel Min/Max: 40 to 53 | 26 High: 59.252 Low: 33.755 Precip: 0.00 Gust: 9 (2:40 PM) RH% Min/Max: 47-100 Feel Min/Max: 34 to 59 |
| 27 High: 64.436 Low: 45.6746 Precip: 0.00 Gust: 14 (8:13 AM) RH% Min/Max: 68-92 Feel Min/Max: 46 to 64 | 28 High: 79.934 Low: 54.1 Precip: 0.06 RH% Min/Max: 62-99 Feel Min/Max: 50 to 80 | 29 High: 59.126 Low: 37.967 Precip: 0.00 RH% Min/Max: 33-94 Feel Min/Max: 38 to 59 | 30 High: 70.322 Low: 37.2218 Precip: 0.00 RH% Min/Max: 31-91 Feel Min/Max: 37 to 70 | 01 | 02 | 03 |
The data presented here provided by IEM API webservice: daily.json. A simple CSV option exists as well.
Daily High/Low Plot
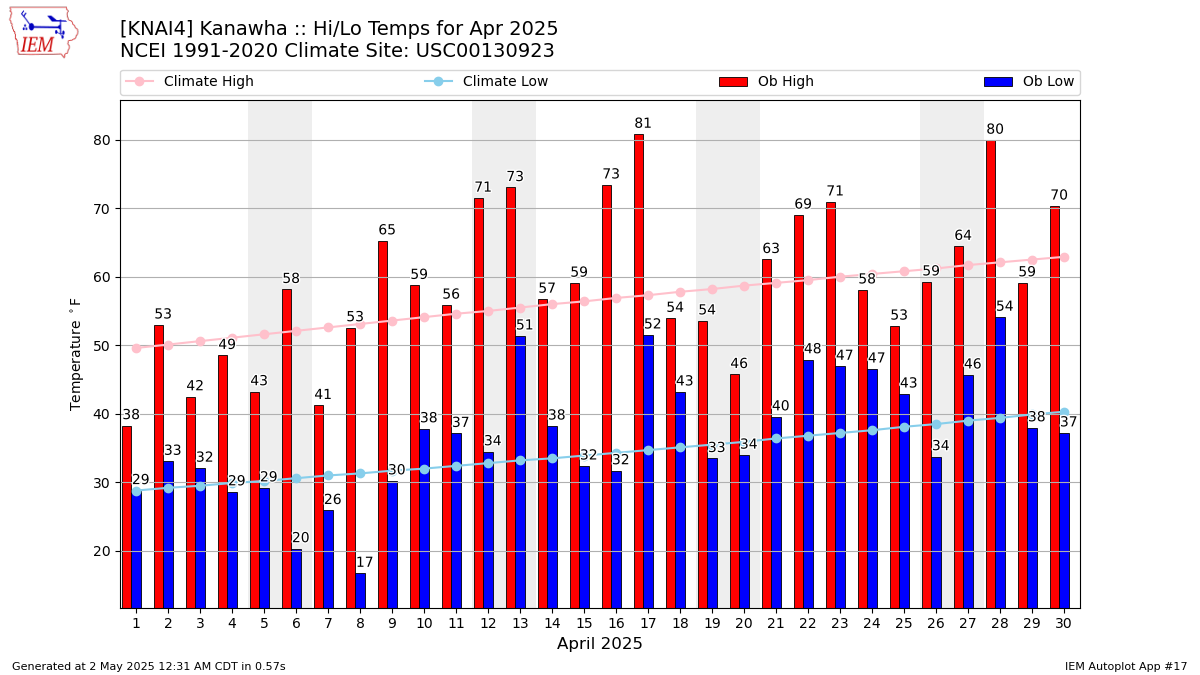
Description: This chart of the monthly temperature data. The bars are the observations and the dots are climatology.
Daily Rainfall

Description: This chart is of daily precipitation for the month. The red line would be an average month while the blue line and bars are observations.
Daily Average Wind Speeds
Description: This chart is of the daily average wind speeds.
The data presented here provided by IEM API webservice: daily.json. A simple CSV option exists as well.