Information Last Ob Photographs Calibration Meteogram Network Table Neighbors Monthly Summaries Observation History Wind Roses Custom Wind Roses Data Calendar
| Mar 2025 | Apr 2025 | May 2025 | ||||
|---|---|---|---|---|---|---|
| Sunday | Monday | Tuesday | Wednesday | Thursday | Friday | Saturday |
| 30 | 31 | 01 High: 38.1812 Low: 31.8686 Precip: 0.22 Gust: 36 (2:46 PM) RH% Min/Max: 79-100 Feel Min/Max: 21 to 28 | 02 High: 42.2402 Low: 32.0234 Precip: 0.36 Gust: 36 (12:28 AM) RH% Min/Max: 88-100 Feel Min/Max: 20 to 42 | 03 High: 46.508 Low: 32.0882 Precip: 0.15 Gust: 31 (2:37 AM) RH% Min/Max: 70-99 Feel Min/Max: 19 to 47 | 04 High: 50 Low: 30.3206 Precip: 0.05 Gust: 23 (11:24 PM) RH% Min/Max: 69-100 Feel Min/Max: 24 to 50 | 05 High: 44.465 Low: 25.7 Precip: 0.00 Gust: 25 (5:07 PM) RH% Min/Max: 34-100 Feel Min/Max: 15 to 38 |
| 06 High: 60.08 Low: 21.623 Precip: 0.00 Gust: 23 (4:53 PM) RH% Min/Max: 26-86 Feel Min/Max: 16 to 60 | 07 High: 41.7938 Low: 23.5 Precip: 0.00 Gust: 25 (8:58 AM) RH% Min/Max: 26-84 Feel Min/Max: 13 to 37 | 08 High: 56.822 Low: 16.988 Precip: 0.00 Gust: 22 (3:29 PM) RH% Min/Max: 25-83 Feel Min/Max: 11 to 57 | 09 High: 71.726 Low: 32.5796 Precip: M Gust: 29 (5:31 PM) RH% Min/Max: 17-73 Feel Min/Max: 28 to 72 | 10 High: 60.494 Low: 39.4952 Precip: M Gust: 31 (12:05 PM) RH% Min/Max: 47-90 Feel Min/Max: 34 to 60 | 11 High: 63.428 Low: 24.0134 Precip: 0.00 Gust: 16 (11:22 PM) RH% Min/Max: 34-100 Feel Min/Max: 18 to 63 | 12 High: 76.316 Low: 40.5446 Precip: 0.00 Gust: 34 (2:24 PM) RH% Min/Max: 31-88 Feel Min/Max: 34 to 76 |
| 13 High: 76.244 Low: 50.792 Precip: 0.02 Gust: 29 (7:40 PM) RH% Min/Max: 37-83 Feel Min/Max: 51 to 76 | 14 High: 53.15 Low: 36.4388 Precip: 0.00 Gust: 41 (3:57 PM) RH% Min/Max: 43-89 Feel Min/Max: 27 to 53 | 15 High: 61.178 Low: 27.3902 Precip: 0.00 Gust: 30 (12:26 PM) RH% Min/Max: 23-93 Feel Min/Max: 21 to 61 | 16 High: 75.56 Low: 36.203 Precip: 0.00 Gust: 28 (2:13 PM) RH% Min/Max: 28-58 Feel Min/Max: 30 to 76 | 17 High: 81.158 Low: 45.7556 Precip: 0.11 Gust: 27 (12:23 PM) RH% Min/Max: 44-95 Feel Min/Max: 39 to 82 | 18 High: 55.058 Low: 39.4 Precip: 0.22 Gust: 29 (2:54 AM) RH% Min/Max: 51-97 Feel Min/Max: 31 to 55 | 19 High: 57.506 Low: 28.0508 Precip: 0.10 Gust: 18 (1:09 PM) RH% Min/Max: 32-95 Feel Min/Max: 21 to 58 |
| 20 High: 48.236 Low: 35.816 Precip: 0.02 Gust: 24 (7:57 PM) RH% Min/Max: 57-99 Feel Min/Max: 30 to 44 | 21 High: 67.82 Low: 35.1608 Precip: 0.01 Gust: 18 (11:26 PM) RH% Min/Max: 36-100 Feel Min/Max: 31 to 68 | 22 High: 72.284 Low: 42.5858 Precip: 0.01 Gust: 22 (11:43 AM) RH% Min/Max: 23-99 Feel Min/Max: 39 to 72 | 23 High: 72.5 Low: 41.9522 Precip: 0.03 Gust: 23 (5:19 PM) RH% Min/Max: 33-86 Feel Min/Max: 39 to 72 | 24 High: 56.8 Low: 44.8664 Precip: 0.16 Gust: 25 (5:09 PM) RH% Min/Max: 75-100 Feel Min/Max: 37 to 51 | 25 High: 58.28 Low: 43 Precip: 0.05 Gust: 27 (11:36 AM) RH% Min/Max: 59-100 Feel Min/Max: 35 to 58 | 26 High: 60.638 Low: 34.4642 Precip: 0.35 Gust: 24 (2:25 PM) RH% Min/Max: 42-100 Feel Min/Max: 31 to 61 |
| 27 High: 63.644 Low: 45.383 Precip: 0.00 Gust: 27 (12:52 PM) RH% Min/Max: 74-99 Feel Min/Max: 41 to 64 | 28 High: 82.832 Low: 45.7646 Precip: 0.11 Gust: 36 (8:12 PM) RH% Min/Max: 46-100 Feel Min/Max: 38 to 85 | 29 High: 62.024 Low: 37.7654 Precip: 0.00 Gust: 32 (3:06 AM) RH% Min/Max: 25-96 Feel Min/Max: 28 to 62 | 30 High: 65.966 Low: 39.866 Precip: 0.00 Gust: 21 (9:56 AM) RH% Min/Max: 42-97 Feel Min/Max: 36 to 66 | 01 | 02 | 03 |
The data presented here provided by IEM API webservice: daily.json. A simple CSV option exists as well.
Daily High/Low Plot
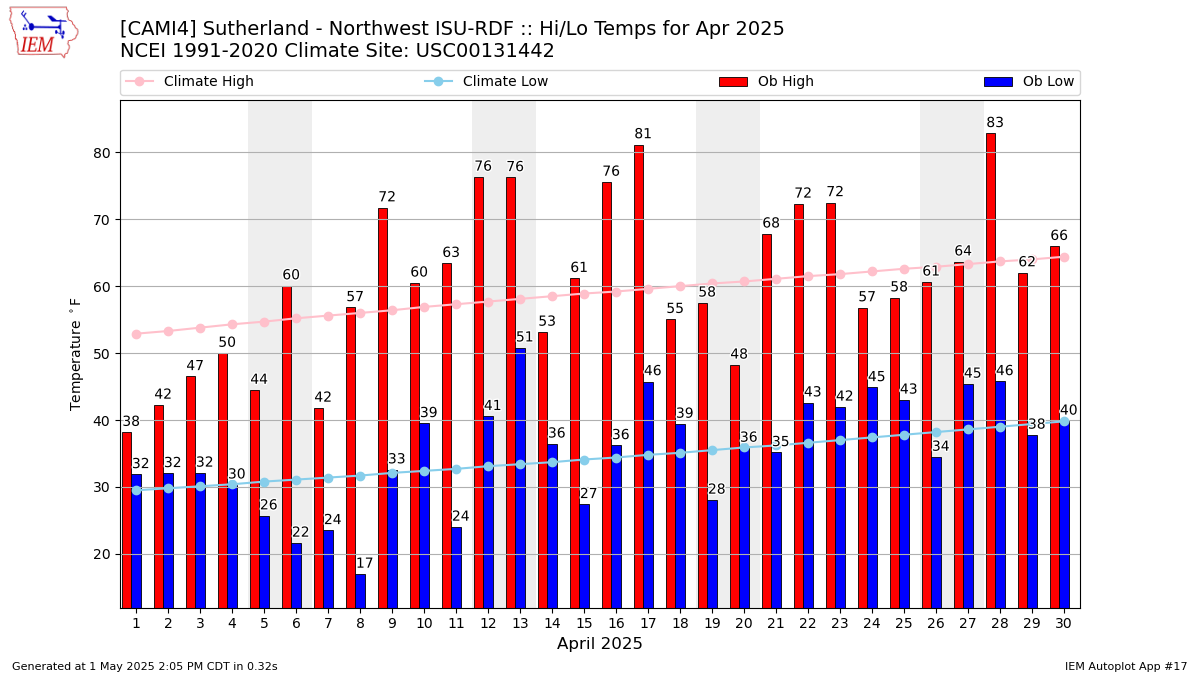
Description: This chart of the monthly temperature data. The bars are the observations and the dots are climatology.
Daily Rainfall
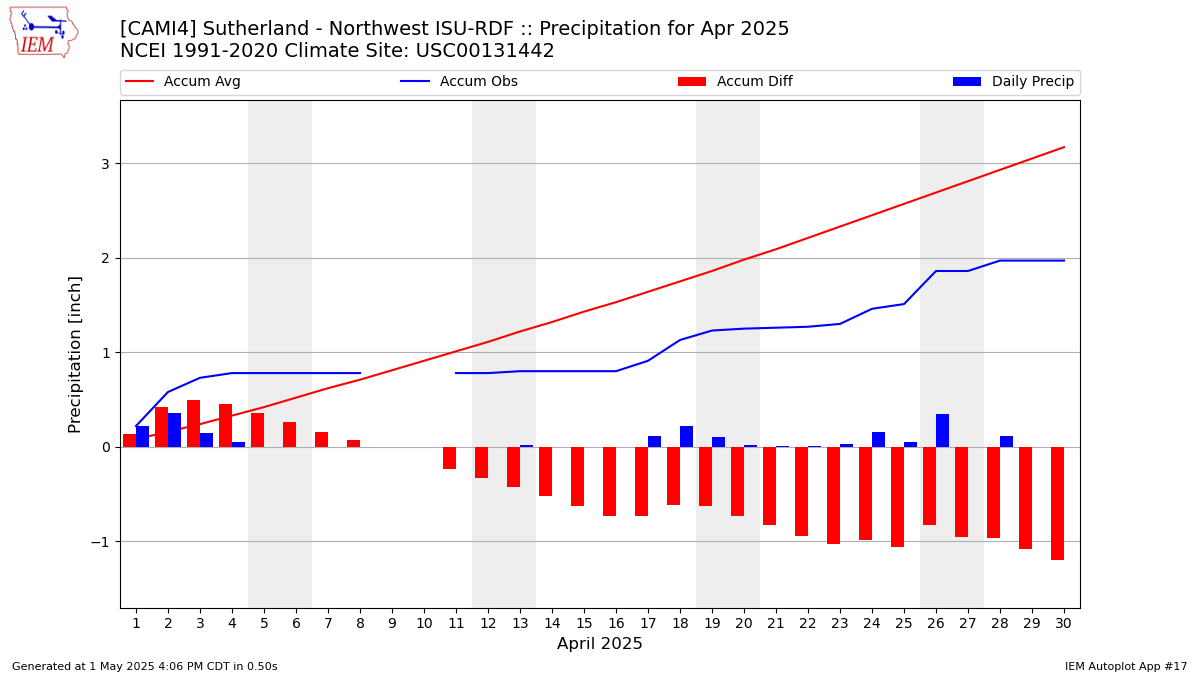
Description: This chart is of daily precipitation for the month. The red line would be an average month while the blue line and bars are observations.
Daily Average Wind Speeds
Description: This chart is of the daily average wind speeds.
The data presented here provided by IEM API webservice: daily.json. A simple CSV option exists as well.