Information Last Ob Photographs Calibration Meteogram Network Table Neighbors Monthly Summaries Observation History Wind Roses Custom Wind Roses Data Calendar
| Mar 2025 | Apr 2025 | May 2025 | ||||
|---|---|---|---|---|---|---|
| Sunday | Monday | Tuesday | Wednesday | Thursday | Friday | Saturday |
| 30 | 31 | 01 High: 43.412 Low: 31.145 Precip: 0.13 RH% Min/Max: 72-91 Feel Min/Max: 31 to 43 | 02 High: 68.882 Low: 41.009 Precip: 0.41 Gust: 1 (1:11 PM) RH% Min/Max: 60-100 Feel Min/Max: 41 to 69 | 03 High: 49.568 Low: 33.872 Precip: 0.00 Gust: 1 (5:43 PM) RH% Min/Max: 62-90 Feel Min/Max: 34 to 50 | 04 High: 51.35 Low: 32.639 Precip: 0.00 RH% Min/Max: 62-96 Feel Min/Max: 33 to 51 | 05 High: 47.246 Low: 28.6034 Precip: 0.00 RH% Min/Max: 34-94 Feel Min/Max: 29 to 47 |
| 06 High: 58.856 Low: 21.7688 Precip: 0.00 RH% Min/Max: 28-94 Feel Min/Max: 22 to 59 | 07 High: 44.7386 Low: 28.4 Precip: 0.00 RH% Min/Max: 31-84 Feel Min/Max: 25 to 45 | 08 High: 53.924 Low: 17.276 Precip: 0.00 RH% Min/Max: 24-91 Feel Min/Max: 17 to 54 | 09 High: 66.434 Low: 36.9878 Precip: 0.00 Gust: 1 (5:33 PM) RH% Min/Max: 34-74 Feel Min/Max: 37 to 66 | 10 High: 62.312 Low: 41.711 Precip: 0.00 RH% Min/Max: 46-84 Feel Min/Max: 42 to 62 | 11 High: 58.946 Low: 39.245 Precip: 0.00 Gust: 1 (2:47 PM) RH% Min/Max: 47-92 Feel Min/Max: 39 to 59 | 12 High: 71.33 Low: 34.5 Precip: 0.00 Gust: 1 (3:10 PM) RH% Min/Max: 36-91 Feel Min/Max: 39 to 71 |
| 13 High: 78.638 Low: 53.366 Precip: 0.00 Gust: 1 (1:00 PM) RH% Min/Max: 39-66 Feel Min/Max: 53 to 79 | 14 High: 60.26 Low: 40.7948 Precip: 0.00 Gust: 1 (2:50 PM) RH% Min/Max: 38-86 Feel Min/Max: 41 to 60 | 15 High: 61.952 Low: 35.9294 Precip: 0.00 Gust: 1 (6:13 PM) RH% Min/Max: 23-86 Feel Min/Max: 36 to 62 | 16 High: 74.696 Low: 32.6768 Precip: 0.00 Gust: 1 (3:28 PM) RH% Min/Max: 23-86 Feel Min/Max: 33 to 75 | 17 High: 77.522 Low: 55.634 Precip: 0.00 Gust: 1 (12:23 PM) RH% Min/Max: 43-82 Feel Min/Max: 56 to 78 | 18 High: 67.82 Low: 43.5848 Precip: 0.00 Gust: 1 (12:20 AM) RH% Min/Max: 60-100 Feel Min/Max: 44 to 68 | 19 High: 57.956 Low: 36.9032 Precip: 0.00 Gust: 1 (2:31 PM) RH% Min/Max: 33-82 Feel Min/Max: 37 to 58 |
| 20 High: 48.47 Low: 39.8354 Precip: 1.19 RH% Min/Max: 58-100 Feel Min/Max: 40 to 48 | 21 High: 66.236 Low: 41.8676 Precip: 0.00 Gust: 1 (3:18 PM) RH% Min/Max: 44-100 Feel Min/Max: 42 to 66 | 22 High: 74.12 Low: 49.7 Precip: 0.00 Gust: 1 (1:39 PM) RH% Min/Max: 36-94 Feel Min/Max: 52 to 74 | 23 High: 75.848 Low: 53.384 Precip: 0.62 Gust: 1 (12:44 PM) RH% Min/Max: 56-99 Feel Min/Max: 53 to 76 | 24 High: 70.016 Low: 52.232 Precip: 0.00 Gust: 1 (2:15 AM) RH% Min/Max: 77-97 Feel Min/Max: 52 to 70 | 25 High: 57.794 Low: 45.5684 Precip: 0.50 Gust: 1 (12:59 AM) RH% Min/Max: 83-100 Feel Min/Max: 46 to 58 | 26 High: 63.356 Low: 38.1218 Precip: 0.00 Gust: 1 (12:00 AM) RH% Min/Max: 40-100 Feel Min/Max: 38 to 63 |
| 27 High: 66.758 Low: 45.6728 Precip: 0.00 Gust: 1 (3:54 PM) RH% Min/Max: 64-85 Feel Min/Max: 46 to 67 | 28 High: 79.736 Low: 57.002 Precip: 0.23 Gust: 1 (11:14 AM) RH% Min/Max: 67-96 Feel Min/Max: 57 to 80 | 29 High: 65.156 Low: 44.2238 Precip: 0.00 Gust: 1 (9:42 AM) RH% Min/Max: 22-91 Feel Min/Max: 44 to 65 | 30 High: 68.576 Low: 41.8676 Precip: 0.00 Gust: 1 (4:58 PM) RH% Min/Max: 40-95 Feel Min/Max: 42 to 69 | 01 | 02 | 03 |
The data presented here provided by IEM API webservice: daily.json. A simple CSV option exists as well.
Daily High/Low Plot
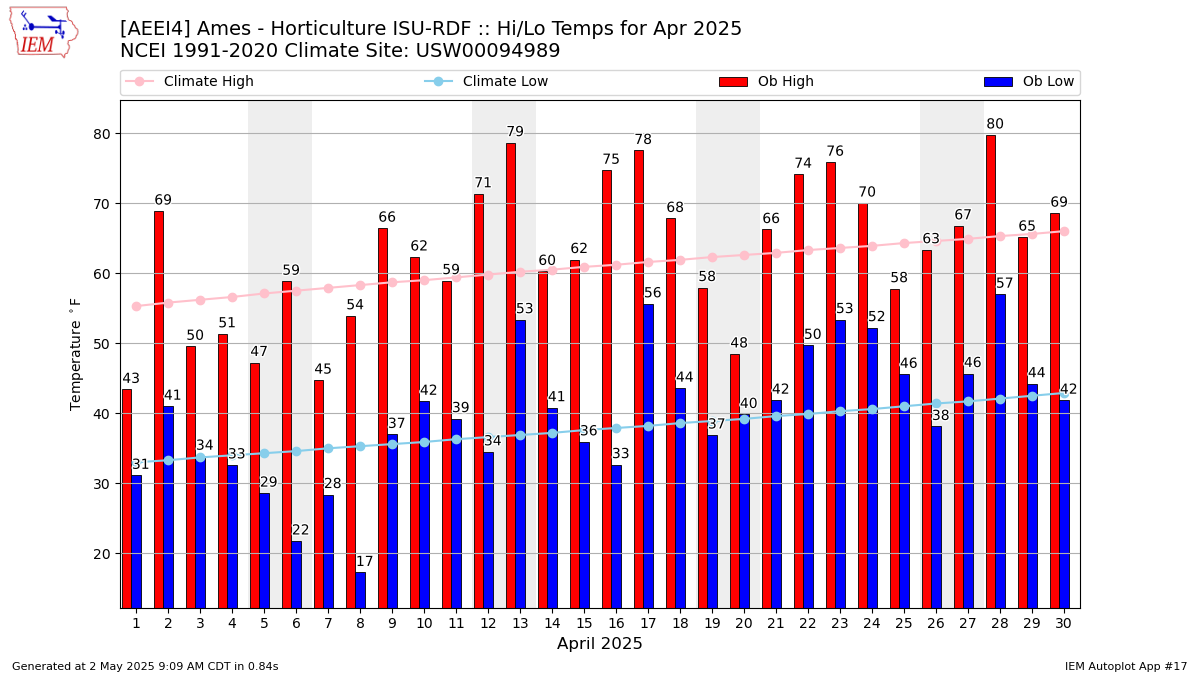
Description: This chart of the monthly temperature data. The bars are the observations and the dots are climatology.
Daily Rainfall
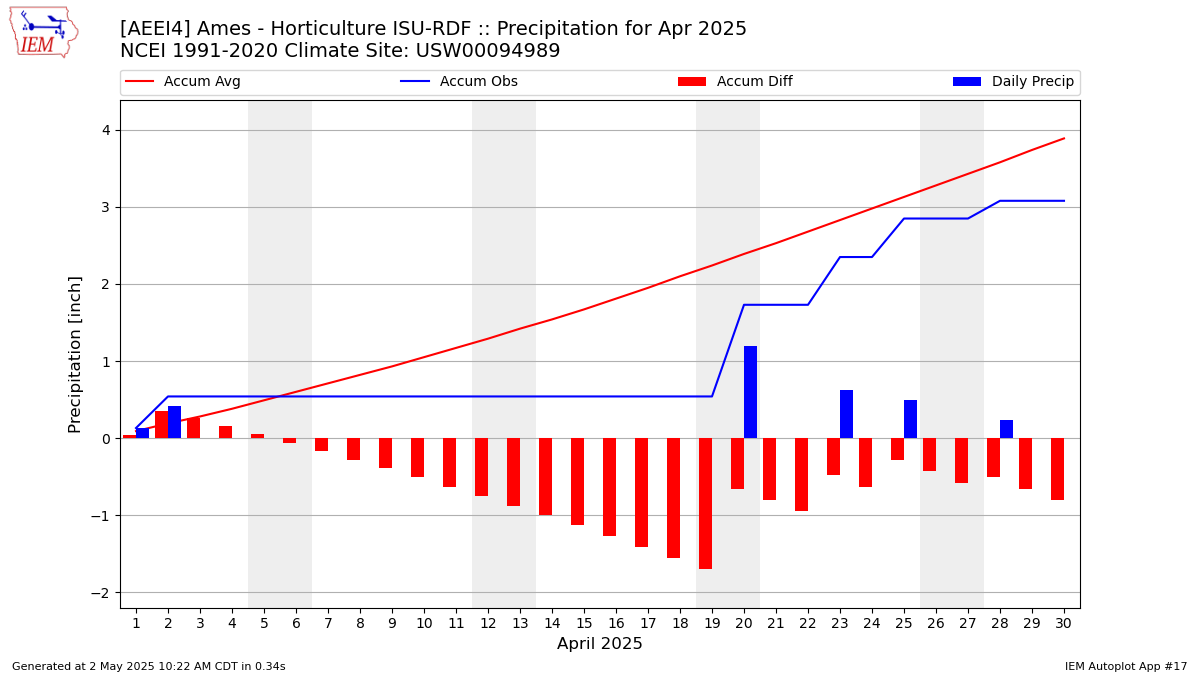
Description: This chart is of daily precipitation for the month. The red line would be an average month while the blue line and bars are observations.
Daily Average Wind Speeds

Description: This chart is of the daily average wind speeds.
The data presented here provided by IEM API webservice: daily.json. A simple CSV option exists as well.