Automated Data Plotter
This application dynamically generates many types of graphs derived from various IEM data sources. Feel free to use these generated graphics in whatever way you wish.
1 Select a Chart Type
2 Configure Chart Options
Plot Description:
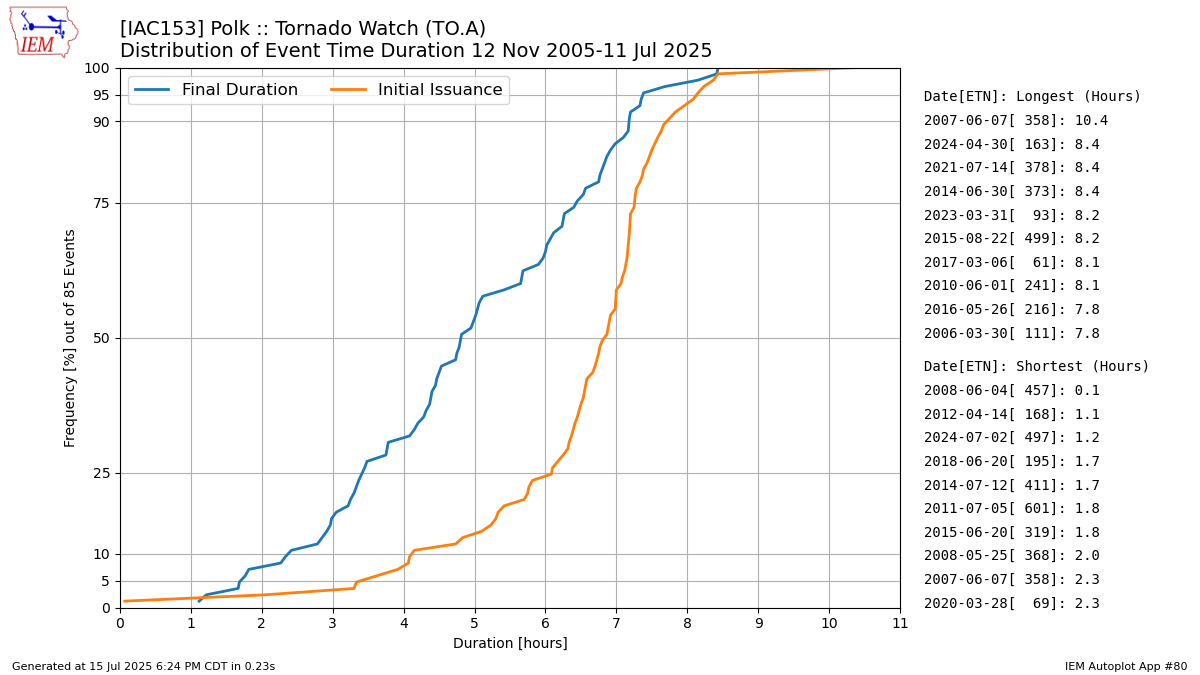
This plot presents the accumulated frequency of duration for a given NWS VTEC Watch, Warning, Advisory product. The complication with this tool is that some alerts are issued for zones and others are for counties. If you do not find results for one, try switching to the other.When you plot by a WFO, this tool will treat each individual combination of a VTEC event and UGC has an individual event.
There's a second major complication and that is the case of watches and how VTEC handles issuance and expiration time. Some watches are issued for time periods well into the future and are either cancelled or upgraded prior to the VTEC issuance time. In those cases, this app considers the wall clock issuance time of the watch as the start time and the wall clock time when the watch was either cancelled or upgraded. In this case, both lines are presented as equal.
3 Generated Chart
Based on recent timings, plot generation averages 2 seconds. Please wait while your chart is being generated...
IEM Daily Features using this plot
The IEM Daily Features found on this website often utilize plots found on this application. Here is a listing of features referencing this plot type.
- 10 Apr 2025: Red Flag Warning Duration
- 26 Jul 2023: Heat Advisory Duration
- 05 Oct 2021: Dense Fog Advisory Duration
- 22 Mar 2021: SWAW 2021: Severe Thunderstorm Watches
- 06 Aug 2019: Severe TStorm Watch Duration
- 23 Jun 2017: Severe Warning Duration
- 22 Jun 2015: Watch Duration