Which Variable(s) to Plot
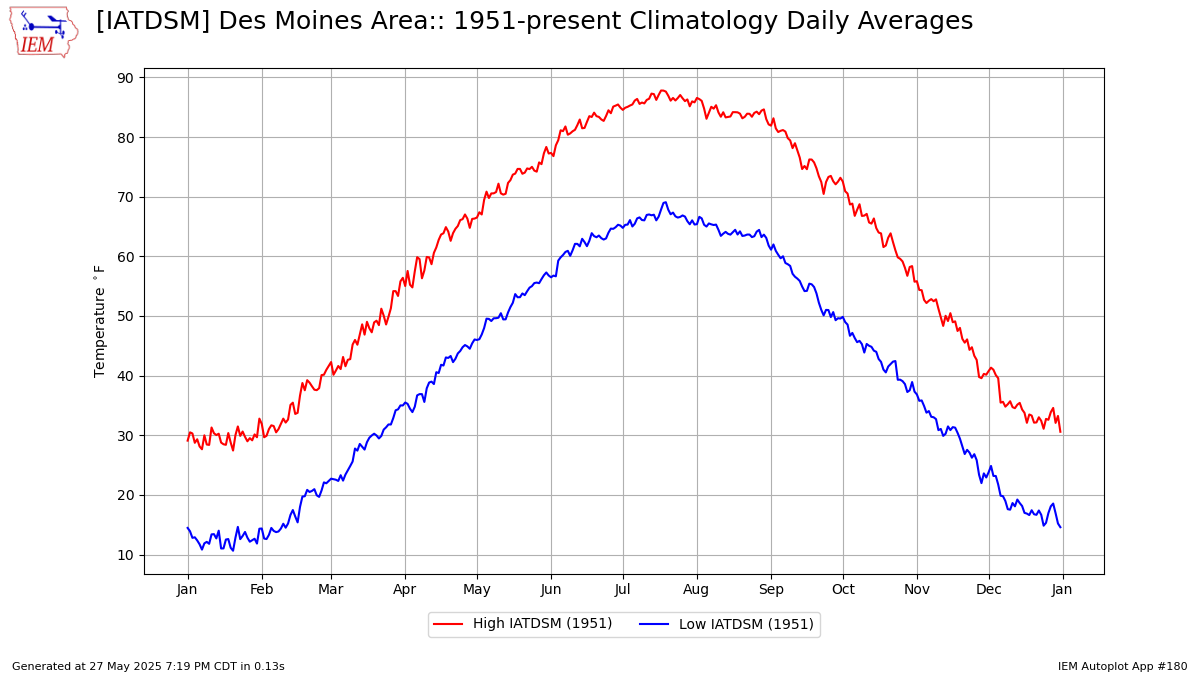
Plot High and Low Temperatures
Precipitation
Snowfall
Select First Station:
[ALCLIMATE] Alabama Long Term Climate Sites
[AKCLIMATE] Alaska Long Term Climate
[ASCLIMATE] American Somoa Long Term Climate Sites
[AZCLIMATE] Arizona Long Term Climate Sites
[ARCLIMATE] Arkansas Long Term Climate Sites
[CACLIMATE] California Long Term Climate Sites
[COCLIMATE] Colorado Long Term Climate Sites
[CTCLIMATE] Connecticut Long Term Climate Sites
[DECLIMATE] Delaware Long Term Climate Sites
[DCCLIMATE] District of Columbia Long Term Climate Sites
[FLCLIMATE] Florida Long Term Climate Sites
[GACLIMATE] Georgia Long Term Climate Sites
[GUCLIMATE] Guam Long Term Climate Sites
[HICLIMATE] Hawaii Long Term Climate
[IDCLIMATE] Idaho Long Term Climate Sites
[ILCLIMATE] Illinois Long Term Climate Sites
[INCLIMATE] Indiana Long Term Climate Sites
[IACLIMATE] Iowa Long Term Climate Sites
[KSCLIMATE] Kansas Long Term Climate Sites
[KYCLIMATE] Kentucky Long Term Climate Sites
[LACLIMATE] Louisiana Long Term Climate Sites
[MECLIMATE] Maine Long Term Climate Sites
[MDCLIMATE] Maryland Long Term Climate Sites
[MACLIMATE] Massachusetts Long Term Climate Sites
[MICLIMATE] Michigan Long Term Climate Sites
[MNCLIMATE] Minnesota Long Term Climate Sites
[MSCLIMATE] Mississippi Long Term Climate Sites
[MOCLIMATE] Missouri Long Term Climate Sites
[MTCLIMATE] Montana Long Term Climate Sites
[NECLIMATE] Nebraska Long Term Climate Sites
[NVCLIMATE] Nevada Long Term Climate Sites
[NHCLIMATE] New Hampshire Long Term Climate Sites
[NJCLIMATE] New Jersey Long Term Climate Sites
[NMCLIMATE] New Mexico Long Term Climate Sites
[NYCLIMATE] New York Long Term Climate Sites
[NCCLIMATE] North Carolina Long Term Climate Sites
[NDCLIMATE] North Dakota Long Term Climate Sites
[OHCLIMATE] Ohio Long Term Climate Sites
[OKCLIMATE] Oklahoma Long Term Climate Sites
[ORCLIMATE] Oregon Long Term Climate Sites
[PACLIMATE] Pennsylvania Long Term Climate Sites
[PRCLIMATE] Puerto Rico Long Term Climate
[RICLIMATE] Rhode Island Long Term Climate Sites
[SCCLIMATE] South Carolina Long Term Climate Sites
[SDCLIMATE] South Dakota Long Term Climate Sites
[TNCLIMATE] Tennessee Long Term Climate Sites
[TXCLIMATE] Texas Long Term Climate Sites
[UTCLIMATE] Utah Long Term Climate Sites
[VTCLIMATE] Vermont Long Term Climate Sites
[VACLIMATE] Virginia Long Term Climate Sites
[VICLIMATE] Virgin Islands Long Term Climate
[WACLIMATE] Washington Long Term Climate Sites
[WVCLIMATE] West Virginia Long Term Climate Sites
[WICLIMATE] Wisconsin Long Term Climate Sites
[WYCLIMATE] Wyoming Long Term Climate Sites
[IA0070] ADEL 1 SE [1958-07-01 till 1967-09-30]
[IA0064] AFTON [1894-01-01 till 1950-02-10]
[IA0088] AKRON [1900-09-01 till 2022-04-12]
[IA0089] AKRON 11E [2010-03-01 till 2013-01-28]
[IA0112] ALBIA [1894-01-01 till 2021-01-06]
[IA0116] ALBIA PASTURE IMP FARM [1956-01-01 till 1972-01-31]
[IA0133] ALGONA [1893-01-01 till now]
[IA0131] ALGONA 1NNW [2000-01-01 till 2017-12-20]
[IA0149] Allerton [1902-06-01 till now]
[IA0157] ALLISON [1914-02-01 till now]
[IA0173] ALTA [1893-01-01 till 1959-10-31]
[IA0175] ALTA NEAR [1896-03-01 till 1920-02-29]
[IA0181] ALTON [1905-05-01 till 2017-12-20]
[IA0187] ALTOONA 4W [2000-01-01 till 2017-03-29]
[IA0193] AMANA [1896-01-01 till 1915-03-31]
[IA0199] AMES 3 N [2010-01-01 till 2022-09-16]
[IA0205] AMES 3 SW [1893-01-01 till 1964-08-31]
[IA0203] AMES 5 SE [1900-01-01 till now]
[IA0200] AMES-8-WSW [1893-01-01 till now]
[IATAME] Ames Area [1893-01-01 till now]
[IA0209] AMES EXPERIMENT STATION [1893-01-01 till 1896-12-31]
[IA0197] AMES MUNICIPAL AP [1996-10-01 till now]
[IA0210] AMES SOUTHEAST [1897-01-01 till 1899-12-31]
[IA0213] ANAMOSA-1-WNW [1937-05-01 till 2014-01-05]
[IA0214] ANAMOSA 3 SSW [2011-08-01 till now]
[IA0220] ANAMOSA NO 2 [2001-01-01 till 2022-08-07]
[IA0241] Ankeny [1950-04-01 till 2021-11-05]
[IA0238] ANKENY 2 SE [2000-01-01 till 2017-03-29]
[IA0262] ANTHON [1942-07-01 till 1945-12-31]
[IA0364] ATLANTIC-1-NE [1893-01-01 till now]
[IA0366] ATLANTIC NEAR [1896-03-01 till 1897-09-30]
[IA0385] AUDUBON [1893-01-01 till now]
[IA0463] BANCROFT [1899-01-01 till 1954-10-12]
[IA0493] BARTLETT 5 E [1946-02-01 till 1972-03-31]
[IA0506] BATAVIA [1899-03-01 till 1901-02-28]
[IA0512] BATTLE CREEK 3NE [2009-09-01 till now]
[IA0513] BAXTER [1899-04-01 till 1939-12-31]
[IA0519] BAYARD 6 SE [2000-01-01 till 2017-12-20]
[IA0536] BEACONSFIELD [1951-05-01 till now]
[IA0549] BEAVER 2 NE [1948-01-01 till 1951-06-17]
[IA0576] BEDFORD-1-NNW [1898-09-01 till 2018-09-22]
[IA0596] BELKNAP [1896-01-01 till 1904-10-31]
[IA0600] BELLE-PLAINE [1893-01-01 till now]
[IA0602] BELLE PLAINE 3 S [2000-01-01 till 2017-12-20]
[IA0608] BELLEVUE-L-AND-D-12 [1937-05-01 till now]
[IA0612] BELMOND [1909-12-01 till 1946-01-31]
[IA0745] BLOCKTON 1W [1893-01-01 till 2018-07-05]
[IA0753] BLOOMFIELD [1906-08-01 till 2022-12-31]
[IA0793] BONAPARTE 5 NE [1893-01-01 till 1939-03-31]
[IA0807] Boone [1904-12-01 till now]
[IA0812] BOONE 3 WNW [1922-01-01 till 1946-07-31]
[IA0910] BRIGHTON [1968-01-01 till 2021-07-06]
[IA0923] BRITT [1897-01-01 till 2020-12-31]
[IA0933] BROOKLYN [1976-01-01 till 2023-10-02]
[IA0940] BRUNSVILLE [2010-03-01 till 2011-08-31]
[IA0999] BUCKEYE [1973-01-01 till 2010-09-18]
[IA1005] BUCKINGHAM [1899-07-01 till 1913-03-31]
[IA1060] BURLINGTON [1964-12-01 till now]
[IA1063] Burlington Airport [1897-07-01 till now]
[IA1099] BUSSEY 3 WNW [1899-04-01 till 2017-12-20]
[IA1126] CALMAR NE [2006-01-01 till 2022-12-31]
[IA1233] CARROLL-2-SSW [1893-01-01 till now]
[IA1245] CARSON 3NNE [1899-04-01 till 1951-09-30]
[IA1257] CASCADE [1942-01-01 till now]
[IA1277] CASTANA-EXP-FARM [1948-04-01 till 2018-01-16]
[IA1300] CEDAR FALLS [1893-01-01 till 2021-08-31]
[IA1319] CEDAR-RAPIDS-1 [1892-01-01 till now]
[IA1324] CEDAR RAPIDS 2 [1904-01-01 till 1966-06-30]
[IA1314] Cedar Rapids Airport [1953-06-01 till now]
[IATCID] Cedar Rapids Area [1893-01-01 till now]
[IA1354] CENTERVILLE [1893-01-01 till now]
[IA1358] CENTERVILLE 5 E [1973-01-01 till 1980-07-27]
[IA1363] CENTRAL CITY [2000-01-01 till 2022-12-31]
[IA1394] CHARITON [1895-02-01 till now]
[IA1398] CHARITON 5SSE [1970-01-01 till 2012-10-27]
[IA1402] CHARLES-CITY [1893-01-01 till now]
[IA1407] CHARLES CITY NO 2 [2000-01-01 till 2017-12-20]
[IA1442] CHEROKEE [1921-11-01 till now]
[IA1443] CHEROKEE # 2 [2000-01-01 till 2008-09-24]
[IA1461] CHESTER [1902-04-01 till 1903-07-31]
[IA1472] CHILLICOTHE [1899-03-01 till 1900-05-31]
[IA1528] CLARENCE [1934-01-01 till 1978-06-30]
[IA1533] CLARINDA [1893-01-01 till now]
[IA1535] CLARINDA 1 E [2000-01-01 till 2017-12-20]
[IA1536] CLARINDA PLUM CREEK [1934-01-01 till 1942-11-30]
[IA1537] CLARINDA TARKIO CREEK [1934-01-01 till 1942-11-30]
[IA1538] CLARINDA WALNUT CREEK [1934-01-01 till 1942-11-30]
[IA1541] CLARION [1944-01-01 till 2021-12-31]
[IA1586] CLEAR LAKE [1898-04-01 till 1913-04-30]
[IA1610] CLERMONT [2000-01-01 till 2016-09-22]
[IA1635] CLINTON-1 [1893-01-01 till now]
[IA1640] CLINTON 2 [1904-07-01 till 1985-10-31]
[IA1651] CLIO 4 NW [1992-01-01 till 1997-09-30]
[IA1704] CLUTIER [1973-01-01 till 2022-12-31]
[IA1705] COGGON [2000-01-01 till 2021-11-30]
[IA1708] COLLEGE SPRINGS [1896-03-01 till 1907-02-28]
[IA1710] COLO [1964-09-01 till 2010-12-26]
[IA1724] COLUMBIA [2000-01-01 till 2022-12-31]
[IA1731] COLUMBUS JUNCT 2 SSW [1900-10-01 till now]
[IA1737] CONESVILLE 3 NE [2000-01-01 till 2017-05-17]
[IA1742] CONRAD [1977-01-01 till 2020-09-02]
[IA1793] COON RAPIDS [1899-03-01 till 2022-12-31]
[IA1823] CORALVILLE [2000-01-01 till 2017-12-20]
[IA1828] CORALVILLE DAM [1983-01-01 till 2017-12-20]
[IA1833] CORNING [1893-01-01 till now]
[IA1838] CORRECTIONVILLE 1 SW [1942-01-01 till 2016-04-26]
[IA1848] CORYDON 8 W [1903-02-01 till 1991-08-31]
[IA1889] COUNCIL BLUFFS 6 NE [1893-07-01 till 1965-07-31]
[IA1888] COUNCIL BLUFFS 6 NNE [1948-04-01 till 1951-09-30]
[IA1954] CRESCO-1-NE [1893-01-01 till 2020-12-31]
[IA1962] Creston [1905-04-01 till now]
[IA2007] CUMBERLAND [1899-03-01 till 1978-10-31]
[IA2026] CUSHING [1934-01-01 till 1950-11-30]
[IA2041] Dakota City [2000-01-01 till 2023-09-05]
[IA2055] DALLAS 2 NW [2000-01-01 till 2017-12-20]
[IA2062] DANVILLE [1899-03-01 till 1903-08-31]
[IA2068] DAVENPORT [1896-01-01 till 1948-03-31]
[IA2071] DAVENPORT 2 [1922-09-01 till 1929-08-31]
[IA2069] DAVENPORT LOCK & DAM 15 [1953-03-01 till 1984-05-31]
[IA2070] DAVENPORT WFO [2011-06-01 till now]
[IA2117] DECORAH 2 [2007-01-01 till 2016-07-23]
[IA2110] DECORAH-2-N [1893-01-01 till now]
[IA2112] DECORAH 2 S [1896-01-01 till 1950-10-31]
[IA2136] DELAWARE 3 WSW [1893-01-01 till 1975-12-31]
[IA2171] DENISON [1893-01-01 till now]
[IA2173] DENISON SCS [1942-07-01 till 1945-02-28]
[IA2195] DERBY [1948-01-01 till 2005-07-26]
[IA2199] DES MOINES (63RD STREET) [2005-01-01 till 2012-05-02]
[IA2203] Des Moines Airport [1878-08-01 till now]
[IATDSM] Des Moines Area [1878-08-01 till now]
[IA2210] DES MOINES MILLMAN [1896-03-01 till 1898-10-31]
[IA2208] Des Moines SE 6th [1878-08-01 till 1973-12-31]
[IA2201] DES MOINES SNOW [2004-08-01 till 2022-12-31]
[IA2209] DES MOINES WSFO-JOHNSTON [1995-01-01 till now]
[IA2212] DE SOTO [1897-11-01 till 1910-11-30]
[IA2235] DE WITT [1954-09-01 till 2022-12-31]
[IA2236] DE WITT 4 S [2000-01-01 till 2022-04-12]
[IA2240] DEXTER [1935-07-01 till 1951-09-30]
[IA2299] Donnellson [1938-01-01 till now]
[IA2311] DORCHESTER [1947-01-01 till 2013-12-12]
[IA2315] DORCHESTER HWY 76 [2000-01-01 till 2017-12-20]
[IA2355] DOWS [1896-01-01 till 1909-12-31]
[IA2362] DUBUQUE #3 [2011-08-01 till 2022-12-31]
[IA2367] Dubuque Airport [1951-02-01 till now]
[IATDBQ] Dubuque Area [1873-07-01 till now]
[IA2364] DUBUQUE-LOCK-AND-DAM [1873-07-01 till now]
[IA2361] DUBUQUE NO 2 [2000-01-01 till 2017-12-20]
[IA2369] DUBUQUE RIVER [1873-07-01 till 1952-01-31]
[IA2388] DUMONT [1934-01-01 till 2011-08-06]
[IA2396] DUNBAR 2 NE [1934-03-01 till 1958-07-31]
[IA2410] DURANGO 3W [2000-01-01 till 2006-11-30]
[IA2456] EARLHAM [1902-03-01 till 1931-04-30]
[IA2541] EDDYVILLE [1939-01-01 till 1984-07-31]
[IA2544] EDDYVILLE NO 2 [2000-01-01 till 2017-12-20]
[IA2555] ELBERON 3 S [2000-01-01 till 2017-12-20]
[IA2569] ELDON [1898-04-01 till 1903-04-30]
[IA2573] Eldora [1896-02-01 till 2023-05-02]
[IA2595] ELKADER 1 SE [2000-01-01 till 2017-12-20]
[IA2603] Elkader 6SSW (Osborn) [1893-01-01 till now]
[IA2630] ELLIOTT [1905-03-01 till 1915-10-31]
[IA2638] ELMA [2003-01-01 till 2022-12-31]
[IA2678] EMERSON 4 ENE [1899-03-01 till 1971-12-31]
[IA2689] Emmetsburg [1893-01-01 till now]
[IA2697] EMMETSBURG 2 NW [2000-01-01 till 2017-12-20]
[IA2726] ESTHERVILLE 1WSW [2000-01-01 till 2017-12-20]
[IA2724] Estherville 4E [1893-01-01 till now]
[IA2725] ESTHERVILLE MUNICIPAL AP [1996-07-01 till now]
[IA2755] EVERLY 3 WNW [1954-01-01 till 2022-12-31]
[IA2778] FAIRBANK [2000-01-01 till 2008-01-31]
[IA2789] FAIRFIELD [1893-01-01 till now]
[IA2805] FAIRPORT [1921-03-01 till 1941-11-30]
[IA2864] FAYETTE [1893-01-01 till now]
[IA2896] FLORENCE [1904-04-01 till 1905-12-31]
[IA2960] FONDA [1896-06-01 till 1902-05-31]
[IA2977] FOREST-CITY [1894-03-01 till now]
[IA2999] FORT-DODGE [1899-01-01 till now]
[IA3003] FORT DODGE 4 NW [2000-01-01 till 2017-12-20]
[IA3007] Fort Madison [1893-01-01 till now]
[IA3019] FREDERICKSBURG [1897-04-01 till 1898-11-30]
[IA3022] FRUITLAND [1900-12-01 till 1938-10-31]
[IA3032] FULTON [2000-01-01 till 2020-06-30]
[IA3108] GALVA [1896-01-01 till 2010-08-24]
[IA3107] GALVA [1893-08-01 till 1917-11-30]
[IA3113] GARBER [2000-01-01 till 2017-12-20]
[IA3115] GARDEN GROVE [1896-01-01 till 1899-03-31]
[IA3120] GARWIN [1977-01-01 till 2022-12-31]
[IA3239] GILMAN [1899-04-01 till 2018-04-18]
[IA3278] GLADBROOK [1897-02-01 till 1899-12-31]
[IA3288] GLENWOOD [2000-07-01 till 2018-07-23]
[IA3290] GLENWOOD [1893-01-01 till 2008-11-30]
[IA3293] GLENWOOD 5 ESE [1895-05-01 till 1970-03-17]
[IA3295] GLENWOOD 8 SSE [1946-02-01 till 1972-03-31]
[IA3434] GREENE [1897-02-01 till 1910-12-31]
[IA3438] GREENFIELD [1893-01-01 till now]
[IA3455] GRIMES 3 E [2000-01-01 till 2017-12-20]
[IA3459] GRIMES 4 WSW [2000-01-01 till 2016-02-07]
[IA3473] GRINNELL-3-SW [1893-01-01 till now]
[IA3475] GRINNELL NEAR [1899-02-01 till 1906-03-31]
[IA3487] GRUNDY-CENTER [1893-01-01 till now]
[IA3509] GUTHRIE-CENTER [1895-01-01 till now]
[IA3517] GUTTENBERG-L-AND-D-10 [1937-05-01 till now]
[IA3567] HAMBURG [1972-01-01 till 1976-10-30]
[IA3562] HAMBURG [1899-03-01 till 2008-09-13]
[IA3569] HAMBURG 2 NE [2000-01-01 till 2017-12-20]
[IA3584] HAMPTON-2-NW [1893-01-01 till now]
[IA3589] HANCOCK [1905-06-01 till 2017-12-20]
[IA3590] HANCOCK 7SE [2006-01-01 till 2008-10-09]
[IA3600] HANLONTOWN [1902-10-01 till 1906-07-31]
[IA3623] HARCOURT 2ENE [1976-01-01 till 2019-01-26]
[IA3632] HARLAN [1899-02-01 till 2020-12-31]
[IA3667] HARTLEY 3 S [1945-01-01 till 1950-09-14]
[IA3671] HARTWICK 4NW [2000-01-01 till 2017-12-20]
[IA3675] HASTINGS 4NE [2008-01-01 till 2022-12-31]
[IA3681] HAVEN 1 NE [2000-01-01 till 2017-12-20]
[IA3712] HAVERHILL [1971-01-01 till 1994-12-31]
[IA3718] HAWARDEN [1926-08-01 till 2020-03-31]
[IA3731] HAWKEYE [1896-01-01 till 1901-08-31]
[IA3819] HEDRICK [1897-07-01 till 1901-03-31]
[IA3877] HINTON 4 W [1948-01-01 till 1951-09-30]
[IA3909] Holstein [1951-01-01 till 2020-12-31]
[IA3910] HOLSTEIN 5 NNW [2019-01-01 till now]
[IA3933] HOPEVILLE [1896-01-01 till 1910-12-31]
[IA3946] HORNICK 1 E [2003-01-01 till 2015-11-29]
[IA3900] HORNICK 4 NNE [1964-01-01 till 2022-12-31]
[IA3944] HORNICK 5S [1948-01-01 till 1951-09-30]
[IA3960] HUBBARD [1973-01-01 till 2017-12-28]
[IA3964] HUDSON [2000-06-01 till 2019-11-30]
[IA3985] HUMBOLDT 2 [1987-04-01 till 1997-06-30]
[IA3980] HUMBOLDT-2 [1895-01-01 till 2022-12-31]
[IA4038] IDA GROVE 5NW [1902-01-01 till 2007-12-31]
[IATIDA] Ida Grove Area [1902-10-01 till now]
[IA4052] INDEPENDENCE [1893-01-01 till 2017-12-20]
[IA4049] INDEPENDENCE-2-W [1867-01-01 till 2009-12-31]
[IA4063] INDIANOLA-2-SSW [1893-01-01 till 2022-12-31]
[IA4067] INDIANOLA 5 NNW [1942-09-01 till 2017-05-23]
[IA4087] INWOOD 2 SW [1902-05-01 till 1973-01-31]
[IA4094] IONIA 2 W [2002-01-01 till 2022-12-31]
[IA0000] Iowa Average [1893-01-01 till now]
[IAC005] Iowa - Central Climate Division [1893-01-01 till now]
[IA4101] Iowa City [1893-01-01 till now]
[IA4102] IOWA CITY 2 [2000-01-01 till 2017-12-20]
[IA4139] IOWA CITY 5 SW [2000-01-01 till 2014-04-16]
[IA4109] IOWA CITY (MRS HOBBY) [1896-01-01 till 1897-12-31]
[IA4106] IOWA CITY MUNICIPAL AP [1944-08-01 till now]
[IA4111] IOWA CITY RALSTON CREEK [1948-08-01 till 1951-09-30]
[IA4126] IOWA CITY RALSTON CREEK [1948-01-01 till 1951-09-30]
[IA4121] IOWA CITY RALSTON CREEK [1948-01-01 till 1951-09-30]
[IA4131] IOWA CITY RALSTON CREEK [1948-08-01 till 1951-09-30]
[IA4116] IOWA CITY RALSTON CREEK [1948-08-01 till 1951-09-30]
[IAD001] Iowa Drought Region 1 - Northwest [1893-01-01 till now]
[IAD002] Iowa Drought Region 2 - Northcentral [1893-01-01 till now]
[IAD003] Iowa Drought Region 3 - Northeast [1893-01-01 till now]
[IAD004] Iowa Drought Region 4 - Southwest [1893-01-01 till now]
[IAD005] Iowa Drought Region 5 - Southeast [1893-01-01 till now]
[IAC006] Iowa - East Central Climate Division [1893-01-01 till now]
[IA4142] IOWA-FALLS [1893-01-01 till now]
[IAC002] Iowa - North Central Climate Division [1893-01-01 till now]
[IAC003] Iowa - Northeast Climate Division [1893-01-01 till now]
[IAC001] Iowa - Northwest Climate Division [1893-01-01 till now]
[IAC008] Iowa - South Central Climate Division [1893-01-01 till now]
[IAC009] Iowa - Southeast Climate Division [1893-01-01 till now]
[IAC007] Iowa - Southwest Climate Division [1893-01-01 till now]
[IAC004] Iowa - West Central Climate Division [1893-01-01 till now]
[IA4174] IRWIN 3 ESE [1950-09-01 till 2008-06-08]
[IA4202] JAMES 1 NE [1948-04-01 till 2017-12-20]
[IA4228] JEFFERSON [1893-01-01 till now]
[IA4229] JEFFERSON 2 S [2000-01-01 till 2022-12-31]
[IA4244] JEWELL [1949-03-01 till 2018-02-09]
[IA4280] KALONA 1 SSW [2000-01-01 till 2015-04-09]
[IA4308] KANAWHA [1941-08-01 till 2022-12-31]
[IA4342] KENNEBEC [1950-05-01 till 2018-09-30]
[IA4376] KEOKUK LOCK & DAM 19 [1937-05-01 till 1953-02-28]
[IA4381] KEOKUK LOCK DAM 19 [1891-01-01 till now]
[IA4372] KEOKUK NO 2 [1929-03-01 till 1939-03-31]
[IA4389] KEOSAUQUA [1893-01-01 till now]
[IA4394] KEOSAUQUA 2 [1936-01-01 till 1976-06-30]
[IA4402] KESLEY [2000-01-01 till 2022-12-31]
[IA4433] KILLDUFF [1975-01-01 till 1984-11-26]
[IA4502] KNOXVILLE [1893-01-01 till 2023-11-28]
[IA4507] KNOXVILLE 3E [2000-01-01 till 2015-09-17]
[IA4523] LACONA [1899-04-01 till 1937-10-31]
[IA4529] LADORA [2000-01-01 till 2017-06-15]
[IA4547] LAKE CITY [1936-04-01 till 1972-10-31]
[IA4557] LAKE MILLS [1955-04-01 till 2022-12-31]
[IA4561] LAKE PARK [1912-08-01 till 2022-12-31]
[IA4569] LAKE VIEW [1938-08-01 till 1962-09-30]
[IA4585] Lamoni [1897-08-01 till now]
[IA4587] LAMONI [1998-01-01 till now]
[IA4620] LANSING [1896-06-01 till 2004-06-22]
[IA4624] LANSING 4SE [2003-04-01 till 2013-06-14]
[IA4637] LARCHWOOD [1896-09-01 till 1903-11-30]
[IA4644] LARRABEE [1893-01-01 till 1951-09-30]
[IA4700] LE CLAIRE [1893-01-01 till 1955-06-30]
[IA4705] Le Claire L&D 14 [1938-02-01 till now]
[IA4735] Le Mars [1896-01-01 till now]
[IA4746] LENOX [1895-05-01 till 1951-09-30]
[IA4758] LEON 6 ESE [1902-04-01 till 2012-10-11]
[IA4820] LINN GROVE [2003-01-01 till 2017-12-20]
[IA4867] LITTLE SIOUX [1904-08-01 till 1949-03-31]
[IA4874] LITTLE SIOUX 2NW [2000-01-01 till now]
[IA4894] LOGAN [1893-01-01 till now]
[IA4898] LOGAN NO 2 [1942-07-01 till 2009-12-31]
[IA4912] LONE TREE 5 SW [2000-01-01 till 2014-06-03]
[IA4926] LORIMOR [1950-01-01 till 2020-10-31]
[IA4963] LOWDEN [1991-01-01 till now]
[IA5000] MADRID [1895-04-01 till 1941-12-31]
[IA5085] MANCHESTER [1987-01-01 till 1994-12-31]
[IA5086] MANCHESTER-2 [1921-09-01 till now]
[IA5127] MAPLETON [1948-01-01 till 2017-12-20]
[IA5123] MAPLETON NO. 2 [1937-11-01 till now]
[IA5132] MAQUOKETA 2 NE [2000-01-01 till 2011-05-31]
[IA5131] MAQUOKETA-2-W [1896-01-01 till now]
[IA5136] MARATHON [1926-10-01 till 1939-03-31]
[IA5141] MARBLE ROCK [1954-04-01 till 1998-09-30]
[IA5150] MARENGO [2000-01-01 till 2022-12-31]
[IA5163] MARION 4 NE [1948-01-01 till 1951-09-30]
[IA5198] MARSHALLTOWN [1893-01-01 till now]
[IA5193] MARSHALLTOWN 1 [1948-04-01 till 1949-05-31]
[IA5206] MARSHALLTOWN #2 [1948-01-01 till 1949-12-31]
[IA5200] MARSHALLTOWN 4 SE [2000-01-01 till 2017-12-20]
[IA5199] MARSHALLTOWN MUNICIPAL AP [1996-10-01 till now]
[IA5230] Mason City [1893-01-01 till now]
[IA5232] MASON CITY #1 [2000-08-01 till 2019-01-28]
[IATMCW] Mason City Area [1893-01-01 till now]
[IA5235] MASON CITY MUNICIPAL AP [1942-07-01 till now]
[IA5250] MASSENA [1904-06-01 till 2022-12-31]
[IA5270] MATLOCK [1916-04-01 till 1918-01-31]
[IA5290] MAXON [1893-01-01 till 1896-09-30]
[IA5295] MAXWELL [2000-01-01 till 2022-12-31]
[IA5315] MCGREGOR [1957-01-01 till 1969-07-28]
[IA5320] MCGREGOR NO 2 [2000-01-01 till 2014-04-27]
[IA5341] MECHANICSVILLE [1896-01-01 till 1896-12-31]
[IA5383] MELROSE [1899-02-01 till 1946-08-31]
[IA5414] MERRILL [1907-05-01 till 2006-09-23]
[IA5418] MERRILL 4 WSW [1907-05-01 till 1977-12-31]
[IA5493] Milford [1919-10-01 till now]
[IA5496] MILFORD 3 W [2000-01-01 till 2010-04-23]
[IA5517] MILLERTON [1893-05-01 till 1951-02-28]
[IA5552] MINEOLA 5 NW [1996-11-01 till 2002-12-31]
[IA5584] MISSOURI VALLEY 1 NNE [1940-09-01 till 1956-05-31]
[IA5608] MONDAMIN [1942-01-01 till 1948-08-31]
[IA5622] MONMOUTH 4 SW [1940-07-01 till 1953-04-30]
[IA5630] MONONA [1948-01-01 till 1951-09-30]
[IA5638] MONROE [1911-08-01 till 1948-10-31]
[IA5650] MONTEZUMA 1 W [1896-07-01 till 2022-12-31]
[IA5669] MONTICELLO [1896-01-01 till 2022-12-20]
[IA5664] MONTICELLO [1893-01-01 till 1906-01-31]
[IA5680] MOOAR [1896-05-01 till 1901-09-30]
[IA5732] MORSE [1948-01-01 till 1951-09-30]
[IA5737] MORSE 1 NE [1948-01-01 till 1951-09-30]
[IA5742] MORSE 4 SSW [1948-01-01 till 1951-09-30]
[IA5750] MOULTON 5 W [2000-01-01 till 2017-12-20]
[IA5769] MOUNT-AYR [1893-01-01 till now]
[IA5796] MOUNT-PLEASANT [1893-01-01 till now]
[IA5813] MOUNT VERNON [1897-01-01 till 1907-09-30]
[IA5811] MOUNT VERNON [1896-06-01 till 1900-05-31]
[IA5823] MOVILLE [1948-01-01 till 1951-09-30]
[IA5834] MURRAY [1893-01-01 till 1921-05-31]
[IA5837] MUSCATINE [1935-01-01 till now]
[IA5842] MUSCATINE 2 [1895-01-01 till 2017-12-20]
[IA5844] MUSCATINE 2N [1999-01-01 till now]
[IA5847] MUSCATINE 6 N [1948-01-01 till 1950-02-22]
[IA5872] NASHUA 2 NW [1949-01-01 till 1951-08-31]
[IA5876] NASHUA 2 SW [2001-01-01 till 2022-12-31]
[IA5880] NEOLA [1896-01-01 till 1899-01-31]
[IA5882] NEVADA [1905-07-01 till 1907-09-30]
[IA5952] NEW-HAMPTON [1897-01-01 till now]
[IA5992] NEWTON [1893-01-01 till now]
[IA6044] NORA SPRINGS [1912-10-01 till 1926-12-31]
[IA6062] NORTHBORO [1899-03-01 till 1919-09-30]
[IA6076] NORTH ENGLISH [1948-01-01 till 2022-12-31]
[IA6086] NORTH MCGREGOR [1896-03-01 till 1898-08-31]
[IA6103] NORTHWOOD [1896-04-01 till now]
[IA6119] NORWICH EXPERIMENT FARM [1937-09-01 till 1970-03-31]
[IA6151] OAKLAND-2-E [1919-01-01 till now]
[IA6160] OAKLAND MILLS 3 W [1991-01-01 till 2017-12-20]
[IA6186] OASIS 1 NW [1948-01-01 till 1951-09-30]
[IA6190] OCHEYEDAN [1967-01-01 till 2013-06-30]
[IA6196] ODEBOLT [1897-02-01 till 1914-11-30]
[IA6195] ODEBOLT 2 [1897-02-01 till 1963-12-31]
[IA6199] OELWEIN 1E [2005-10-01 till now]
[IA6200] OELWEIN-2-S [1923-05-01 till 2005-11-17]
[IATOEL] Oelwein Area [1955-01-01 till now]
[IA6209] OGDEN [2000-01-01 till 2022-12-31]
[IA6205] OGDEN [1894-07-01 till 1959-09-30]
[IA6225] OLIN [1898-01-01 till 1941-06-30]
[IA6243] ONAWA [1899-01-01 till 2011-11-15]
[IA6273] ORANGE CITY [2010-06-01 till 2022-12-31]
[IA6291] ORLEANS [1934-11-01 till 1939-01-31]
[IA6305] OSAGE [1893-01-01 till now]
[IA6316] OSCEOLA-3-WSW [1894-01-01 till now]
[IA6327] OSKALOOSA [1893-01-01 till now]
[IA6335] OSKALOOSA 4 N [2000-01-01 till 2017-12-20]
[IA6363] OTO [1942-07-01 till 1954-11-30]
[IA6389] Ottumwa [1896-01-01 till now]
[IA6396] OTTUMWA [2000-01-01 till 2017-12-20]
[IA6391] OTTUMWA [1917-01-01 till 1964-12-31]
[IA6392] OTTUMWA #1 [2000-08-01 till now]
[IA6386] OTTUMWA 1 WSW [1894-01-01 till 1949-11-04]
[IA6412] OVID [1896-01-01 till 1903-01-31]
[IA6419] OXFORD JUNCTION 1 S [2004-01-01 till 2017-07-21]
[IA6440] PACIFIC JUNCTION [1899-03-01 till 1915-07-31]
[IA6418] PANORA [2000-01-01 till 2017-12-20]
[IA6492] PARKERSBURG [1951-09-01 till 2021-12-31]
[IA6520] PAULLINA [1954-01-01 till 1994-12-31]
[IA6527] PELLA 1S [1898-01-01 till 2022-12-31]
[IA6531] PELLA 4 WSW [2000-01-01 till 2012-06-20]
[IA6566] PERRY [1900-10-01 till now]
[IA6590] PETERSON [1942-07-01 till 2017-11-18]
[IA6618] PIONEER [1898-07-01 till 1900-10-31]
[IA6634] PISGAH [1950-09-01 till 2017-12-20]
[IA6698] PLOVER [1896-06-01 till 1912-06-12]
[IA6719] POCAHONTAS [1904-05-01 till now]
[IA6755] POPEJOY 1S [1974-01-01 till 2017-03-07]
[IA6760] PORTSMOUTH [1896-01-01 till 1898-04-20]
[IA6766] Postville [1893-01-01 till now]
[IA6800] PRIMGHAR [1895-04-01 till now]
[IA6820] PROMISE CITY 6 NW [1970-01-01 till 2013-11-30]
[IA6891] RANDOLPH [1953-03-01 till 2022-12-31]
[IA6895] RANDOLPH 1 W [2000-01-01 till 2017-12-20]
[IA6910] RATHBUN DAM [1970-01-01 till now]
[IA6941] READ OAK # 2 [1948-01-01 till 2017-12-20]
[IA6920] REDFIELD 2 E [1954-05-01 till 2022-12-31]
[IA6940] RED-OAK [1897-01-01 till now]
[IA6945] RED OAK 10 SW [1924-10-01 till 1948-07-31]
[IA6965] RED ROCK DAM [1984-01-01 till 1989-07-30]
[IA6969] REINBECK 2 W [1896-02-01 till 1897-08-31]
[IA6975] REMSEN [1948-01-01 till 1951-09-30]
[IA6976] REMSEN NO. 2 [2010-03-01 till 2022-12-31]
[IA6985] RHODES 3E [1972-01-01 till 2015-05-01]
[IA7035] RIDGEWAY [1898-03-01 till 1912-10-13]
[IA7058] RINGSTED [1948-01-01 till 2022-12-31]
[IA7085] RIVERTON [1926-04-01 till 1960-02-29]
[IA7147] ROCK-RAPIDS [1893-01-01 till now]
[IA7152] ROCK VALLEY [1977-01-01 till 2022-12-31]
[IA7161] ROCKWELL-CITY [1894-01-01 till now]
[IA7167] ROCKWELL CITY NO. 2 [2000-01-01 till 2022-12-19]
[IA7256] RUNNELLS 2SE [2000-01-01 till 2007-01-20]
[IA7289] RUTHVEN [1897-12-01 till 1904-11-30]
[IA7312] SAC-CITY [1893-01-01 till now]
[IA7363] SALEM 1 S [2011-06-01 till 2022-12-31]
[IA7386] SANBORN [1914-01-01 till now]
[IA7410] SARATOGA 2 E [1949-05-01 till 1968-02-29]
[IA7425] SAYLORVILLE 3WNW [2000-01-01 till 2017-12-20]
[IA7478] SCRANTON [1896-09-01 till 1903-07-31]
[IA7526] SEYMOUR [1896-01-01 till 1897-11-30]
[IA7572] SHEFFIELD 3 NW [1948-01-01 till 1951-09-30]
[IA7582] SHELBY [1950-10-01 till 2001-08-15]
[IA7594] Sheldon [1899-03-01 till 2022-12-31]
[IA7596] SHELDON 1 N [2000-01-01 till 2008-03-17]
[IA7602] SHELL ROCK 1 SW [1948-01-01 till 2016-09-22]
[IA7613] SHENANDOAH-1-NE [1918-06-01 till now]
[IA7664] SIBLEY-5-NNE [1893-01-01 till now]
[IA7669] SIDNEY [1895-01-01 till 2018-05-01]
[IA7678] SIGOURNEY [1896-01-01 till now]
[IA7683] SIGOURNEY 2 S [2000-01-01 till 2017-10-18]
[IA7700] SIOUX CENTER 2 SE [1899-05-01 till now]
[IA7712] SIOUX CITY [1889-05-01 till 1941-04-30]
[IA7703] SIOUX CITY 8 N [1946-02-01 till 1983-03-31]
[IA7702] SIOUX CITY ANG [2000-01-01 till now]
[IATSUX] Sioux City Area [1889-07-01 till now]
[IA7717] SIOUX CITY HWY 77 BRG [2015-01-01 till 2021-10-28]
[IA7713] SIOUX CITY PERRY CREEK [1946-02-01 till 2016-04-26]
[IA7708] SIOUX-CITY-WSO-AP [1889-07-01 till now]
[IA7726] SIOUX-RAPIDS [1941-06-01 till now]
[IA7738] SLOAN [1942-01-01 till 1949-02-28]
[IA7774] SOLDIER [1948-01-01 till 1951-09-30]
[IA7844] Spencer [1895-02-01 till now]
[IA7840] SPENCER [2002-01-01 till 2013-04-17]
[IAKSPW] Spencer Airport [1996-01-01 till now]
[IATSPW] Spencer Area [1895-02-01 till now]
[IA7847] SPENCER NO. 2 [1988-01-01 till 2016-08-11]
[IA7855] SPILLVILLE [1948-01-01 till 2004-09-06]
[IA7859] SPIRIT LAKE [1893-01-01 till now]
[IA7887] STACEYVILLE [1941-06-01 till 1942-08-08]
[IA7892] STANLEY [2006-01-01 till now]
[IA7326] ST ANSGAR [1948-01-01 till 2022-12-31]
[IA8646] STANTON 4N [1948-08-01 till 1951-09-30]
[IA7925] STATE CENTER [1937-01-01 till 1951-06-30]
[IA7340] ST CHARLES [1896-08-01 till 1951-09-30]
[IA7932] STEAMBOAT ROCK [1956-01-01 till 2022-12-31]
[IA7955] STOCKPORT [1901-09-01 till 1948-02-29]
[IA7979] STORM-LAKE-2-E [1893-01-01 till now]
[IA7985] STORY CITY [2000-01-01 till 2022-12-31]
[IA8009] STRAWBERRY POINT [1948-01-01 till 2022-12-31]
[IA8021] STUART [1896-04-01 till 1910-11-30]
[IA8026] SWEA CITY 4 W [1954-10-01 till now]
[IA8062] SWISHER #2 [1998-01-01 till 2022-12-31]
[IA8131] TABOR 6 NNW [1948-01-01 till 1951-09-30]
[IA8147] TARA [1897-12-01 till 1899-09-30]
[IA8169] TERRIL [1942-07-01 till 1944-01-31]
[IA8231] THURMAN [1897-06-01 till 1948-11-30]
[IA8255] TINGLEY [1924-03-01 till 1956-06-30]
[IA8266] TIPTON [1893-01-01 till 2009-12-31]
[IA8270] TITONKA [1949-12-01 till 2009-01-31]
[IA8296] TOLEDO [1894-01-01 till now]
[IA8307] TRACY 1 NE [1881-09-01 till 2017-12-20]
[IA8315] TRAER [1948-01-01 till 2022-12-31]
[IA8341] TRIPOLI 2N [2003-01-01 till 2022-08-27]
[IA8339] TRIPOLI-4-N [1946-09-01 till 2021-08-30]
[IA8359] TURIN 4S [1972-01-01 till 2017-12-20]
[IA8360] TURIN 4 SSW [1972-07-01 till 2017-12-15]
[IA8410] UNDERWOOD [2002-10-01 till 2022-12-31]
[IA8538] VILLISCA [1896-01-01 till 1904-02-29]
[IA8540] VILLISCA NO. 2 [2000-05-01 till 2011-01-09]
[IA8568] VINTON [1893-01-01 till now]
[IA8632] WALFORD 2 SE [1904-01-01 till 2012-03-22]
[IA8668] Wapello [1898-07-01 till 2018-03-18]
[IA8688] WASHINGTON [1893-01-01 till now]
[IA8693] WASHTA [1897-05-01 till 2019-04-22]
[IA8706] WATERLOO [1894-01-01 till now]
[IA8704] WATERLOO [1895-01-01 till 1950-02-28]
[IA8705] WATERLOO #1 [1997-07-01 till 2008-02-26]
[IATALO] Waterloo Area [1895-01-01 till now]
[IA8707] WATERLOO SNOW [2012-01-01 till 2022-12-31]
[IA8742] WAUCOMA 1WNW [1954-11-01 till 2022-12-31]
[IA8747] WAUKEE [1894-10-01 till 1953-03-31]
[IA8658] WAUKEE 3NE [2009-01-01 till 2016-08-01]
[IA8755] WAUKON [1934-01-01 till now]
[IA8756] WAUKON 4SW [2017-11-01 till 2019-10-10]
[IA8771] WAVERLY [1896-01-01 till 1946-08-31]
[IA8806] WEBSTER-CITY [1893-01-01 till now]
[IA8843] WESCOTT [1922-03-01 till 1927-08-31]
[IA8852] WEST BEND [1893-04-01 till 1946-10-31]
[IA8856] WEST BRANCH [1897-07-01 till 1903-06-30]
[IA8860] WEST DES MOINES 6 W [2004-01-01 till 2014-07-03]
[IA8880] WEST UNION [1898-12-01 till 1904-06-30]
[IA8867] WEST UNION 3SE [2002-09-01 till 2013-04-23]
[IA8870] WEST UNION 5 NW [2000-01-01 till 2003-01-29]
[IA8974] WEVER [1928-04-01 till 1931-11-30]
[IA8985] WHAT CHEER [1898-10-01 till 1905-02-28]
[IA8989] WHEATLAND [1948-01-01 till 1951-09-30]
[IA9000] WHITTEN [1897-05-01 till 1920-08-31]
[IA9062] WILLIAMS [1978-01-01 till 2007-01-05]
[IA9067] WILLIAMSBURG [1893-01-01 till now]
[IA9095] WILTON JUNCTION [1896-01-01 till 1909-12-31]
[IA9132] WINTERSET [1893-01-01 till now]
[IA9164] WOODBINE [1942-01-01 till 1951-08-11]
[IA9168] WOODBURN [1899-03-01 till 1912-01-31]
[IA9178] WOODWARD 7 N [1944-09-01 till 1974-04-30]
[IA9750] ZEARING [1904-04-01 till 2022-12-31]
Show Map
Click dot to select in form above.
Key
Online
Offline
Climatology Source for First Station:
Period of Record (por) Climatology
1951-present Climatology
NCEI 1981-2010 Climatology
NCEI 1991-2020 Climatology
Custom Climatology (pick years)
Select Second Station (Optional):
[ALCLIMATE] Alabama Long Term Climate Sites
[AKCLIMATE] Alaska Long Term Climate
[ASCLIMATE] American Somoa Long Term Climate Sites
[AZCLIMATE] Arizona Long Term Climate Sites
[ARCLIMATE] Arkansas Long Term Climate Sites
[CACLIMATE] California Long Term Climate Sites
[COCLIMATE] Colorado Long Term Climate Sites
[CTCLIMATE] Connecticut Long Term Climate Sites
[DECLIMATE] Delaware Long Term Climate Sites
[DCCLIMATE] District of Columbia Long Term Climate Sites
[FLCLIMATE] Florida Long Term Climate Sites
[GACLIMATE] Georgia Long Term Climate Sites
[GUCLIMATE] Guam Long Term Climate Sites
[HICLIMATE] Hawaii Long Term Climate
[IDCLIMATE] Idaho Long Term Climate Sites
[ILCLIMATE] Illinois Long Term Climate Sites
[INCLIMATE] Indiana Long Term Climate Sites
[IACLIMATE] Iowa Long Term Climate Sites
[KSCLIMATE] Kansas Long Term Climate Sites
[KYCLIMATE] Kentucky Long Term Climate Sites
[LACLIMATE] Louisiana Long Term Climate Sites
[MECLIMATE] Maine Long Term Climate Sites
[MDCLIMATE] Maryland Long Term Climate Sites
[MACLIMATE] Massachusetts Long Term Climate Sites
[MICLIMATE] Michigan Long Term Climate Sites
[MNCLIMATE] Minnesota Long Term Climate Sites
[MSCLIMATE] Mississippi Long Term Climate Sites
[MOCLIMATE] Missouri Long Term Climate Sites
[MTCLIMATE] Montana Long Term Climate Sites
[NECLIMATE] Nebraska Long Term Climate Sites
[NVCLIMATE] Nevada Long Term Climate Sites
[NHCLIMATE] New Hampshire Long Term Climate Sites
[NJCLIMATE] New Jersey Long Term Climate Sites
[NMCLIMATE] New Mexico Long Term Climate Sites
[NYCLIMATE] New York Long Term Climate Sites
[NCCLIMATE] North Carolina Long Term Climate Sites
[NDCLIMATE] North Dakota Long Term Climate Sites
[OHCLIMATE] Ohio Long Term Climate Sites
[OKCLIMATE] Oklahoma Long Term Climate Sites
[ORCLIMATE] Oregon Long Term Climate Sites
[PACLIMATE] Pennsylvania Long Term Climate Sites
[PRCLIMATE] Puerto Rico Long Term Climate
[RICLIMATE] Rhode Island Long Term Climate Sites
[SCCLIMATE] South Carolina Long Term Climate Sites
[SDCLIMATE] South Dakota Long Term Climate Sites
[TNCLIMATE] Tennessee Long Term Climate Sites
[TXCLIMATE] Texas Long Term Climate Sites
[UTCLIMATE] Utah Long Term Climate Sites
[VTCLIMATE] Vermont Long Term Climate Sites
[VACLIMATE] Virginia Long Term Climate Sites
[VICLIMATE] Virgin Islands Long Term Climate
[WACLIMATE] Washington Long Term Climate Sites
[WVCLIMATE] West Virginia Long Term Climate Sites
[WICLIMATE] Wisconsin Long Term Climate Sites
[WYCLIMATE] Wyoming Long Term Climate Sites
[IA0070] ADEL 1 SE [1958-07-01 till 1967-09-30]
[IA0064] AFTON [1894-01-01 till 1950-02-10]
[IA0088] AKRON [1900-09-01 till 2022-04-12]
[IA0089] AKRON 11E [2010-03-01 till 2013-01-28]
[IA0112] ALBIA [1894-01-01 till 2021-01-06]
[IA0116] ALBIA PASTURE IMP FARM [1956-01-01 till 1972-01-31]
[IA0133] ALGONA [1893-01-01 till now]
[IA0131] ALGONA 1NNW [2000-01-01 till 2017-12-20]
[IA0149] Allerton [1902-06-01 till now]
[IA0157] ALLISON [1914-02-01 till now]
[IA0173] ALTA [1893-01-01 till 1959-10-31]
[IA0175] ALTA NEAR [1896-03-01 till 1920-02-29]
[IA0181] ALTON [1905-05-01 till 2017-12-20]
[IA0187] ALTOONA 4W [2000-01-01 till 2017-03-29]
[IA0193] AMANA [1896-01-01 till 1915-03-31]
[IA0199] AMES 3 N [2010-01-01 till 2022-09-16]
[IA0205] AMES 3 SW [1893-01-01 till 1964-08-31]
[IA0203] AMES 5 SE [1900-01-01 till now]
[IA0200] AMES-8-WSW [1893-01-01 till now]
[IATAME] Ames Area [1893-01-01 till now]
[IA0209] AMES EXPERIMENT STATION [1893-01-01 till 1896-12-31]
[IA0197] AMES MUNICIPAL AP [1996-10-01 till now]
[IA0210] AMES SOUTHEAST [1897-01-01 till 1899-12-31]
[IA0213] ANAMOSA-1-WNW [1937-05-01 till 2014-01-05]
[IA0214] ANAMOSA 3 SSW [2011-08-01 till now]
[IA0220] ANAMOSA NO 2 [2001-01-01 till 2022-08-07]
[IA0241] Ankeny [1950-04-01 till 2021-11-05]
[IA0238] ANKENY 2 SE [2000-01-01 till 2017-03-29]
[IA0262] ANTHON [1942-07-01 till 1945-12-31]
[IA0364] ATLANTIC-1-NE [1893-01-01 till now]
[IA0366] ATLANTIC NEAR [1896-03-01 till 1897-09-30]
[IA0385] AUDUBON [1893-01-01 till now]
[IA0463] BANCROFT [1899-01-01 till 1954-10-12]
[IA0493] BARTLETT 5 E [1946-02-01 till 1972-03-31]
[IA0506] BATAVIA [1899-03-01 till 1901-02-28]
[IA0512] BATTLE CREEK 3NE [2009-09-01 till now]
[IA0513] BAXTER [1899-04-01 till 1939-12-31]
[IA0519] BAYARD 6 SE [2000-01-01 till 2017-12-20]
[IA0536] BEACONSFIELD [1951-05-01 till now]
[IA0549] BEAVER 2 NE [1948-01-01 till 1951-06-17]
[IA0576] BEDFORD-1-NNW [1898-09-01 till 2018-09-22]
[IA0596] BELKNAP [1896-01-01 till 1904-10-31]
[IA0600] BELLE-PLAINE [1893-01-01 till now]
[IA0602] BELLE PLAINE 3 S [2000-01-01 till 2017-12-20]
[IA0608] BELLEVUE-L-AND-D-12 [1937-05-01 till now]
[IA0612] BELMOND [1909-12-01 till 1946-01-31]
[IA0745] BLOCKTON 1W [1893-01-01 till 2018-07-05]
[IA0753] BLOOMFIELD [1906-08-01 till 2022-12-31]
[IA0793] BONAPARTE 5 NE [1893-01-01 till 1939-03-31]
[IA0807] Boone [1904-12-01 till now]
[IA0812] BOONE 3 WNW [1922-01-01 till 1946-07-31]
[IA0910] BRIGHTON [1968-01-01 till 2021-07-06]
[IA0923] BRITT [1897-01-01 till 2020-12-31]
[IA0933] BROOKLYN [1976-01-01 till 2023-10-02]
[IA0940] BRUNSVILLE [2010-03-01 till 2011-08-31]
[IA0999] BUCKEYE [1973-01-01 till 2010-09-18]
[IA1005] BUCKINGHAM [1899-07-01 till 1913-03-31]
[IA1060] BURLINGTON [1964-12-01 till now]
[IA1063] Burlington Airport [1897-07-01 till now]
[IA1099] BUSSEY 3 WNW [1899-04-01 till 2017-12-20]
[IA1126] CALMAR NE [2006-01-01 till 2022-12-31]
[IA1233] CARROLL-2-SSW [1893-01-01 till now]
[IA1245] CARSON 3NNE [1899-04-01 till 1951-09-30]
[IA1257] CASCADE [1942-01-01 till now]
[IA1277] CASTANA-EXP-FARM [1948-04-01 till 2018-01-16]
[IA1300] CEDAR FALLS [1893-01-01 till 2021-08-31]
[IA1319] CEDAR-RAPIDS-1 [1892-01-01 till now]
[IA1324] CEDAR RAPIDS 2 [1904-01-01 till 1966-06-30]
[IA1314] Cedar Rapids Airport [1953-06-01 till now]
[IATCID] Cedar Rapids Area [1893-01-01 till now]
[IA1354] CENTERVILLE [1893-01-01 till now]
[IA1358] CENTERVILLE 5 E [1973-01-01 till 1980-07-27]
[IA1363] CENTRAL CITY [2000-01-01 till 2022-12-31]
[IA1394] CHARITON [1895-02-01 till now]
[IA1398] CHARITON 5SSE [1970-01-01 till 2012-10-27]
[IA1402] CHARLES-CITY [1893-01-01 till now]
[IA1407] CHARLES CITY NO 2 [2000-01-01 till 2017-12-20]
[IA1442] CHEROKEE [1921-11-01 till now]
[IA1443] CHEROKEE # 2 [2000-01-01 till 2008-09-24]
[IA1461] CHESTER [1902-04-01 till 1903-07-31]
[IA1472] CHILLICOTHE [1899-03-01 till 1900-05-31]
[IA1528] CLARENCE [1934-01-01 till 1978-06-30]
[IA1533] CLARINDA [1893-01-01 till now]
[IA1535] CLARINDA 1 E [2000-01-01 till 2017-12-20]
[IA1536] CLARINDA PLUM CREEK [1934-01-01 till 1942-11-30]
[IA1537] CLARINDA TARKIO CREEK [1934-01-01 till 1942-11-30]
[IA1538] CLARINDA WALNUT CREEK [1934-01-01 till 1942-11-30]
[IA1541] CLARION [1944-01-01 till 2021-12-31]
[IA1586] CLEAR LAKE [1898-04-01 till 1913-04-30]
[IA1610] CLERMONT [2000-01-01 till 2016-09-22]
[IA1635] CLINTON-1 [1893-01-01 till now]
[IA1640] CLINTON 2 [1904-07-01 till 1985-10-31]
[IA1651] CLIO 4 NW [1992-01-01 till 1997-09-30]
[IA1704] CLUTIER [1973-01-01 till 2022-12-31]
[IA1705] COGGON [2000-01-01 till 2021-11-30]
[IA1708] COLLEGE SPRINGS [1896-03-01 till 1907-02-28]
[IA1710] COLO [1964-09-01 till 2010-12-26]
[IA1724] COLUMBIA [2000-01-01 till 2022-12-31]
[IA1731] COLUMBUS JUNCT 2 SSW [1900-10-01 till now]
[IA1737] CONESVILLE 3 NE [2000-01-01 till 2017-05-17]
[IA1742] CONRAD [1977-01-01 till 2020-09-02]
[IA1793] COON RAPIDS [1899-03-01 till 2022-12-31]
[IA1823] CORALVILLE [2000-01-01 till 2017-12-20]
[IA1828] CORALVILLE DAM [1983-01-01 till 2017-12-20]
[IA1833] CORNING [1893-01-01 till now]
[IA1838] CORRECTIONVILLE 1 SW [1942-01-01 till 2016-04-26]
[IA1848] CORYDON 8 W [1903-02-01 till 1991-08-31]
[IA1889] COUNCIL BLUFFS 6 NE [1893-07-01 till 1965-07-31]
[IA1888] COUNCIL BLUFFS 6 NNE [1948-04-01 till 1951-09-30]
[IA1954] CRESCO-1-NE [1893-01-01 till 2020-12-31]
[IA1962] Creston [1905-04-01 till now]
[IA2007] CUMBERLAND [1899-03-01 till 1978-10-31]
[IA2026] CUSHING [1934-01-01 till 1950-11-30]
[IA2041] Dakota City [2000-01-01 till 2023-09-05]
[IA2055] DALLAS 2 NW [2000-01-01 till 2017-12-20]
[IA2062] DANVILLE [1899-03-01 till 1903-08-31]
[IA2068] DAVENPORT [1896-01-01 till 1948-03-31]
[IA2071] DAVENPORT 2 [1922-09-01 till 1929-08-31]
[IA2069] DAVENPORT LOCK & DAM 15 [1953-03-01 till 1984-05-31]
[IA2070] DAVENPORT WFO [2011-06-01 till now]
[IA2117] DECORAH 2 [2007-01-01 till 2016-07-23]
[IA2110] DECORAH-2-N [1893-01-01 till now]
[IA2112] DECORAH 2 S [1896-01-01 till 1950-10-31]
[IA2136] DELAWARE 3 WSW [1893-01-01 till 1975-12-31]
[IA2171] DENISON [1893-01-01 till now]
[IA2173] DENISON SCS [1942-07-01 till 1945-02-28]
[IA2195] DERBY [1948-01-01 till 2005-07-26]
[IA2199] DES MOINES (63RD STREET) [2005-01-01 till 2012-05-02]
[IA2203] Des Moines Airport [1878-08-01 till now]
[IATDSM] Des Moines Area [1878-08-01 till now]
[IA2210] DES MOINES MILLMAN [1896-03-01 till 1898-10-31]
[IA2208] Des Moines SE 6th [1878-08-01 till 1973-12-31]
[IA2201] DES MOINES SNOW [2004-08-01 till 2022-12-31]
[IA2209] DES MOINES WSFO-JOHNSTON [1995-01-01 till now]
[IA2212] DE SOTO [1897-11-01 till 1910-11-30]
[IA2235] DE WITT [1954-09-01 till 2022-12-31]
[IA2236] DE WITT 4 S [2000-01-01 till 2022-04-12]
[IA2240] DEXTER [1935-07-01 till 1951-09-30]
[IA2299] Donnellson [1938-01-01 till now]
[IA2311] DORCHESTER [1947-01-01 till 2013-12-12]
[IA2315] DORCHESTER HWY 76 [2000-01-01 till 2017-12-20]
[IA2355] DOWS [1896-01-01 till 1909-12-31]
[IA2362] DUBUQUE #3 [2011-08-01 till 2022-12-31]
[IA2367] Dubuque Airport [1951-02-01 till now]
[IATDBQ] Dubuque Area [1873-07-01 till now]
[IA2364] DUBUQUE-LOCK-AND-DAM [1873-07-01 till now]
[IA2361] DUBUQUE NO 2 [2000-01-01 till 2017-12-20]
[IA2369] DUBUQUE RIVER [1873-07-01 till 1952-01-31]
[IA2388] DUMONT [1934-01-01 till 2011-08-06]
[IA2396] DUNBAR 2 NE [1934-03-01 till 1958-07-31]
[IA2410] DURANGO 3W [2000-01-01 till 2006-11-30]
[IA2456] EARLHAM [1902-03-01 till 1931-04-30]
[IA2541] EDDYVILLE [1939-01-01 till 1984-07-31]
[IA2544] EDDYVILLE NO 2 [2000-01-01 till 2017-12-20]
[IA2555] ELBERON 3 S [2000-01-01 till 2017-12-20]
[IA2569] ELDON [1898-04-01 till 1903-04-30]
[IA2573] Eldora [1896-02-01 till 2023-05-02]
[IA2595] ELKADER 1 SE [2000-01-01 till 2017-12-20]
[IA2603] Elkader 6SSW (Osborn) [1893-01-01 till now]
[IA2630] ELLIOTT [1905-03-01 till 1915-10-31]
[IA2638] ELMA [2003-01-01 till 2022-12-31]
[IA2678] EMERSON 4 ENE [1899-03-01 till 1971-12-31]
[IA2689] Emmetsburg [1893-01-01 till now]
[IA2697] EMMETSBURG 2 NW [2000-01-01 till 2017-12-20]
[IA2726] ESTHERVILLE 1WSW [2000-01-01 till 2017-12-20]
[IA2724] Estherville 4E [1893-01-01 till now]
[IA2725] ESTHERVILLE MUNICIPAL AP [1996-07-01 till now]
[IA2755] EVERLY 3 WNW [1954-01-01 till 2022-12-31]
[IA2778] FAIRBANK [2000-01-01 till 2008-01-31]
[IA2789] FAIRFIELD [1893-01-01 till now]
[IA2805] FAIRPORT [1921-03-01 till 1941-11-30]
[IA2864] FAYETTE [1893-01-01 till now]
[IA2896] FLORENCE [1904-04-01 till 1905-12-31]
[IA2960] FONDA [1896-06-01 till 1902-05-31]
[IA2977] FOREST-CITY [1894-03-01 till now]
[IA2999] FORT-DODGE [1899-01-01 till now]
[IA3003] FORT DODGE 4 NW [2000-01-01 till 2017-12-20]
[IA3007] Fort Madison [1893-01-01 till now]
[IA3019] FREDERICKSBURG [1897-04-01 till 1898-11-30]
[IA3022] FRUITLAND [1900-12-01 till 1938-10-31]
[IA3032] FULTON [2000-01-01 till 2020-06-30]
[IA3108] GALVA [1896-01-01 till 2010-08-24]
[IA3107] GALVA [1893-08-01 till 1917-11-30]
[IA3113] GARBER [2000-01-01 till 2017-12-20]
[IA3115] GARDEN GROVE [1896-01-01 till 1899-03-31]
[IA3120] GARWIN [1977-01-01 till 2022-12-31]
[IA3239] GILMAN [1899-04-01 till 2018-04-18]
[IA3278] GLADBROOK [1897-02-01 till 1899-12-31]
[IA3288] GLENWOOD [2000-07-01 till 2018-07-23]
[IA3290] GLENWOOD [1893-01-01 till 2008-11-30]
[IA3293] GLENWOOD 5 ESE [1895-05-01 till 1970-03-17]
[IA3295] GLENWOOD 8 SSE [1946-02-01 till 1972-03-31]
[IA3434] GREENE [1897-02-01 till 1910-12-31]
[IA3438] GREENFIELD [1893-01-01 till now]
[IA3455] GRIMES 3 E [2000-01-01 till 2017-12-20]
[IA3459] GRIMES 4 WSW [2000-01-01 till 2016-02-07]
[IA3473] GRINNELL-3-SW [1893-01-01 till now]
[IA3475] GRINNELL NEAR [1899-02-01 till 1906-03-31]
[IA3487] GRUNDY-CENTER [1893-01-01 till now]
[IA3509] GUTHRIE-CENTER [1895-01-01 till now]
[IA3517] GUTTENBERG-L-AND-D-10 [1937-05-01 till now]
[IA3567] HAMBURG [1972-01-01 till 1976-10-30]
[IA3562] HAMBURG [1899-03-01 till 2008-09-13]
[IA3569] HAMBURG 2 NE [2000-01-01 till 2017-12-20]
[IA3584] HAMPTON-2-NW [1893-01-01 till now]
[IA3589] HANCOCK [1905-06-01 till 2017-12-20]
[IA3590] HANCOCK 7SE [2006-01-01 till 2008-10-09]
[IA3600] HANLONTOWN [1902-10-01 till 1906-07-31]
[IA3623] HARCOURT 2ENE [1976-01-01 till 2019-01-26]
[IA3632] HARLAN [1899-02-01 till 2020-12-31]
[IA3667] HARTLEY 3 S [1945-01-01 till 1950-09-14]
[IA3671] HARTWICK 4NW [2000-01-01 till 2017-12-20]
[IA3675] HASTINGS 4NE [2008-01-01 till 2022-12-31]
[IA3681] HAVEN 1 NE [2000-01-01 till 2017-12-20]
[IA3712] HAVERHILL [1971-01-01 till 1994-12-31]
[IA3718] HAWARDEN [1926-08-01 till 2020-03-31]
[IA3731] HAWKEYE [1896-01-01 till 1901-08-31]
[IA3819] HEDRICK [1897-07-01 till 1901-03-31]
[IA3877] HINTON 4 W [1948-01-01 till 1951-09-30]
[IA3909] Holstein [1951-01-01 till 2020-12-31]
[IA3910] HOLSTEIN 5 NNW [2019-01-01 till now]
[IA3933] HOPEVILLE [1896-01-01 till 1910-12-31]
[IA3946] HORNICK 1 E [2003-01-01 till 2015-11-29]
[IA3900] HORNICK 4 NNE [1964-01-01 till 2022-12-31]
[IA3944] HORNICK 5S [1948-01-01 till 1951-09-30]
[IA3960] HUBBARD [1973-01-01 till 2017-12-28]
[IA3964] HUDSON [2000-06-01 till 2019-11-30]
[IA3985] HUMBOLDT 2 [1987-04-01 till 1997-06-30]
[IA3980] HUMBOLDT-2 [1895-01-01 till 2022-12-31]
[IA4038] IDA GROVE 5NW [1902-01-01 till 2007-12-31]
[IATIDA] Ida Grove Area [1902-10-01 till now]
[IA4052] INDEPENDENCE [1893-01-01 till 2017-12-20]
[IA4049] INDEPENDENCE-2-W [1867-01-01 till 2009-12-31]
[IA4063] INDIANOLA-2-SSW [1893-01-01 till 2022-12-31]
[IA4067] INDIANOLA 5 NNW [1942-09-01 till 2017-05-23]
[IA4087] INWOOD 2 SW [1902-05-01 till 1973-01-31]
[IA4094] IONIA 2 W [2002-01-01 till 2022-12-31]
[IA0000] Iowa Average [1893-01-01 till now]
[IAC005] Iowa - Central Climate Division [1893-01-01 till now]
[IA4101] Iowa City [1893-01-01 till now]
[IA4102] IOWA CITY 2 [2000-01-01 till 2017-12-20]
[IA4139] IOWA CITY 5 SW [2000-01-01 till 2014-04-16]
[IA4109] IOWA CITY (MRS HOBBY) [1896-01-01 till 1897-12-31]
[IA4106] IOWA CITY MUNICIPAL AP [1944-08-01 till now]
[IA4111] IOWA CITY RALSTON CREEK [1948-08-01 till 1951-09-30]
[IA4126] IOWA CITY RALSTON CREEK [1948-01-01 till 1951-09-30]
[IA4121] IOWA CITY RALSTON CREEK [1948-01-01 till 1951-09-30]
[IA4131] IOWA CITY RALSTON CREEK [1948-08-01 till 1951-09-30]
[IA4116] IOWA CITY RALSTON CREEK [1948-08-01 till 1951-09-30]
[IAD001] Iowa Drought Region 1 - Northwest [1893-01-01 till now]
[IAD002] Iowa Drought Region 2 - Northcentral [1893-01-01 till now]
[IAD003] Iowa Drought Region 3 - Northeast [1893-01-01 till now]
[IAD004] Iowa Drought Region 4 - Southwest [1893-01-01 till now]
[IAD005] Iowa Drought Region 5 - Southeast [1893-01-01 till now]
[IAC006] Iowa - East Central Climate Division [1893-01-01 till now]
[IA4142] IOWA-FALLS [1893-01-01 till now]
[IAC002] Iowa - North Central Climate Division [1893-01-01 till now]
[IAC003] Iowa - Northeast Climate Division [1893-01-01 till now]
[IAC001] Iowa - Northwest Climate Division [1893-01-01 till now]
[IAC008] Iowa - South Central Climate Division [1893-01-01 till now]
[IAC009] Iowa - Southeast Climate Division [1893-01-01 till now]
[IAC007] Iowa - Southwest Climate Division [1893-01-01 till now]
[IAC004] Iowa - West Central Climate Division [1893-01-01 till now]
[IA4174] IRWIN 3 ESE [1950-09-01 till 2008-06-08]
[IA4202] JAMES 1 NE [1948-04-01 till 2017-12-20]
[IA4228] JEFFERSON [1893-01-01 till now]
[IA4229] JEFFERSON 2 S [2000-01-01 till 2022-12-31]
[IA4244] JEWELL [1949-03-01 till 2018-02-09]
[IA4280] KALONA 1 SSW [2000-01-01 till 2015-04-09]
[IA4308] KANAWHA [1941-08-01 till 2022-12-31]
[IA4342] KENNEBEC [1950-05-01 till 2018-09-30]
[IA4376] KEOKUK LOCK & DAM 19 [1937-05-01 till 1953-02-28]
[IA4381] KEOKUK LOCK DAM 19 [1891-01-01 till now]
[IA4372] KEOKUK NO 2 [1929-03-01 till 1939-03-31]
[IA4389] KEOSAUQUA [1893-01-01 till now]
[IA4394] KEOSAUQUA 2 [1936-01-01 till 1976-06-30]
[IA4402] KESLEY [2000-01-01 till 2022-12-31]
[IA4433] KILLDUFF [1975-01-01 till 1984-11-26]
[IA4502] KNOXVILLE [1893-01-01 till 2023-11-28]
[IA4507] KNOXVILLE 3E [2000-01-01 till 2015-09-17]
[IA4523] LACONA [1899-04-01 till 1937-10-31]
[IA4529] LADORA [2000-01-01 till 2017-06-15]
[IA4547] LAKE CITY [1936-04-01 till 1972-10-31]
[IA4557] LAKE MILLS [1955-04-01 till 2022-12-31]
[IA4561] LAKE PARK [1912-08-01 till 2022-12-31]
[IA4569] LAKE VIEW [1938-08-01 till 1962-09-30]
[IA4585] Lamoni [1897-08-01 till now]
[IA4587] LAMONI [1998-01-01 till now]
[IA4620] LANSING [1896-06-01 till 2004-06-22]
[IA4624] LANSING 4SE [2003-04-01 till 2013-06-14]
[IA4637] LARCHWOOD [1896-09-01 till 1903-11-30]
[IA4644] LARRABEE [1893-01-01 till 1951-09-30]
[IA4700] LE CLAIRE [1893-01-01 till 1955-06-30]
[IA4705] Le Claire L&D 14 [1938-02-01 till now]
[IA4735] Le Mars [1896-01-01 till now]
[IA4746] LENOX [1895-05-01 till 1951-09-30]
[IA4758] LEON 6 ESE [1902-04-01 till 2012-10-11]
[IA4820] LINN GROVE [2003-01-01 till 2017-12-20]
[IA4867] LITTLE SIOUX [1904-08-01 till 1949-03-31]
[IA4874] LITTLE SIOUX 2NW [2000-01-01 till now]
[IA4894] LOGAN [1893-01-01 till now]
[IA4898] LOGAN NO 2 [1942-07-01 till 2009-12-31]
[IA4912] LONE TREE 5 SW [2000-01-01 till 2014-06-03]
[IA4926] LORIMOR [1950-01-01 till 2020-10-31]
[IA4963] LOWDEN [1991-01-01 till now]
[IA5000] MADRID [1895-04-01 till 1941-12-31]
[IA5085] MANCHESTER [1987-01-01 till 1994-12-31]
[IA5086] MANCHESTER-2 [1921-09-01 till now]
[IA5127] MAPLETON [1948-01-01 till 2017-12-20]
[IA5123] MAPLETON NO. 2 [1937-11-01 till now]
[IA5132] MAQUOKETA 2 NE [2000-01-01 till 2011-05-31]
[IA5131] MAQUOKETA-2-W [1896-01-01 till now]
[IA5136] MARATHON [1926-10-01 till 1939-03-31]
[IA5141] MARBLE ROCK [1954-04-01 till 1998-09-30]
[IA5150] MARENGO [2000-01-01 till 2022-12-31]
[IA5163] MARION 4 NE [1948-01-01 till 1951-09-30]
[IA5198] MARSHALLTOWN [1893-01-01 till now]
[IA5193] MARSHALLTOWN 1 [1948-04-01 till 1949-05-31]
[IA5206] MARSHALLTOWN #2 [1948-01-01 till 1949-12-31]
[IA5200] MARSHALLTOWN 4 SE [2000-01-01 till 2017-12-20]
[IA5199] MARSHALLTOWN MUNICIPAL AP [1996-10-01 till now]
[IA5230] Mason City [1893-01-01 till now]
[IA5232] MASON CITY #1 [2000-08-01 till 2019-01-28]
[IATMCW] Mason City Area [1893-01-01 till now]
[IA5235] MASON CITY MUNICIPAL AP [1942-07-01 till now]
[IA5250] MASSENA [1904-06-01 till 2022-12-31]
[IA5270] MATLOCK [1916-04-01 till 1918-01-31]
[IA5290] MAXON [1893-01-01 till 1896-09-30]
[IA5295] MAXWELL [2000-01-01 till 2022-12-31]
[IA5315] MCGREGOR [1957-01-01 till 1969-07-28]
[IA5320] MCGREGOR NO 2 [2000-01-01 till 2014-04-27]
[IA5341] MECHANICSVILLE [1896-01-01 till 1896-12-31]
[IA5383] MELROSE [1899-02-01 till 1946-08-31]
[IA5414] MERRILL [1907-05-01 till 2006-09-23]
[IA5418] MERRILL 4 WSW [1907-05-01 till 1977-12-31]
[IA5493] Milford [1919-10-01 till now]
[IA5496] MILFORD 3 W [2000-01-01 till 2010-04-23]
[IA5517] MILLERTON [1893-05-01 till 1951-02-28]
[IA5552] MINEOLA 5 NW [1996-11-01 till 2002-12-31]
[IA5584] MISSOURI VALLEY 1 NNE [1940-09-01 till 1956-05-31]
[IA5608] MONDAMIN [1942-01-01 till 1948-08-31]
[IA5622] MONMOUTH 4 SW [1940-07-01 till 1953-04-30]
[IA5630] MONONA [1948-01-01 till 1951-09-30]
[IA5638] MONROE [1911-08-01 till 1948-10-31]
[IA5650] MONTEZUMA 1 W [1896-07-01 till 2022-12-31]
[IA5669] MONTICELLO [1896-01-01 till 2022-12-20]
[IA5664] MONTICELLO [1893-01-01 till 1906-01-31]
[IA5680] MOOAR [1896-05-01 till 1901-09-30]
[IA5732] MORSE [1948-01-01 till 1951-09-30]
[IA5737] MORSE 1 NE [1948-01-01 till 1951-09-30]
[IA5742] MORSE 4 SSW [1948-01-01 till 1951-09-30]
[IA5750] MOULTON 5 W [2000-01-01 till 2017-12-20]
[IA5769] MOUNT-AYR [1893-01-01 till now]
[IA5796] MOUNT-PLEASANT [1893-01-01 till now]
[IA5813] MOUNT VERNON [1897-01-01 till 1907-09-30]
[IA5811] MOUNT VERNON [1896-06-01 till 1900-05-31]
[IA5823] MOVILLE [1948-01-01 till 1951-09-30]
[IA5834] MURRAY [1893-01-01 till 1921-05-31]
[IA5837] MUSCATINE [1935-01-01 till now]
[IA5842] MUSCATINE 2 [1895-01-01 till 2017-12-20]
[IA5844] MUSCATINE 2N [1999-01-01 till now]
[IA5847] MUSCATINE 6 N [1948-01-01 till 1950-02-22]
[IA5872] NASHUA 2 NW [1949-01-01 till 1951-08-31]
[IA5876] NASHUA 2 SW [2001-01-01 till 2022-12-31]
[IA5880] NEOLA [1896-01-01 till 1899-01-31]
[IA5882] NEVADA [1905-07-01 till 1907-09-30]
[IA5952] NEW-HAMPTON [1897-01-01 till now]
[IA5992] NEWTON [1893-01-01 till now]
[IA6044] NORA SPRINGS [1912-10-01 till 1926-12-31]
[IA6062] NORTHBORO [1899-03-01 till 1919-09-30]
[IA6076] NORTH ENGLISH [1948-01-01 till 2022-12-31]
[IA6086] NORTH MCGREGOR [1896-03-01 till 1898-08-31]
[IA6103] NORTHWOOD [1896-04-01 till now]
[IA6119] NORWICH EXPERIMENT FARM [1937-09-01 till 1970-03-31]
[IA6151] OAKLAND-2-E [1919-01-01 till now]
[IA6160] OAKLAND MILLS 3 W [1991-01-01 till 2017-12-20]
[IA6186] OASIS 1 NW [1948-01-01 till 1951-09-30]
[IA6190] OCHEYEDAN [1967-01-01 till 2013-06-30]
[IA6196] ODEBOLT [1897-02-01 till 1914-11-30]
[IA6195] ODEBOLT 2 [1897-02-01 till 1963-12-31]
[IA6199] OELWEIN 1E [2005-10-01 till now]
[IA6200] OELWEIN-2-S [1923-05-01 till 2005-11-17]
[IATOEL] Oelwein Area [1955-01-01 till now]
[IA6209] OGDEN [2000-01-01 till 2022-12-31]
[IA6205] OGDEN [1894-07-01 till 1959-09-30]
[IA6225] OLIN [1898-01-01 till 1941-06-30]
[IA6243] ONAWA [1899-01-01 till 2011-11-15]
[IA6273] ORANGE CITY [2010-06-01 till 2022-12-31]
[IA6291] ORLEANS [1934-11-01 till 1939-01-31]
[IA6305] OSAGE [1893-01-01 till now]
[IA6316] OSCEOLA-3-WSW [1894-01-01 till now]
[IA6327] OSKALOOSA [1893-01-01 till now]
[IA6335] OSKALOOSA 4 N [2000-01-01 till 2017-12-20]
[IA6363] OTO [1942-07-01 till 1954-11-30]
[IA6389] Ottumwa [1896-01-01 till now]
[IA6396] OTTUMWA [2000-01-01 till 2017-12-20]
[IA6391] OTTUMWA [1917-01-01 till 1964-12-31]
[IA6392] OTTUMWA #1 [2000-08-01 till now]
[IA6386] OTTUMWA 1 WSW [1894-01-01 till 1949-11-04]
[IA6412] OVID [1896-01-01 till 1903-01-31]
[IA6419] OXFORD JUNCTION 1 S [2004-01-01 till 2017-07-21]
[IA6440] PACIFIC JUNCTION [1899-03-01 till 1915-07-31]
[IA6418] PANORA [2000-01-01 till 2017-12-20]
[IA6492] PARKERSBURG [1951-09-01 till 2021-12-31]
[IA6520] PAULLINA [1954-01-01 till 1994-12-31]
[IA6527] PELLA 1S [1898-01-01 till 2022-12-31]
[IA6531] PELLA 4 WSW [2000-01-01 till 2012-06-20]
[IA6566] PERRY [1900-10-01 till now]
[IA6590] PETERSON [1942-07-01 till 2017-11-18]
[IA6618] PIONEER [1898-07-01 till 1900-10-31]
[IA6634] PISGAH [1950-09-01 till 2017-12-20]
[IA6698] PLOVER [1896-06-01 till 1912-06-12]
[IA6719] POCAHONTAS [1904-05-01 till now]
[IA6755] POPEJOY 1S [1974-01-01 till 2017-03-07]
[IA6760] PORTSMOUTH [1896-01-01 till 1898-04-20]
[IA6766] Postville [1893-01-01 till now]
[IA6800] PRIMGHAR [1895-04-01 till now]
[IA6820] PROMISE CITY 6 NW [1970-01-01 till 2013-11-30]
[IA6891] RANDOLPH [1953-03-01 till 2022-12-31]
[IA6895] RANDOLPH 1 W [2000-01-01 till 2017-12-20]
[IA6910] RATHBUN DAM [1970-01-01 till now]
[IA6941] READ OAK # 2 [1948-01-01 till 2017-12-20]
[IA6920] REDFIELD 2 E [1954-05-01 till 2022-12-31]
[IA6940] RED-OAK [1897-01-01 till now]
[IA6945] RED OAK 10 SW [1924-10-01 till 1948-07-31]
[IA6965] RED ROCK DAM [1984-01-01 till 1989-07-30]
[IA6969] REINBECK 2 W [1896-02-01 till 1897-08-31]
[IA6975] REMSEN [1948-01-01 till 1951-09-30]
[IA6976] REMSEN NO. 2 [2010-03-01 till 2022-12-31]
[IA6985] RHODES 3E [1972-01-01 till 2015-05-01]
[IA7035] RIDGEWAY [1898-03-01 till 1912-10-13]
[IA7058] RINGSTED [1948-01-01 till 2022-12-31]
[IA7085] RIVERTON [1926-04-01 till 1960-02-29]
[IA7147] ROCK-RAPIDS [1893-01-01 till now]
[IA7152] ROCK VALLEY [1977-01-01 till 2022-12-31]
[IA7161] ROCKWELL-CITY [1894-01-01 till now]
[IA7167] ROCKWELL CITY NO. 2 [2000-01-01 till 2022-12-19]
[IA7256] RUNNELLS 2SE [2000-01-01 till 2007-01-20]
[IA7289] RUTHVEN [1897-12-01 till 1904-11-30]
[IA7312] SAC-CITY [1893-01-01 till now]
[IA7363] SALEM 1 S [2011-06-01 till 2022-12-31]
[IA7386] SANBORN [1914-01-01 till now]
[IA7410] SARATOGA 2 E [1949-05-01 till 1968-02-29]
[IA7425] SAYLORVILLE 3WNW [2000-01-01 till 2017-12-20]
[IA7478] SCRANTON [1896-09-01 till 1903-07-31]
[IA7526] SEYMOUR [1896-01-01 till 1897-11-30]
[IA7572] SHEFFIELD 3 NW [1948-01-01 till 1951-09-30]
[IA7582] SHELBY [1950-10-01 till 2001-08-15]
[IA7594] Sheldon [1899-03-01 till 2022-12-31]
[IA7596] SHELDON 1 N [2000-01-01 till 2008-03-17]
[IA7602] SHELL ROCK 1 SW [1948-01-01 till 2016-09-22]
[IA7613] SHENANDOAH-1-NE [1918-06-01 till now]
[IA7664] SIBLEY-5-NNE [1893-01-01 till now]
[IA7669] SIDNEY [1895-01-01 till 2018-05-01]
[IA7678] SIGOURNEY [1896-01-01 till now]
[IA7683] SIGOURNEY 2 S [2000-01-01 till 2017-10-18]
[IA7700] SIOUX CENTER 2 SE [1899-05-01 till now]
[IA7712] SIOUX CITY [1889-05-01 till 1941-04-30]
[IA7703] SIOUX CITY 8 N [1946-02-01 till 1983-03-31]
[IA7702] SIOUX CITY ANG [2000-01-01 till now]
[IATSUX] Sioux City Area [1889-07-01 till now]
[IA7717] SIOUX CITY HWY 77 BRG [2015-01-01 till 2021-10-28]
[IA7713] SIOUX CITY PERRY CREEK [1946-02-01 till 2016-04-26]
[IA7708] SIOUX-CITY-WSO-AP [1889-07-01 till now]
[IA7726] SIOUX-RAPIDS [1941-06-01 till now]
[IA7738] SLOAN [1942-01-01 till 1949-02-28]
[IA7774] SOLDIER [1948-01-01 till 1951-09-30]
[IA7844] Spencer [1895-02-01 till now]
[IA7840] SPENCER [2002-01-01 till 2013-04-17]
[IAKSPW] Spencer Airport [1996-01-01 till now]
[IATSPW] Spencer Area [1895-02-01 till now]
[IA7847] SPENCER NO. 2 [1988-01-01 till 2016-08-11]
[IA7855] SPILLVILLE [1948-01-01 till 2004-09-06]
[IA7859] SPIRIT LAKE [1893-01-01 till now]
[IA7887] STACEYVILLE [1941-06-01 till 1942-08-08]
[IA7892] STANLEY [2006-01-01 till now]
[IA7326] ST ANSGAR [1948-01-01 till 2022-12-31]
[IA8646] STANTON 4N [1948-08-01 till 1951-09-30]
[IA7925] STATE CENTER [1937-01-01 till 1951-06-30]
[IA7340] ST CHARLES [1896-08-01 till 1951-09-30]
[IA7932] STEAMBOAT ROCK [1956-01-01 till 2022-12-31]
[IA7955] STOCKPORT [1901-09-01 till 1948-02-29]
[IA7979] STORM-LAKE-2-E [1893-01-01 till now]
[IA7985] STORY CITY [2000-01-01 till 2022-12-31]
[IA8009] STRAWBERRY POINT [1948-01-01 till 2022-12-31]
[IA8021] STUART [1896-04-01 till 1910-11-30]
[IA8026] SWEA CITY 4 W [1954-10-01 till now]
[IA8062] SWISHER #2 [1998-01-01 till 2022-12-31]
[IA8131] TABOR 6 NNW [1948-01-01 till 1951-09-30]
[IA8147] TARA [1897-12-01 till 1899-09-30]
[IA8169] TERRIL [1942-07-01 till 1944-01-31]
[IA8231] THURMAN [1897-06-01 till 1948-11-30]
[IA8255] TINGLEY [1924-03-01 till 1956-06-30]
[IA8266] TIPTON [1893-01-01 till 2009-12-31]
[IA8270] TITONKA [1949-12-01 till 2009-01-31]
[IA8296] TOLEDO [1894-01-01 till now]
[IA8307] TRACY 1 NE [1881-09-01 till 2017-12-20]
[IA8315] TRAER [1948-01-01 till 2022-12-31]
[IA8341] TRIPOLI 2N [2003-01-01 till 2022-08-27]
[IA8339] TRIPOLI-4-N [1946-09-01 till 2021-08-30]
[IA8359] TURIN 4S [1972-01-01 till 2017-12-20]
[IA8360] TURIN 4 SSW [1972-07-01 till 2017-12-15]
[IA8410] UNDERWOOD [2002-10-01 till 2022-12-31]
[IA8538] VILLISCA [1896-01-01 till 1904-02-29]
[IA8540] VILLISCA NO. 2 [2000-05-01 till 2011-01-09]
[IA8568] VINTON [1893-01-01 till now]
[IA8632] WALFORD 2 SE [1904-01-01 till 2012-03-22]
[IA8668] Wapello [1898-07-01 till 2018-03-18]
[IA8688] WASHINGTON [1893-01-01 till now]
[IA8693] WASHTA [1897-05-01 till 2019-04-22]
[IA8706] WATERLOO [1894-01-01 till now]
[IA8704] WATERLOO [1895-01-01 till 1950-02-28]
[IA8705] WATERLOO #1 [1997-07-01 till 2008-02-26]
[IATALO] Waterloo Area [1895-01-01 till now]
[IA8707] WATERLOO SNOW [2012-01-01 till 2022-12-31]
[IA8742] WAUCOMA 1WNW [1954-11-01 till 2022-12-31]
[IA8747] WAUKEE [1894-10-01 till 1953-03-31]
[IA8658] WAUKEE 3NE [2009-01-01 till 2016-08-01]
[IA8755] WAUKON [1934-01-01 till now]
[IA8756] WAUKON 4SW [2017-11-01 till 2019-10-10]
[IA8771] WAVERLY [1896-01-01 till 1946-08-31]
[IA8806] WEBSTER-CITY [1893-01-01 till now]
[IA8843] WESCOTT [1922-03-01 till 1927-08-31]
[IA8852] WEST BEND [1893-04-01 till 1946-10-31]
[IA8856] WEST BRANCH [1897-07-01 till 1903-06-30]
[IA8860] WEST DES MOINES 6 W [2004-01-01 till 2014-07-03]
[IA8880] WEST UNION [1898-12-01 till 1904-06-30]
[IA8867] WEST UNION 3SE [2002-09-01 till 2013-04-23]
[IA8870] WEST UNION 5 NW [2000-01-01 till 2003-01-29]
[IA8974] WEVER [1928-04-01 till 1931-11-30]
[IA8985] WHAT CHEER [1898-10-01 till 1905-02-28]
[IA8989] WHEATLAND [1948-01-01 till 1951-09-30]
[IA9000] WHITTEN [1897-05-01 till 1920-08-31]
[IA9062] WILLIAMS [1978-01-01 till 2007-01-05]
[IA9067] WILLIAMSBURG [1893-01-01 till now]
[IA9095] WILTON JUNCTION [1896-01-01 till 1909-12-31]
[IA9132] WINTERSET [1893-01-01 till now]
[IA9164] WOODBINE [1942-01-01 till 1951-08-11]
[IA9168] WOODBURN [1899-03-01 till 1912-01-31]
[IA9178] WOODWARD 7 N [1944-09-01 till 1974-04-30]
[IA9750] ZEARING [1904-04-01 till 2022-12-31]
Show Map
Click dot to select in form above.
Key
Online
Offline
Climatology Source for Second Station:
Period of Record (por) Climatology
1951-present Climatology
NCEI 1981-2010 Climatology
NCEI 1991-2020 Climatology
Custom Climatology (pick years)
For difference plot, should smoother be applied:
No Smoothing Applied
Seven Day Centered Smooth
Fourteen Day Centered Smooth
Inclusive Start Year for First Station Period of Years:
1880
1881
1882
1883
1884
1885
1886
1887
1888
1889
1890
1891
1892
1893
1894
1895
1896
1897
1898
1899
1900
1901
1902
1903
1904
1905
1906
1907
1908
1909
1910
1911
1912
1913
1914
1915
1916
1917
1918
1919
1920
1921
1922
1923
1924
1925
1926
1927
1928
1929
1930
1931
1932
1933
1934
1935
1936
1937
1938
1939
1940
1941
1942
1943
1944
1945
1946
1947
1948
1949
1950
1951
1952
1953
1954
1955
1956
1957
1958
1959
1960
1961
1962
1963
1964
1965
1966
1967
1968
1969
1970
1971
1972
1973
1974
1975
1976
1977
1978
1979
1980
1981
1982
1983
1984
1985
1986
1987
1988
1989
1990
1991
1992
1993
1994
1995
1996
1997
1998
1999
2000
2001
2002
2003
2004
2005
2006
2007
2008
2009
2010
2011
2012
2013
2014
2015
2016
2017
2018
2019
2020
2021
2022
2023
2024
2025
2026
Inclusive End Year for First Station Period of Years:
1880
1881
1882
1883
1884
1885
1886
1887
1888
1889
1890
1891
1892
1893
1894
1895
1896
1897
1898
1899
1900
1901
1902
1903
1904
1905
1906
1907
1908
1909
1910
1911
1912
1913
1914
1915
1916
1917
1918
1919
1920
1921
1922
1923
1924
1925
1926
1927
1928
1929
1930
1931
1932
1933
1934
1935
1936
1937
1938
1939
1940
1941
1942
1943
1944
1945
1946
1947
1948
1949
1950
1951
1952
1953
1954
1955
1956
1957
1958
1959
1960
1961
1962
1963
1964
1965
1966
1967
1968
1969
1970
1971
1972
1973
1974
1975
1976
1977
1978
1979
1980
1981
1982
1983
1984
1985
1986
1987
1988
1989
1990
1991
1992
1993
1994
1995
1996
1997
1998
1999
2000
2001
2002
2003
2004
2005
2006
2007
2008
2009
2010
2011
2012
2013
2014
2015
2016
2017
2018
2019
2020
2021
2022
2023
2024
2025
2026
Inclusive Start Year for Second Station Period of Years:
1880
1881
1882
1883
1884
1885
1886
1887
1888
1889
1890
1891
1892
1893
1894
1895
1896
1897
1898
1899
1900
1901
1902
1903
1904
1905
1906
1907
1908
1909
1910
1911
1912
1913
1914
1915
1916
1917
1918
1919
1920
1921
1922
1923
1924
1925
1926
1927
1928
1929
1930
1931
1932
1933
1934
1935
1936
1937
1938
1939
1940
1941
1942
1943
1944
1945
1946
1947
1948
1949
1950
1951
1952
1953
1954
1955
1956
1957
1958
1959
1960
1961
1962
1963
1964
1965
1966
1967
1968
1969
1970
1971
1972
1973
1974
1975
1976
1977
1978
1979
1980
1981
1982
1983
1984
1985
1986
1987
1988
1989
1990
1991
1992
1993
1994
1995
1996
1997
1998
1999
2000
2001
2002
2003
2004
2005
2006
2007
2008
2009
2010
2011
2012
2013
2014
2015
2016
2017
2018
2019
2020
2021
2022
2023
2024
2025
2026
Inclusive End Year for Second Station Period of Years:
1880
1881
1882
1883
1884
1885
1886
1887
1888
1889
1890
1891
1892
1893
1894
1895
1896
1897
1898
1899
1900
1901
1902
1903
1904
1905
1906
1907
1908
1909
1910
1911
1912
1913
1914
1915
1916
1917
1918
1919
1920
1921
1922
1923
1924
1925
1926
1927
1928
1929
1930
1931
1932
1933
1934
1935
1936
1937
1938
1939
1940
1941
1942
1943
1944
1945
1946
1947
1948
1949
1950
1951
1952
1953
1954
1955
1956
1957
1958
1959
1960
1961
1962
1963
1964
1965
1966
1967
1968
1969
1970
1971
1972
1973
1974
1975
1976
1977
1978
1979
1980
1981
1982
1983
1984
1985
1986
1987
1988
1989
1990
1991
1992
1993
1994
1995
1996
1997
1998
1999
2000
2001
2002
2003
2004
2005
2006
2007
2008
2009
2010
2011
2012
2013
2014
2015
2016
2017
2018
2019
2020
2021
2022
2023
2024
2025
2026
Image Pixel Size @100 DPI
1024x768 (4:3)
800x600 (4:3)
800x800 (1:1)
900x600 (3:2)
Twitter Friendly (1200x675)
1280x720 (16:9)
Select Output Format:
Chart Image (.PNG)
Scalable Vector Graphic (.SVG)
Portable Document Format (.PDF)