Automated Data Plotter
This application dynamically generates many types of graphs. These graphs are derived from processing of various data sources done by the IEM. Please feel free to use these generated graphics in whatever way you wish. Reset App. The IEM Explorer application offers a simplified frontend to some of these autoplots.
Second, select specific chart options::
Plot Description:
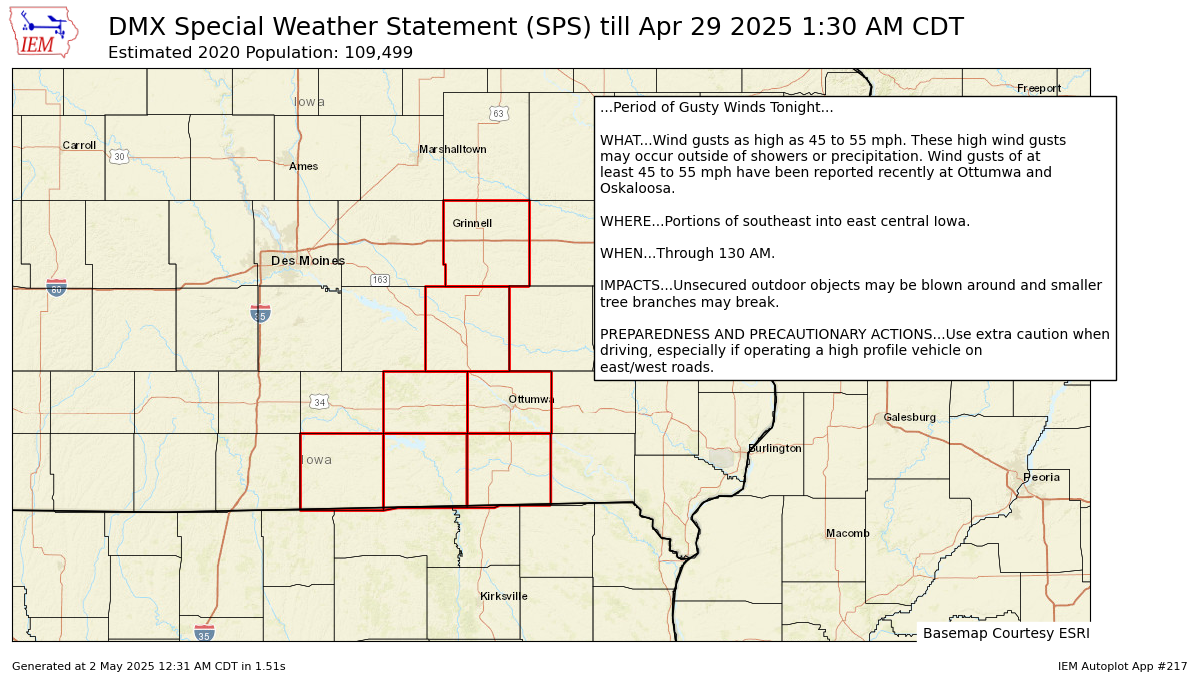
This plot is not meant for interactive use, but a backend for SPS plots. A more approachable frontend is to visit the NWS Text by WFO page and click on the SPS product you are interested in.Based on a sampling of recent timings for this application, plot generation time has averaged 4 seconds. Hold on for the plot is generating now!
 View Data (as csv)
Download as Excel
View Data (as csv)
Download as Excel
If you notice plotting issues with the image above, please
do let us know
by providing the
URL address currently shown by your web browser.
IEM Daily Features using this plot
The IEM Daily Features found on this website often utilize plots found on this application. Here is a listing of features referencing this plot type.
- 07 Nov 2024: SPS Graphics
- 08 Dec 2022: Special Weather Statement