Past Features
This page lists out the IEM Daily Features for a month at a time. Features have been posted on most days since February 2002. List all feature titles.
Mon Oct 03, 2022
Since September 19th
03 Oct 2022 05:30 AM
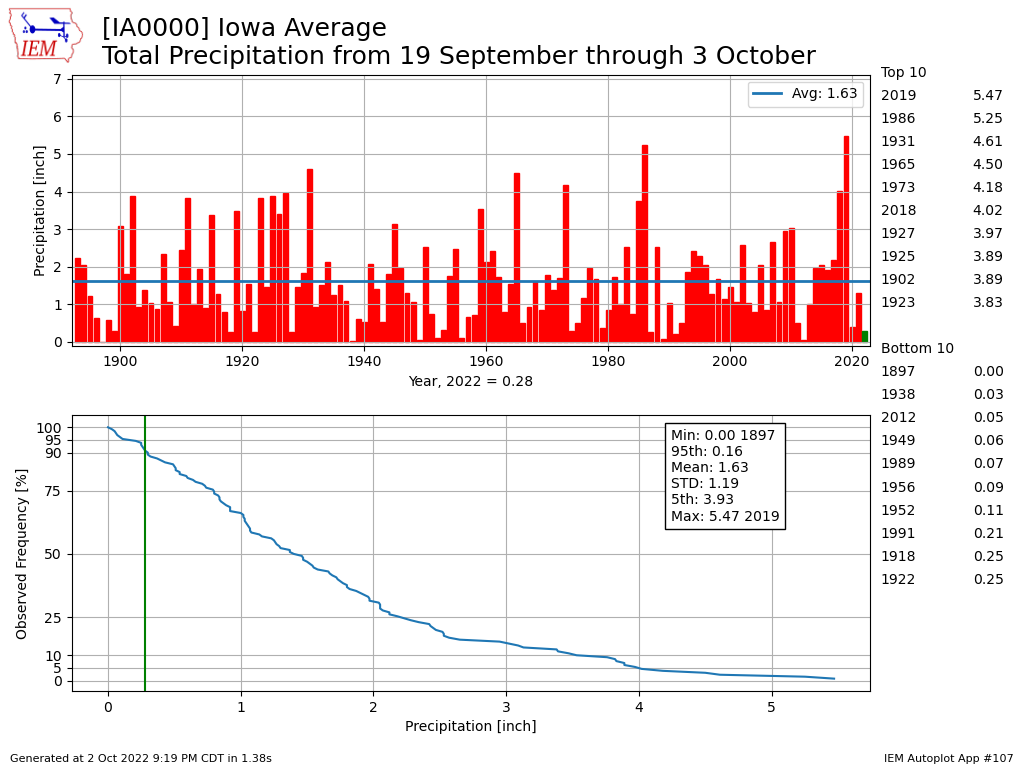
Our stretch of mostly dry and amazingly nice fall weather continued over the weekend with only a few stray showers putting an isolated damper on otherwise near perfect weather. Having dry weather this time of year is generally positive for farmers as it helps harvest progress and quickens the dry down of for the crops not yet ready for harvest. The featured chart presents the IEM estimated statewide precipitation totals each year between 19 September and 3 October. The total this year is at about the 90th percentile over the period of record and not too much below the 2020 total. The 2019 value of nearly 5.5 inches certainly sticks out on this chart and that harvest season still brings back horrible memories to Iowa farmers.
Voting: Good - 12 Bad - 0
Generate This Chart on Website
03 Oct 2022 05:30 AM
Our stretch of mostly dry and amazingly nice fall weather continued over the weekend with only a few stray showers putting an isolated damper on otherwise near perfect weather. Having dry weather this time of year is generally positive for farmers as it helps harvest progress and quickens the dry down of for the crops not yet ready for harvest. The featured chart presents the IEM estimated statewide precipitation totals each year between 19 September and 3 October. The total this year is at about the 90th percentile over the period of record and not too much below the 2020 total. The 2019 value of nearly 5.5 inches certainly sticks out on this chart and that harvest season still brings back horrible memories to Iowa farmers.
Voting: Good - 12 Bad - 0
Generate This Chart on Website
Tue Oct 04, 2022
2022 Soybean Harvest Progress
04 Oct 2022 05:30 AM
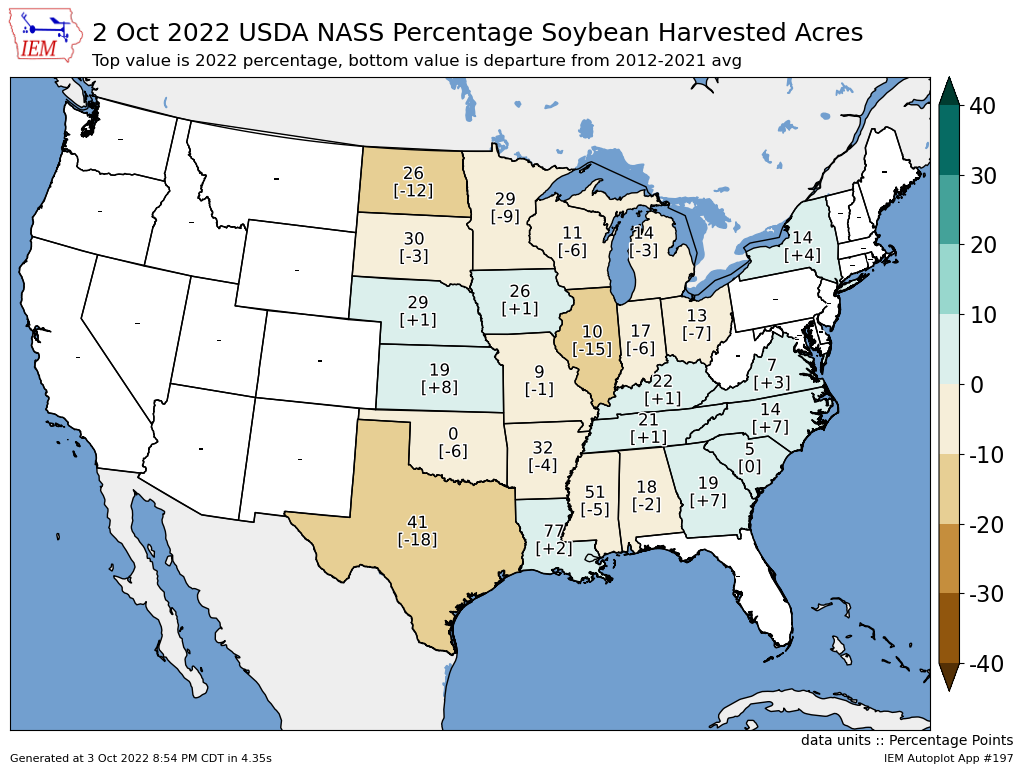
The weekly NASS crop progress update was released yesterday and it indicated good progress being made in Iowa on the soybean harvest. The featured map presents the estimated percentage of the soybean crop harvested by state and the percentage point difference from a simple ten year average for this date. While the recent weather has been very cooperative in Iowa, not all the crop is ready yet for harvest. The progress this year is in line with the average and the near term forecast would indicate that significant progress will be made this week for fields ready for harvest.
Voting: Good - 9 Bad - 0
Generate This Chart on Website
04 Oct 2022 05:30 AM
The weekly NASS crop progress update was released yesterday and it indicated good progress being made in Iowa on the soybean harvest. The featured map presents the estimated percentage of the soybean crop harvested by state and the percentage point difference from a simple ten year average for this date. While the recent weather has been very cooperative in Iowa, not all the crop is ready yet for harvest. The progress this year is in line with the average and the near term forecast would indicate that significant progress will be made this week for fields ready for harvest.
Voting: Good - 9 Bad - 0
Generate This Chart on Website
Wed Oct 05, 2022
Our last 80?
05 Oct 2022 05:30 AM
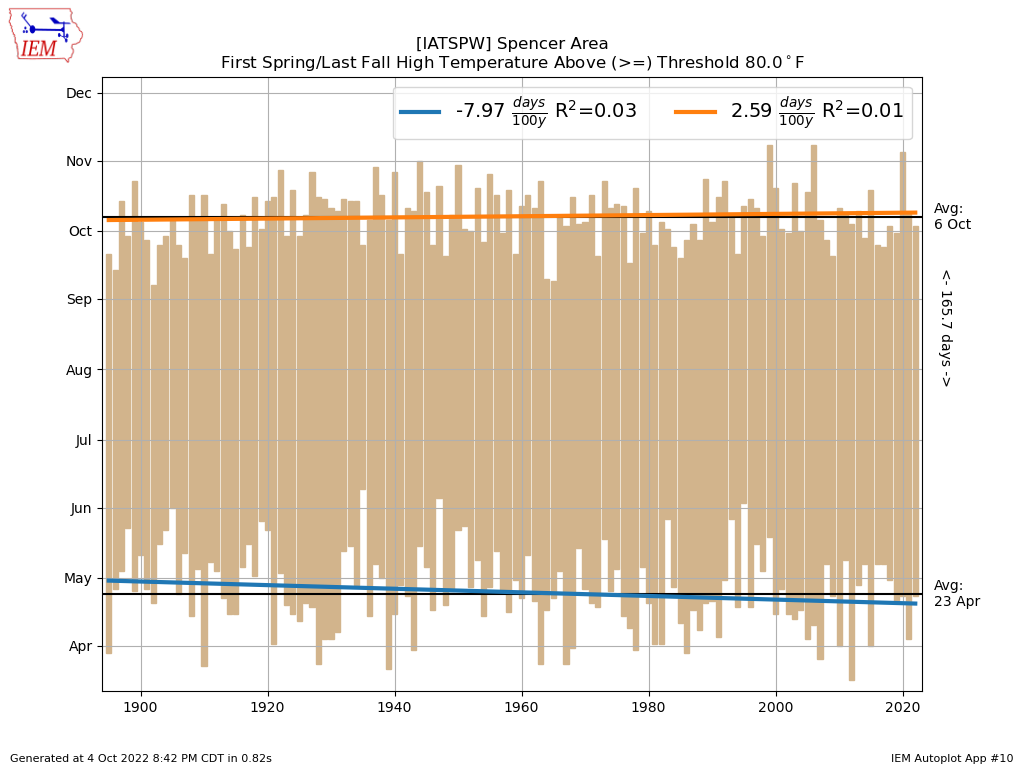
Our stretch of rather spectacular fall weather continued on Tuesday with high temperatures well into the 70s and even lower 80s for some. Spencer, IA was able to reach 80 plus degrees and one may wonder if it could be the last such warm temperature this year. The featured chart presents the yearly range between the first spring and last fall daily high temperature of at least 80 degrees. A simple average and linear trend line is fit to both values. The trend is not very strong, but going in the right direction for those of you wanting longer a warm season of the year with the spring date coming earlier and fall date coming later. The simple fall date average is around the 6th of October, so about 50% of the time we would see another 80+ degree day after today. The forecast has cooler weather in the immediate future, but pleasant temperatures again next week.
Voting: Good - 12 Bad - 0
Generate This Chart on Website
05 Oct 2022 05:30 AM
Our stretch of rather spectacular fall weather continued on Tuesday with high temperatures well into the 70s and even lower 80s for some. Spencer, IA was able to reach 80 plus degrees and one may wonder if it could be the last such warm temperature this year. The featured chart presents the yearly range between the first spring and last fall daily high temperature of at least 80 degrees. A simple average and linear trend line is fit to both values. The trend is not very strong, but going in the right direction for those of you wanting longer a warm season of the year with the spring date coming earlier and fall date coming later. The simple fall date average is around the 6th of October, so about 50% of the time we would see another 80+ degree day after today. The forecast has cooler weather in the immediate future, but pleasant temperatures again next week.
Voting: Good - 12 Bad - 0
Generate This Chart on Website
Thu Oct 06, 2022
Dry September
06 Oct 2022 05:30 AM
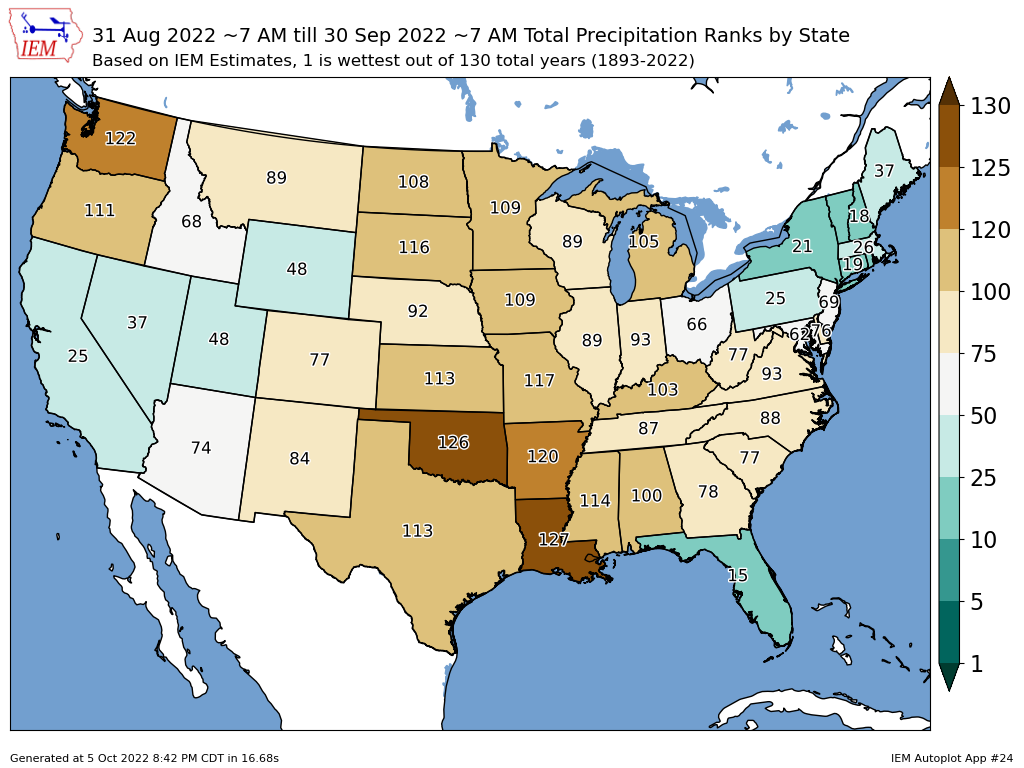
The featured map presents unofficial IEM computed precipitation ranks for September based on state areal averaged data. A value of one would represent the wettest September since 1893 and 130 the driest. The pattern over the contiguous US is rather wild with the SW and NE corners being the wettest and a large chunk of the middle of country within the top ~20 driest. A major impact of this dryness and earlier growing season dryness is the decreased capacity of the Mississippi River to handle barge traffic due to low water stages. This barge traffic is critical for hauling away grain from the corn belt during harvest season. The forecast for this entire dry region continues to look rather meager.
Voting: Good - 12 Bad - 1
Tags: sep22
Generate This Chart on Website
06 Oct 2022 05:30 AM
The featured map presents unofficial IEM computed precipitation ranks for September based on state areal averaged data. A value of one would represent the wettest September since 1893 and 130 the driest. The pattern over the contiguous US is rather wild with the SW and NE corners being the wettest and a large chunk of the middle of country within the top ~20 driest. A major impact of this dryness and earlier growing season dryness is the decreased capacity of the Mississippi River to handle barge traffic due to low water stages. This barge traffic is critical for hauling away grain from the corn belt during harvest season. The forecast for this entire dry region continues to look rather meager.
Voting: Good - 12 Bad - 1
Tags: sep22
Generate This Chart on Website
Fri Oct 07, 2022
Timing of Freeze Warning
07 Oct 2022 05:30 AM
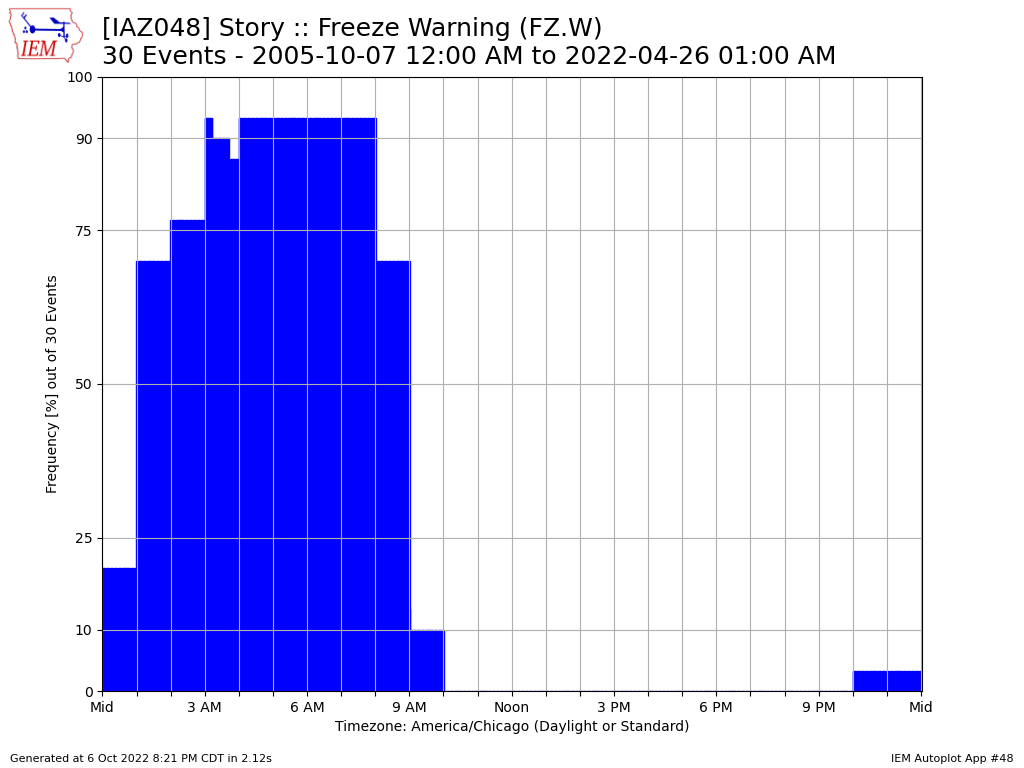
Friday will feature an abrupt end to our stretch of rather pleasant fall temperatures in Iowa with highs just in the 50s and a very cold Friday night and Saturday morning in store. The NWS will likely issue a Freeze Warning to cover much of the state as temperatures will dip well below freezing for the first time this season. The previous frost event was somewhat limited and hard freeze area even more limited, so thus the warranted headlines for this event. The Freeze Warning is only issued once for the fall season as once it happens, further events are inconsequential. The featured chart presents the timing of such events for Story County (Ames). The obvious nature of having these events during the overnight hours is readily apparent. Most of them go into effect after 1 AM and end by 9 AM.
Voting: Good - 15 Bad - 2
Generate This Chart on Website
07 Oct 2022 05:30 AM
Friday will feature an abrupt end to our stretch of rather pleasant fall temperatures in Iowa with highs just in the 50s and a very cold Friday night and Saturday morning in store. The NWS will likely issue a Freeze Warning to cover much of the state as temperatures will dip well below freezing for the first time this season. The previous frost event was somewhat limited and hard freeze area even more limited, so thus the warranted headlines for this event. The Freeze Warning is only issued once for the fall season as once it happens, further events are inconsequential. The featured chart presents the timing of such events for Story County (Ames). The obvious nature of having these events during the overnight hours is readily apparent. Most of them go into effect after 1 AM and end by 9 AM.
Voting: Good - 15 Bad - 2
Generate This Chart on Website
Mon Oct 10, 2022
Overnight Cooling Fun
10 Oct 2022 05:30 AM
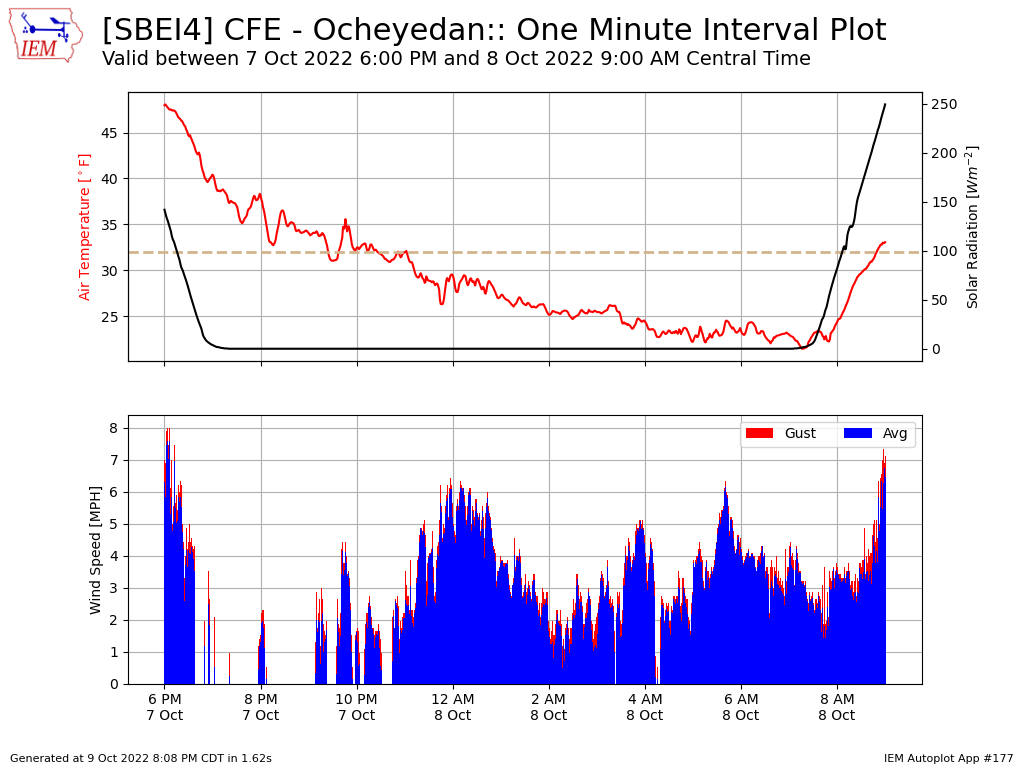
Temperatures got very chilly Saturday morning with many locations in northern Iowa dipping well into the 20s and even a 19 degree low reported at Sheldon. The featured chart presents a one minute time series plot from the ISU Soil Moisture site near Ocheyedan from Friday night into Saturday morning. The top panel shows the combination of air temperature and solar radiation. The bottom panel shows minute averaged wind speeds and gusts. There is a lot of really fun things happening with this chart. The strong cooling overnight continued until just after sunrise when incoming radiation eclipses the long wave outgoing radiation. There's lots of variability shown with rapid jumps up and down in temperature during the overnight hours. These events can be correlated with the jumps and cessation of wind as wind generally indicates vertical mixing, which would have been transporting warmer air downward. Another interesting phenomena is the interaction around the freezing line (dashed line). When water freezes, heat is released and can cause a delay in further cooling. There is also an inertia in the other direction as melting consumes heat and will cause a delay in further warming. There are hints to both processes in the chart, but it is not as strong as during cases of having lots more water around (ie snow cover / recent rain event).
Voting: Good - 8 Bad - 0
Generate This Chart on Website
10 Oct 2022 05:30 AM
Temperatures got very chilly Saturday morning with many locations in northern Iowa dipping well into the 20s and even a 19 degree low reported at Sheldon. The featured chart presents a one minute time series plot from the ISU Soil Moisture site near Ocheyedan from Friday night into Saturday morning. The top panel shows the combination of air temperature and solar radiation. The bottom panel shows minute averaged wind speeds and gusts. There is a lot of really fun things happening with this chart. The strong cooling overnight continued until just after sunrise when incoming radiation eclipses the long wave outgoing radiation. There's lots of variability shown with rapid jumps up and down in temperature during the overnight hours. These events can be correlated with the jumps and cessation of wind as wind generally indicates vertical mixing, which would have been transporting warmer air downward. Another interesting phenomena is the interaction around the freezing line (dashed line). When water freezes, heat is released and can cause a delay in further cooling. There is also an inertia in the other direction as melting consumes heat and will cause a delay in further warming. There are hints to both processes in the chart, but it is not as strong as during cases of having lots more water around (ie snow cover / recent rain event).
Voting: Good - 8 Bad - 0
Generate This Chart on Website
Tue Oct 11, 2022
SPC Watches Touching Iowa
11 Oct 2022 05:30 AM
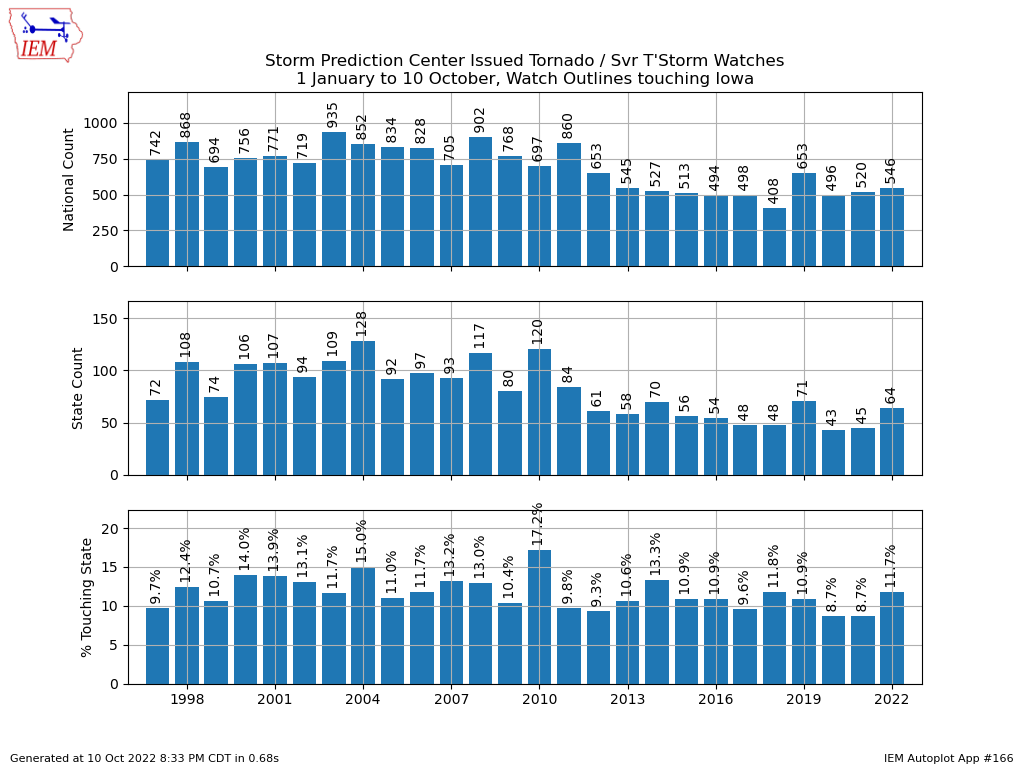
Thunderstorms have been difficult to come by these past number of weeks as dry air has dominated. There is a decent chance of such storms on Tuesday with some of them maybe even severe. With a chance of severe storms, it is a good time to check in on Storm Prediction Center (SPC) issued watches for the year. The featured chart presents year to date metrics for each year since 1997. The top panel is the total number of watches over the contiguous US. The middle panel is the number of watches whose watch polygon overlapped Iowa and the bottom panel shows the same value expressed as a percentage. Roughly one in ten watches touch Iowa and that percentage has not changed much over the period of record shown on this plot. One may wonder why the overall number of watches appears to have decreased over the years. An initial guess is it is due to increased collaboration on issuance, which tends to make the watches larger in space and time. Additionally, NWS offices can now expand watches in space when necessary, which likely has cut down on followup / small watches to cover downstream activity.
Voting: Good - 7 Bad - 1
Generate This Chart on Website
11 Oct 2022 05:30 AM
Thunderstorms have been difficult to come by these past number of weeks as dry air has dominated. There is a decent chance of such storms on Tuesday with some of them maybe even severe. With a chance of severe storms, it is a good time to check in on Storm Prediction Center (SPC) issued watches for the year. The featured chart presents year to date metrics for each year since 1997. The top panel is the total number of watches over the contiguous US. The middle panel is the number of watches whose watch polygon overlapped Iowa and the bottom panel shows the same value expressed as a percentage. Roughly one in ten watches touch Iowa and that percentage has not changed much over the period of record shown on this plot. One may wonder why the overall number of watches appears to have decreased over the years. An initial guess is it is due to increased collaboration on issuance, which tends to make the watches larger in space and time. Additionally, NWS offices can now expand watches in space when necessary, which likely has cut down on followup / small watches to cover downstream activity.
Voting: Good - 7 Bad - 1
Generate This Chart on Website
Wed Oct 12, 2022
Humidity Uptick
12 Oct 2022 05:30 AM
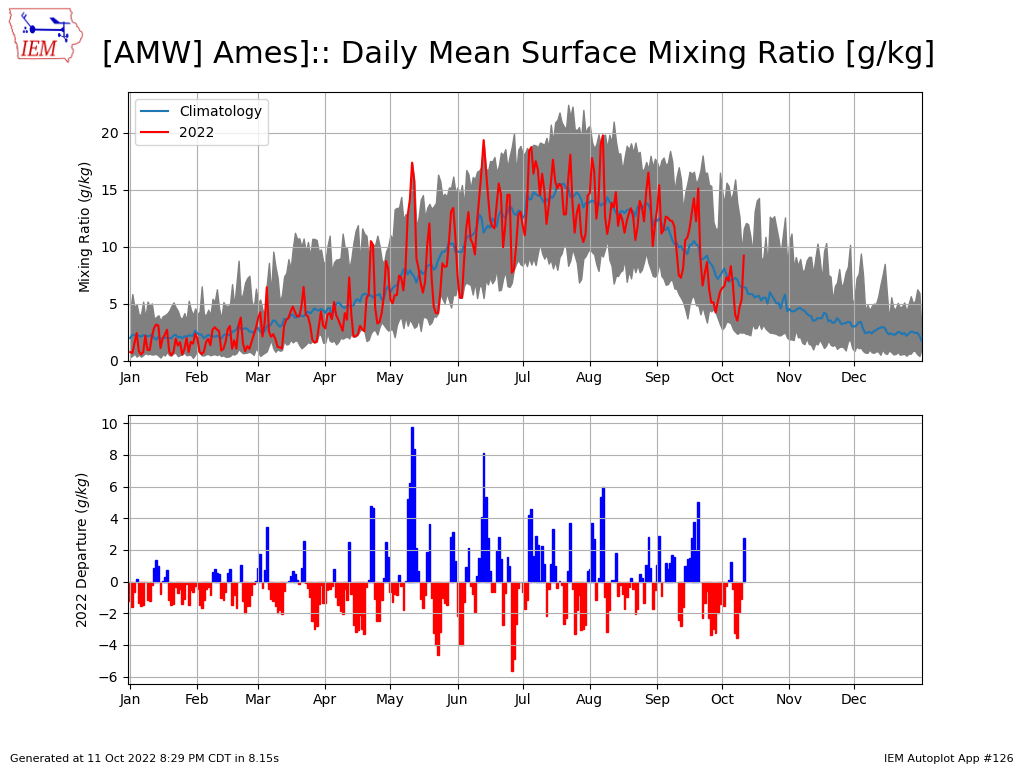
The increase in humidity on Tuesday was noticeable as warm and moist air was drawn northward ahead of an approaching cold front. The featured chart presents IEM computed daily average mixing ratios for Ames. This parameter is a direct measure of the amount of water vapor in the air and is expressed as the faction of water vapor to all other gases. The bottom panel shows the daily departure from a simple period of record average for Ames and the positive departure from yesterday sticks out vs the recent number of weeks that have featured seasonally dry air.
Voting: Good - 12 Bad - 0
Generate This Chart on Website
12 Oct 2022 05:30 AM
The increase in humidity on Tuesday was noticeable as warm and moist air was drawn northward ahead of an approaching cold front. The featured chart presents IEM computed daily average mixing ratios for Ames. This parameter is a direct measure of the amount of water vapor in the air and is expressed as the faction of water vapor to all other gases. The bottom panel shows the daily departure from a simple period of record average for Ames and the positive departure from yesterday sticks out vs the recent number of weeks that have featured seasonally dry air.
Voting: Good - 12 Bad - 0
Generate This Chart on Website
Thu Oct 13, 2022

Drought covering Iowa
13 Oct 2022 07:47 AM
The weekly update to the US Drought Monitor was just released and the entire state of Iowa is now covered by some analyzed drought classification. This marks the first time since 27 August 2013 that the entire state was covered, but 1 September 2020 was at 99.37% coverage (so insert something about lies, darned lies, and statistics). Anyway, it is no wonder that the drought situation continues to deteriorate as rain events have been sparse over the past number of weeks. The near term forecast continues to be extremely dry with near zero precipitation forecast over the next ten days.
Voting: Good - 11 Bad - 0
Generate This Chart on Website
Fri Oct 14, 2022
Cycling on the Dry Side
14 Oct 2022 05:30 AM
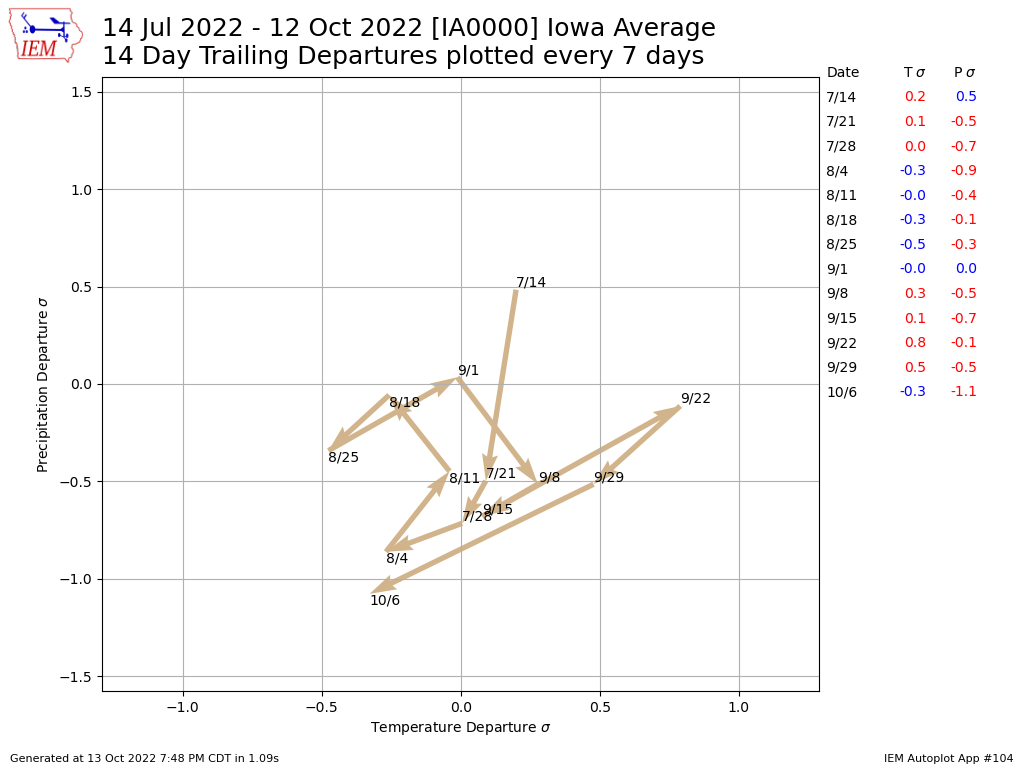
Yesterday's US Drought Monitor update painted a deepening drought situation for the state with the entire state now analyzed in some level of drought. While long term dryness continues to be an issue for some parts of the state, recent dry weather has been common for the entire state. The featured chart illustrates this by showing a time series of two week trailing departures of average temperature and precipitation for an areal averaged Iowa value. The arrows connect this metric evaluated every seven days and you can see after starting off with a positive precipitation departure for the end of July, we have spent the entire time since below average for precipitation and the most recent plotted metric has the dryness as the most anomalously severe level.
Voting: Good - 12 Bad - 0
Generate This Chart on Website
14 Oct 2022 05:30 AM
Yesterday's US Drought Monitor update painted a deepening drought situation for the state with the entire state now analyzed in some level of drought. While long term dryness continues to be an issue for some parts of the state, recent dry weather has been common for the entire state. The featured chart illustrates this by showing a time series of two week trailing departures of average temperature and precipitation for an areal averaged Iowa value. The arrows connect this metric evaluated every seven days and you can see after starting off with a positive precipitation departure for the end of July, we have spent the entire time since below average for precipitation and the most recent plotted metric has the dryness as the most anomalously severe level.
Voting: Good - 12 Bad - 0
Generate This Chart on Website
Mon Oct 17, 2022
Spencer Precipitation
17 Oct 2022 05:30 AM
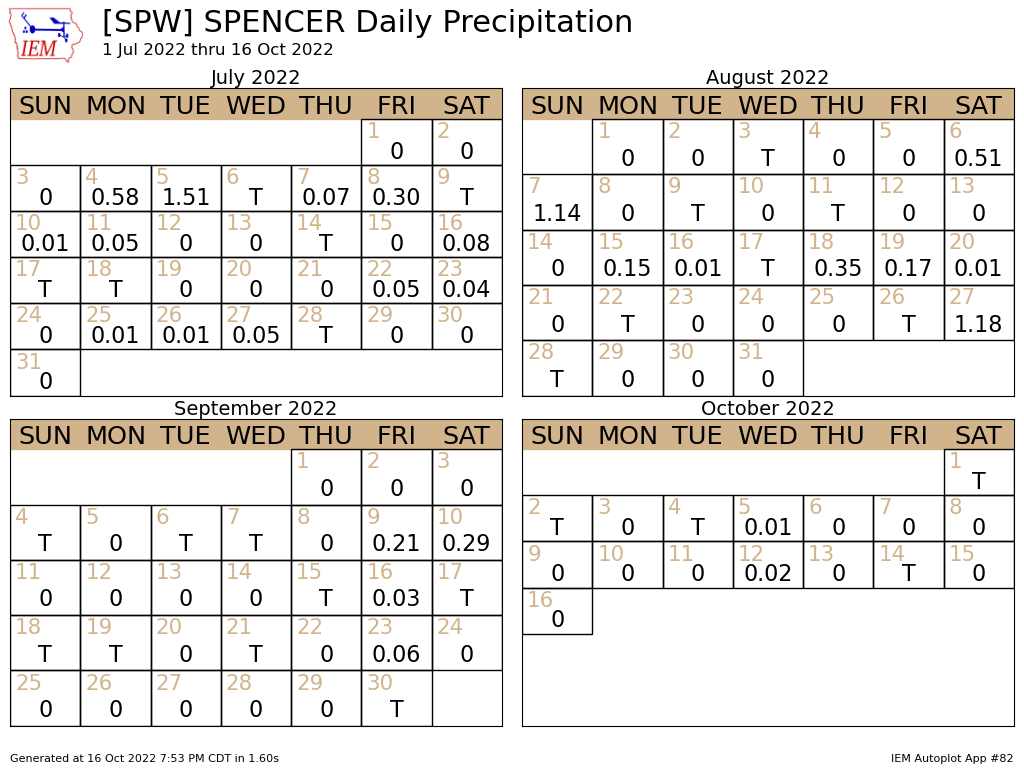
Significant rainfall events have been quite rare this fall season. For the automated airport weather stations, Spencer Iowa has been one of the driest for this period. The featured chart presents the daily precipitation reports from the site. One has to go all the way back to 27 August to find a daily value of significance. The totals for September and October have been downright pitiful and the forecast for this week offers not much hope.
Voting: Good - 10 Bad - 0
Generate This Chart on Website
17 Oct 2022 05:30 AM
Significant rainfall events have been quite rare this fall season. For the automated airport weather stations, Spencer Iowa has been one of the driest for this period. The featured chart presents the daily precipitation reports from the site. One has to go all the way back to 27 August to find a daily value of significance. The totals for September and October have been downright pitiful and the forecast for this week offers not much hope.
Voting: Good - 10 Bad - 0
Generate This Chart on Website
Tue Oct 18, 2022

Low Mississippi River
18 Oct 2022 05:30 AM
The ongoing drought is having a very significant impact on water levels along the Mississippi River. The gage height reported by the Memphis, TN sensor hit a record low value on Monday at -10.71 feet, which bested the previous record low stage set in 1988. The IEM has archives of these river gage reports, but only back to late 2010. The featured chart presents the gage height reports for the site with the red line representing the value at 9 PM Monday. You can see the current value dipping below the low flows during the drought of 2012. A major impact is reduced barge traffic, which is important for moving agricultural crops from Iowa to elsewhere.
Voting: Good - 13 Bad - 1
Tags: mississippi drought
Wed Oct 19, 2022
Early Cold
19 Oct 2022 05:30 AM
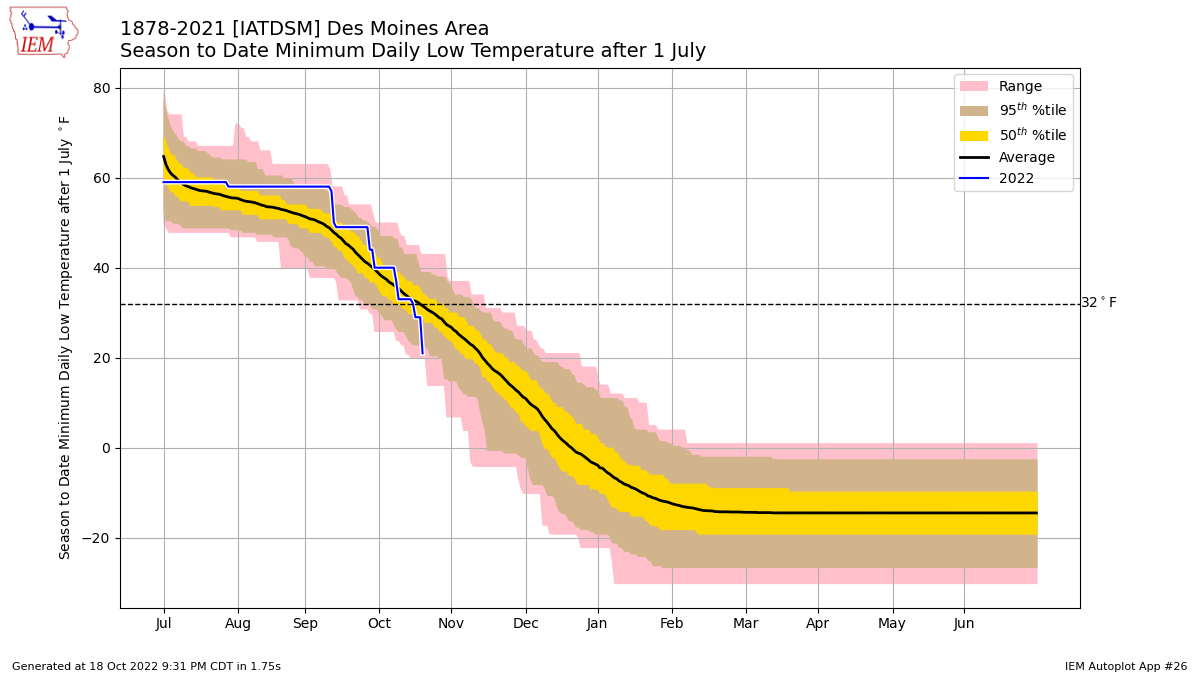
A winter like chill showed up on Tuesday with low temperatures dipping way below freezing and high temperatures struggling well below average for mid October. The featured chart presents the season to date climatology of minimum temperature for Des Moines. The blue line shows the 2022 values with the crash down to 21 yesterday representing one of the coldest temperatures this early on record for the site. While temperatures are again cold this Wednesday morning, the record values are even much colder still in the mid teens. Take heart, much warmer temperatures are only a day away with highs back in the 60s for Thursday and well into the 70s for a few days following that.
Voting: Good - 13 Bad - 3
Generate This Chart on Website
19 Oct 2022 05:30 AM
A winter like chill showed up on Tuesday with low temperatures dipping way below freezing and high temperatures struggling well below average for mid October. The featured chart presents the season to date climatology of minimum temperature for Des Moines. The blue line shows the 2022 values with the crash down to 21 yesterday representing one of the coldest temperatures this early on record for the site. While temperatures are again cold this Wednesday morning, the record values are even much colder still in the mid teens. Take heart, much warmer temperatures are only a day away with highs back in the 60s for Thursday and well into the 70s for a few days following that.
Voting: Good - 13 Bad - 3
Generate This Chart on Website
Thu Oct 20, 2022
Earliest Low of 16
20 Oct 2022 05:30 AM
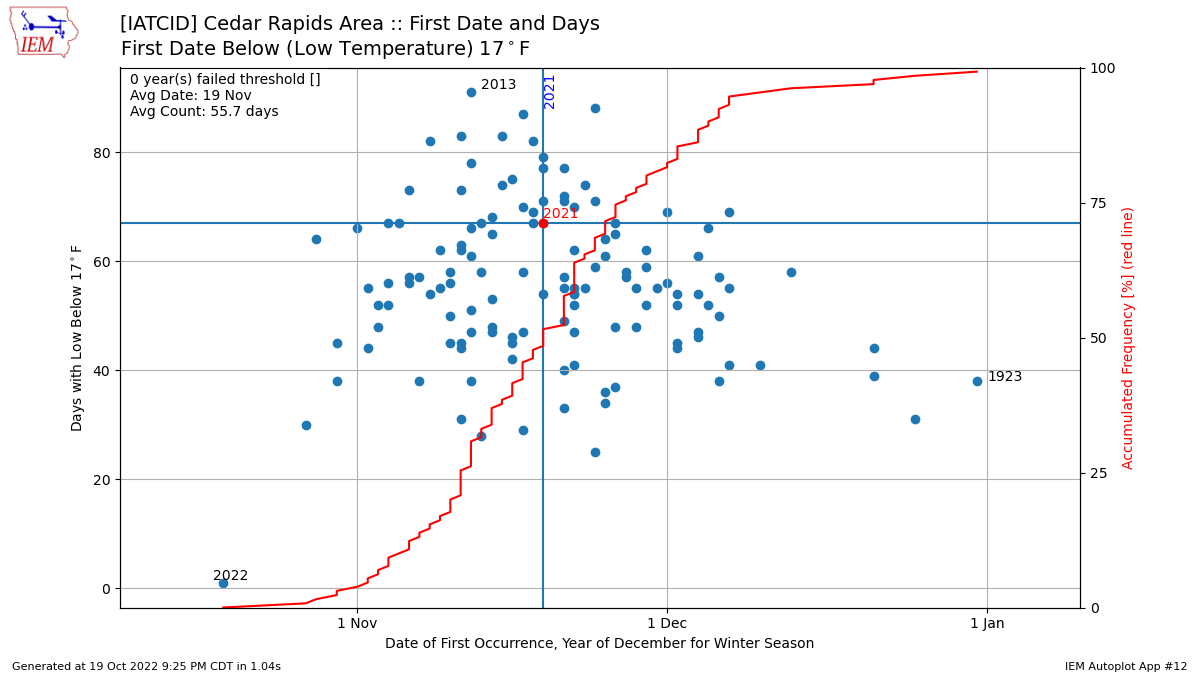
Very dry air, recent drought conditions, and a cold air mass have conspired to create very cold temperatures over Iowa this week. Cedar Rapids had a low temperature of 16 degrees on Tuesday, which smashed the previous record for the date and was the earliest such temperature for the season by over a week. The featured chart presents the seasonal combination of first date with a low temperature below 17 and the number of such dates for the season. Last season's total is highlighted along with the extreme dates. Having such a cold temperature this early in the season does not necessarily portend to having an above average number for the season. The good news for those that would like fall to stick around before winter arrives is that the near term forecast has much warmer temperatures and even a chance of rain.
Voting: Good - 11 Bad - 0
Generate This Chart on Website
20 Oct 2022 05:30 AM
Very dry air, recent drought conditions, and a cold air mass have conspired to create very cold temperatures over Iowa this week. Cedar Rapids had a low temperature of 16 degrees on Tuesday, which smashed the previous record for the date and was the earliest such temperature for the season by over a week. The featured chart presents the seasonal combination of first date with a low temperature below 17 and the number of such dates for the season. Last season's total is highlighted along with the extreme dates. Having such a cold temperature this early in the season does not necessarily portend to having an above average number for the season. The good news for those that would like fall to stick around before winter arrives is that the near term forecast has much warmer temperatures and even a chance of rain.
Voting: Good - 11 Bad - 0
Generate This Chart on Website
Fri Oct 21, 2022

Relative Humidity Dive
21 Oct 2022 05:30 AM
The featured chart presents hourly relative humidity for Ames since 1 July. The recent dive downward in RH is noticeable on the chart and is painfully noticeable for those with respiratory and/or skin sensitivities to dry air. The cause is certainly related to the worsening drought and end of growing season, which both have eliminated sources of atmospheric water vapor. The lack of humidity has also allowed very cold low temperatures to materialize this week. With rain chances in the forecast for late this weekend and next week, one wonders how this persistent dry air will put a damper on the much needed rainfall.
Voting: Good - 14 Bad - 0
Generate This Chart on Website
Mon Oct 24, 2022
Two Days of 83+
24 Oct 2022 05:30 AM
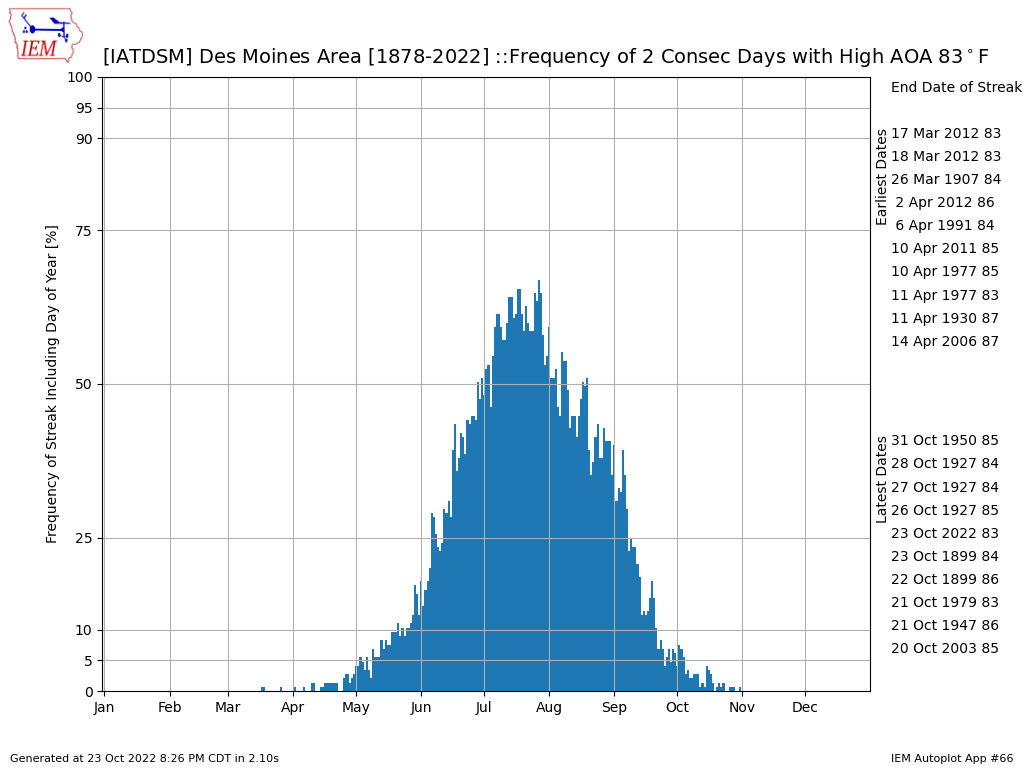
It was a remarkable weekend of late October weather with temperatures soaring into the 70s and even 80s. This was after record cold earlier last week along with some brief snow flurries over far eastern Iowa. The Des Moines Airport hit 83 degrees on both Saturday and Sunday. The featured chart presents the daily frequency of the given day participating within a streak of at least two days with a high temperature of at least 83 degrees. The past two day streak shows up in the top 10 for latest on record. The chart also clearly shows that such streaks have not been observed after the first of November until mid March, so hopefully you enjoyed the extreme warmth while it lasted. The forecast this week has cooler temperatures, but still quite seasonal for this time of year.
Voting: Good - 13 Bad - 0
Generate This Chart on Website
24 Oct 2022 05:30 AM
It was a remarkable weekend of late October weather with temperatures soaring into the 70s and even 80s. This was after record cold earlier last week along with some brief snow flurries over far eastern Iowa. The Des Moines Airport hit 83 degrees on both Saturday and Sunday. The featured chart presents the daily frequency of the given day participating within a streak of at least two days with a high temperature of at least 83 degrees. The past two day streak shows up in the top 10 for latest on record. The chart also clearly shows that such streaks have not been observed after the first of November until mid March, so hopefully you enjoyed the extreme warmth while it lasted. The forecast this week has cooler temperatures, but still quite seasonal for this time of year.
Voting: Good - 13 Bad - 0
Generate This Chart on Website
Tue Oct 25, 2022

Warm October Morning
25 Oct 2022 05:30 AM
The warm temperatures from this past weekend carried over into Monday before a cold front swept the state. The featured chart presents the IEM computed and unofficial hourly temperature records for Des Moines for the inclusive date period of 24 October through 31 December. A number of new records can be seen between 2 and 7 AM. The warm and moist air mass ahead of the cold front has helped to support the ongoing rainfall event with much of the state picking up desperately needed rainfall. While the rainfall will slightly delay the ongoing fall harvest, there are likely very few farmers complaining.
Voting: Good - 9 Bad - 0
Generate This Chart on Website
Wed Oct 26, 2022

60 Day SPI Changes
26 Oct 2022 05:30 AM
The folks that author the US Drought Monitor will take into consideration changes to statistics like the Standardized Precipitation Index over the past seven days. A question currently being considered is how impactful was the rainfall event this past weekend. The featured graphic is a rather complex data dive at this question and looks specifically at the 60 day SPI changes from last week to this week. The map panel presents the combination of most recent drought analysis and 60 day SPI based drought classification on 25 Oct 2022. Please note that there is not a one to one relationship between any given SPI value and the US Drought Monitor, the SPI is just an indicator. The plotted map values are colorized by if that value improved or degraded over the past week. The top right panel shows the magnitude of change and colored by if that change moved to a different drought classification. The bottom right panel counts the number of stations that changed from one classification to another. So this graphic shows that at the 60 day interval, the most recent rain did help some limited areas of the state, but other areas like far eastern Iowa did not improve.
Voting: Good - 10 Bad - 0
Generate This Chart on Website
Thu Oct 27, 2022
Iowa D4 Drought
27 Oct 2022 05:31 AM
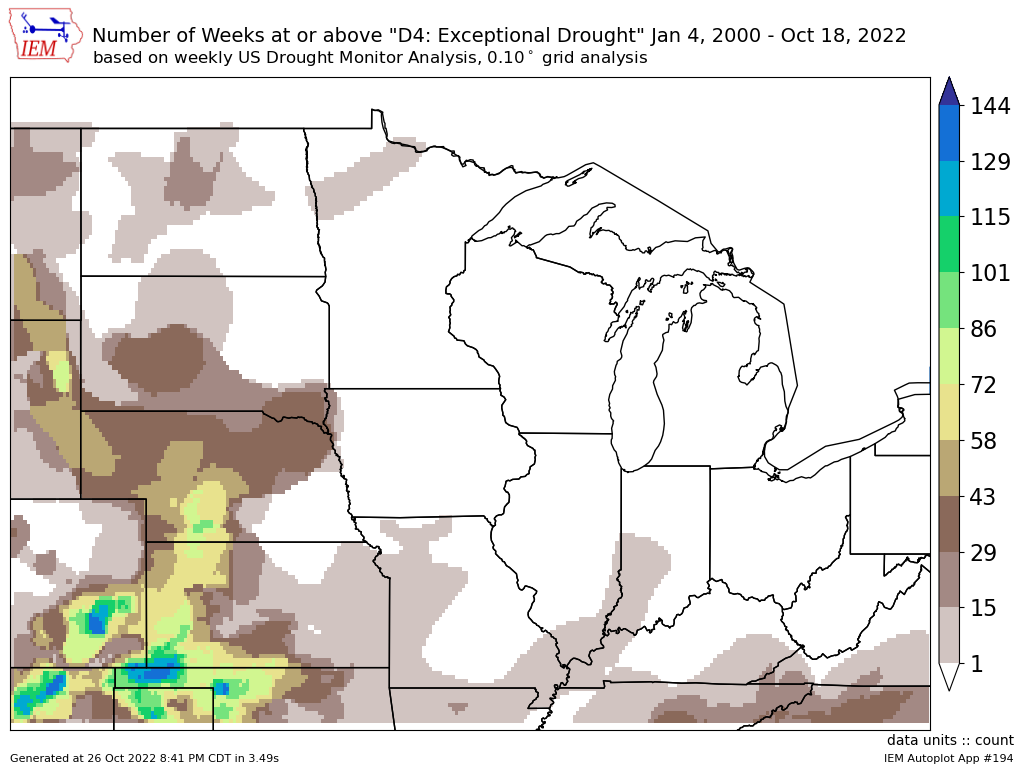
For the past number of weeks, analyzed D4 drought classification (the most intense level) has been just off to Iowa's west in Nebraska. This week's update is due out later this morning and will be interesting to see if D4 has made it into Iowa. Having D4 drought in Iowa is extremely rare as shown by the featured map presenting a raster analysis of number of weeks spent at D4 classification since the inception of the drought monitor in 2000. Only the most extreme portion of far northwestern Iowa and a sliver of Iowa's southern border have seen D4. It seems possible that D4 could eventually creep further into northwestern Iowa than in previous years with dry weather expected to persist into early winter.
Voting: Good - 12 Bad - 1
Tags: drought
Generate This Chart on Website
27 Oct 2022 05:31 AM
For the past number of weeks, analyzed D4 drought classification (the most intense level) has been just off to Iowa's west in Nebraska. This week's update is due out later this morning and will be interesting to see if D4 has made it into Iowa. Having D4 drought in Iowa is extremely rare as shown by the featured map presenting a raster analysis of number of weeks spent at D4 classification since the inception of the drought monitor in 2000. Only the most extreme portion of far northwestern Iowa and a sliver of Iowa's southern border have seen D4. It seems possible that D4 could eventually creep further into northwestern Iowa than in previous years with dry weather expected to persist into early winter.
Voting: Good - 12 Bad - 1
Tags: drought
Generate This Chart on Website
Fri Oct 28, 2022

Continued La Nina
28 Oct 2022 05:29 AM
While not overly strong, the persistent La Nina state of the Pacific Ocean has spelled trouble for drought over much of the country. The featured chart presents the combination of monthly El Nino 3.4 index and monthly statewide Iowa precipitation departures. The mostly dry months and negative El Nino (which means La Nina) index values since early 2020 are noticeable. The relationship between Iowa's weather and this index is complex, modified by other large scale earth air circulations, and has seasonal dependencies. So while the index value does not directly predict our weather, it certainly biases what we can expect to the dry side of average.
Voting: Good - 18 Bad - 0
Generate This Chart on Website
Mon Oct 31, 2022

November Snow vs Precip
31 Oct 2022 05:28 AM
With just one more day of October to go, we might as well look forward to November. While the forecast starts off the month warm, the chances of measurable snowfall during the month significantly increase over October. The featured chart presents the November totals of snowfall vs precipitation for Des Moines. The value for last year is highlighted on the chart. The contoured areas are increasing population densities. This chart shows an average snowfall total of 2.5 inches, but plenty of zeros are plotted as well. It is interesting to see that increasing precipitation totals for the month do seem to increase the chances of more snowfall as well. This is likely due to the source of significant precipitation events being blockbuster storm systems that will feature a strong cold air side with associated snowfall. At this point, we desperately need rain and I am unsure though how many people are that desperate to have it fall in the form of snow!
Voting: Good - 8 Bad - 1
Generate This Chart on Website