Past Features
This page lists out the IEM Daily Features for a month at a time. Features have been posted on most days since February 2002. List all feature titles.
Thu Jun 01, 2023
May Max VPD Averages
01 Jun 2023 05:30 AM
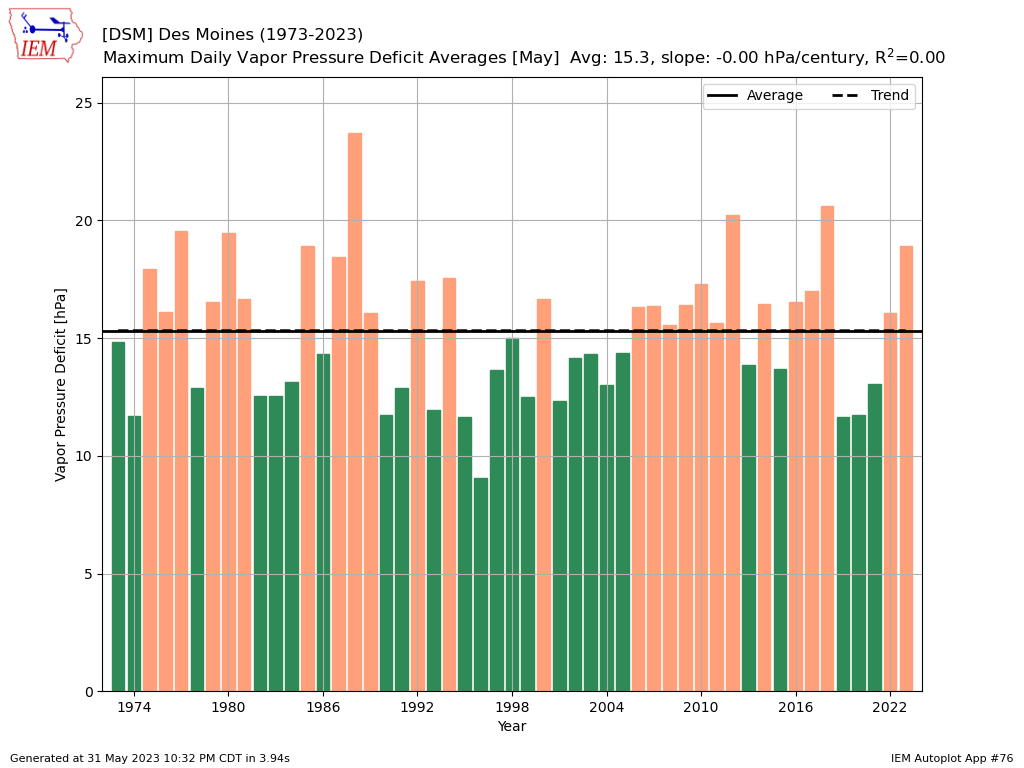
Vapor Pressure Deficit (VPD) is a weather variable that isn't as commonly used to express humidity like dew point and relative humidity are. The values also have units of pressure, which makes them even a bit more obtuse. So what use are they? They represent an absolute measure of potential demand from the air of water vapor from various surfaces that may contain water. For green house operators and horticulture folks, knowing VPD can inform plant health and development. The featured chart presents the average May daily max VPD values for Des Moines. Rewording, the maximum VPD is calculated each day of each May and then averaged by year. The 2023 value is higher than a simple average and higher than the past four years. Higher values indicate increased demand for water vapor or perhaps you could consider it as a suction force. It is interesting to see 1988 show up as the highest value since 1973, which of course, was a very bad drought year.
Voting: Good - 8 Bad - 0
Tags: vpd
Generate This Chart on Website
01 Jun 2023 05:30 AM
Vapor Pressure Deficit (VPD) is a weather variable that isn't as commonly used to express humidity like dew point and relative humidity are. The values also have units of pressure, which makes them even a bit more obtuse. So what use are they? They represent an absolute measure of potential demand from the air of water vapor from various surfaces that may contain water. For green house operators and horticulture folks, knowing VPD can inform plant health and development. The featured chart presents the average May daily max VPD values for Des Moines. Rewording, the maximum VPD is calculated each day of each May and then averaged by year. The 2023 value is higher than a simple average and higher than the past four years. Higher values indicate increased demand for water vapor or perhaps you could consider it as a suction force. It is interesting to see 1988 show up as the highest value since 1973, which of course, was a very bad drought year.
Voting: Good - 8 Bad - 0
Tags: vpd
Generate This Chart on Website
Fri Jun 02, 2023

Contrasts of May
02 Jun 2023 05:30 AM
The featured map presents IEM estimated climate district precipitation ranks for May. A value of 1 would indicate the wettest May since 1893 and 131 would be the driest. There is some remarkable variability shown, namely the east to west difference over Nebraska with southwestern Nebraska shown as the wettest and east central near the driest. Iowa had plenty of dryness for the month, but southwestern Minnesota was had above average wetness. Of course, these are spatially aggregated estimates, so there's variability to be found even inside the climate districts shown.
Voting: Good - 14 Bad - 2
Generate This Chart on Website
Mon Jun 05, 2023
Meager Shear
05 Jun 2023 05:30 AM
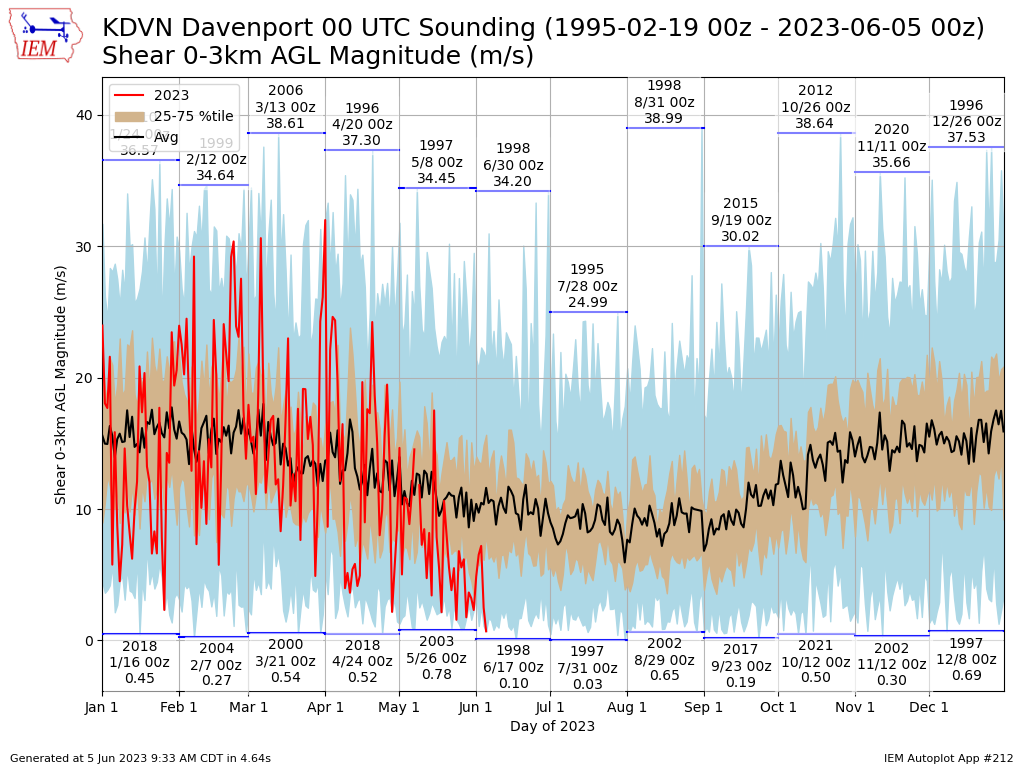
The weather to start off June has more resembled August with slow moving afternoon thunderstorms driven by a humid air mass and strong heating. The slow storm movement has even been in uncommon directions to the west and southwest. The reason is that the flow of air aloft is rather stagnant from the east and without much directional nor speed shear to support more robust thunderstorm activity. The featured chart presents a measure of speed sheer between the surface and 3km aloft based on an archive of soundings from Davenport. The units and concept here maybe a bit too meteorological, but generally higher shear values support more robust thunderstorms by allowing the updraft and downdraft of the storms to be separated. Otherwise you get pulsey behavior as the downdraft interferes with the updraft. Anyway, you can see how recent sounding values this year have been at the very low end of a climatological range.
Voting: Good - 13 Bad - 0
Tags: sounding shear
Generate This Chart on Website
05 Jun 2023 05:30 AM
The weather to start off June has more resembled August with slow moving afternoon thunderstorms driven by a humid air mass and strong heating. The slow storm movement has even been in uncommon directions to the west and southwest. The reason is that the flow of air aloft is rather stagnant from the east and without much directional nor speed shear to support more robust thunderstorm activity. The featured chart presents a measure of speed sheer between the surface and 3km aloft based on an archive of soundings from Davenport. The units and concept here maybe a bit too meteorological, but generally higher shear values support more robust thunderstorms by allowing the updraft and downdraft of the storms to be separated. Otherwise you get pulsey behavior as the downdraft interferes with the updraft. Anyway, you can see how recent sounding values this year have been at the very low end of a climatological range.
Voting: Good - 13 Bad - 0
Tags: sounding shear
Generate This Chart on Website
Tue Jun 06, 2023

Oelwein Precipitation Departures
06 Jun 2023 05:30 AM
This week's update to the US Drought Monitor is released on Thursday and assesses the seven day precipitation ending Tuesday morning. Degradation seems to be a given with much of the state continuing to be mostly dry and warm temperatures increasing water demand. Over the past month or so, one of the driest areas of the state is found in northeastern Iowa at Oelwein. The featured chart presents a number of metrics evaluating precipitation totals or departures over a trailing number of days ending yesterday. The values on each chart represent the given date until June 5th, so they should somewhat be evaluated from right to left. The bottom left panel denotes the Standardized Precipitation Index (SPI) values within the drought monitor assessment. You can see that over different time scales, different drought threshold indicators are to be found. The present drought monitor value for the location is "D1", which is well supported by this plot dating back into late 2022. The short term is certainly much drier and the weighting of this year's growing season totals continue to increase in the drought monitor assessment as impacts (brown lawns, degraded crops, low streamflows, etc) increase.
Voting: Good - 5 Bad - 0
Tags: precip
Generate This Chart on Website
Wed Jun 07, 2023

Weird Storm Motions
07 Jun 2023 05:30 AM
Those of you that monitor RADAR reflectivity loops every day have likely noticed the weird storm motions this month. Typically storms travel from the southwest toward the northeast, but the past days have seen storms travel west, northwest, south, and about every other direction. The featured chart attempts to illustrate these odd storm motions by plotting a histogram of Des Moines NEXRAD storm motion tracks. The top panel shows the combined May and June climatology and the dominance of storms travelling from the southwest is obvious. The bottom panel shows the histogram for storms this month and it is about the antithesis of climatology. The reason for these weird storm motions is the very blocked up upper level flow pattern that currently has weak westerly moving flow over the state. The hope is that this pattern will break next week and we can start getting into more typical June storm patterns with stronger flow aloft.
Voting: Good - 16 Bad - 2
Tags: stormmotion
Thu Jun 08, 2023
No GDD Problems So Far
08 Jun 2023 05:30 AM
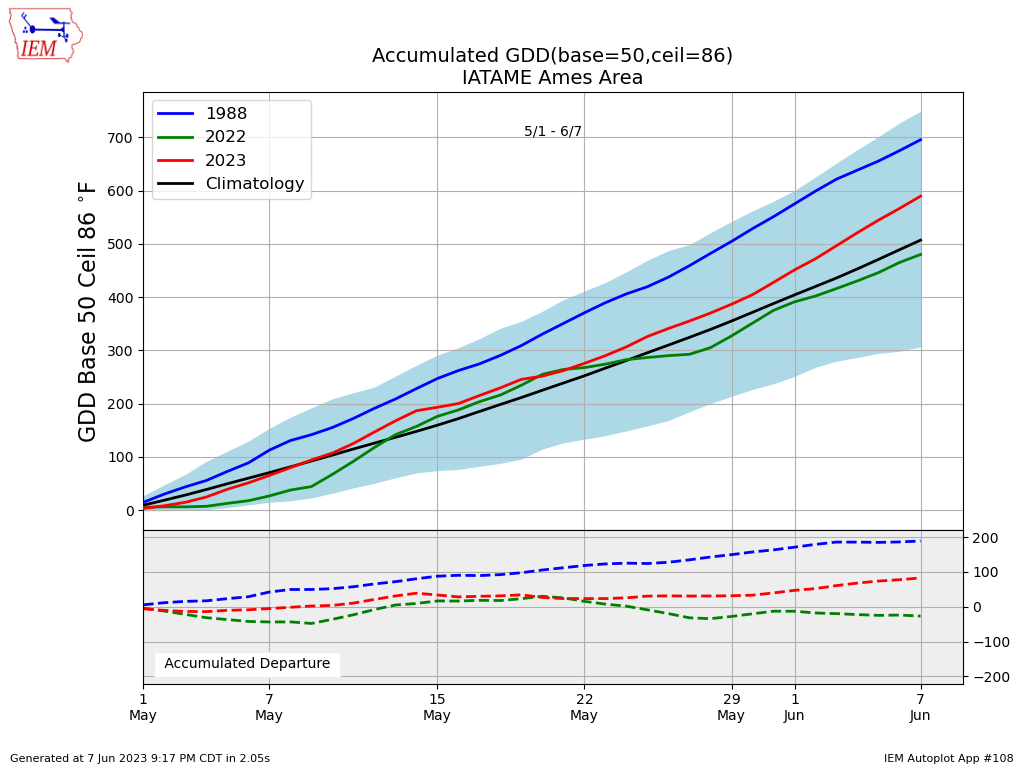
While precipitation has been fickle, there's been no issue accumulating needed growing degree days so far. The featured chart presents the accumulated GDDs since 1 May for Ames with the blue area representing the envelope of period of record observations. This year is plotted along with last year and the drought year of 1988. This year's total is well above average and last year's total. Such is often the case with dry weather leading to warmer temperatures as the sun is able to more efficiently heat drier soil than wetter. The near term and longer term forecasts continue to advertise warmer than average temperatures, so it seems very likely that GDDs will not be of concern this growing season.
Voting: Good - 10 Bad - 1
Tags: gdd
Generate This Chart on Website
08 Jun 2023 05:30 AM
While precipitation has been fickle, there's been no issue accumulating needed growing degree days so far. The featured chart presents the accumulated GDDs since 1 May for Ames with the blue area representing the envelope of period of record observations. This year is plotted along with last year and the drought year of 1988. This year's total is well above average and last year's total. Such is often the case with dry weather leading to warmer temperatures as the sun is able to more efficiently heat drier soil than wetter. The near term and longer term forecasts continue to advertise warmer than average temperatures, so it seems very likely that GDDs will not be of concern this growing season.
Voting: Good - 10 Bad - 1
Tags: gdd
Generate This Chart on Website
Fri Jun 09, 2023

Change in 60 Day SPI
09 Jun 2023 05:30 AM
The weekly release of the US Drought Monitor yesterday degraded much of the state with only small areas left analyzed without drought. The featured map and charts attempt to show how one metric that goes into drought monitoring, the Standardized Precipitation Index (SPI), has changed over approximately the last month. A trailing 60 day SPI is computed on 2 May and then compared with the same metric computed on 6 June. The top right panel shows arrows indicating how each of the long term climate sites in the state changed over this period. Colored arrows indicate at least a one category change. The bottom right panel shows the station count changing between the various SPI based drought categories. The map plots some of the current SPI based drought categories and is also colored by if it changed over this period. The filled in area on the map is the most recent drought monitor. So the main point here is found in the top right panel showing many of the points that started off in no or D0 drought category have degraded one to two categories. Areas east of Waterloo and southeastern Iowa have seem the worst of the degrading conditions since early May.
Voting: Good - 11 Bad - 1
Generate This Chart on Website
Mon Jun 12, 2023

31 Day Percent of Average Precip
12 Jun 2023 05:30 AM
The weekend chances for precipitation produced underwhelming amounts as totals were generally very light and even barely enough to keep up with climatology for what should be about the wettest time of the year. The featured map presents a smoothed analysis of IEM estimated precipitation departures over the past 31 days. The departures are expressed as a percentage of average with a value of 100% representing receiving a precipitation total equal to climatology. As with other recent IEM daily features, this map nicely highlights the driest portions of the state being southwest and southeastern Iowa. The bad news is that rain chances this week look non-existent until the weekend and temperatures will be much hotter, which will increase moisture stress.
Voting: Good - 11 Bad - 1
Generate This Chart on Website
Tue Jun 13, 2023

Cold June Morning
13 Jun 2023 05:30 AM
Our recent stretch of rather weird weather continued on Monday with low temperatures dropping into the 40s and even 30s over eastern Iowa. A NWS COOP site near Elkader (far NE Iowa) reported a low of 35 degrees and the observed denoted frost present! The featured map presents low temperature reports on Monday and the year one has to go back to find as cold of a low temperature during the month of June. Temperatures over eastern Iowa were certainly exceptional with the blue locations having to go back at least 20 years to find as cold of a temperature.
Voting: Good - 11 Bad - 0
Tags: june 2023
Wed Jun 14, 2023

Deteriorating Crops
14 Jun 2023 05:30 AM
USDA released their weekly crop progress report on Monday and it continued to show deteriorating crop conditions. The featured map presents the two week change in percent of the corn crop rated as either in poor or very poor condition. The top number is the most recent value with the lower number in brackets representing the two week change in percentage points. Iowa is faring only slightly better than surrounding states, but things are expected to change quickly this week with much warmer temperatures and continued dry conditions. There is hope, at the moment, for a good rainfall this coming weekend, but forecast rain has been fickle to materialize so far this growing season.
Voting: Good - 9 Bad - 0
Thu Jun 15, 2023

Smoke Returns
15 Jun 2023 05:30 AM
Canadian wildfire smoke returned to Iowa on Wednesday evening with the featured webcam image courtesy of the Iowa DOT RWIS station along US-18 near Mason City. It shows the classic smoke filled sunset with the sun appearing as a smooth and dull disc. The weather pattern continues to be conducive for wild fires over Canada with hot and dry conditions dominating. The same flow pattern that is allowing this smoke to visit the state is also generally keeping storm systems away as well, so it is only adding insult to injury at this point.
Voting: Good - 8 Bad - 0
Generate This Chart on Website
Fri Jun 16, 2023
5,500th Daily Feature!
16 Jun 2023 05:30 AM
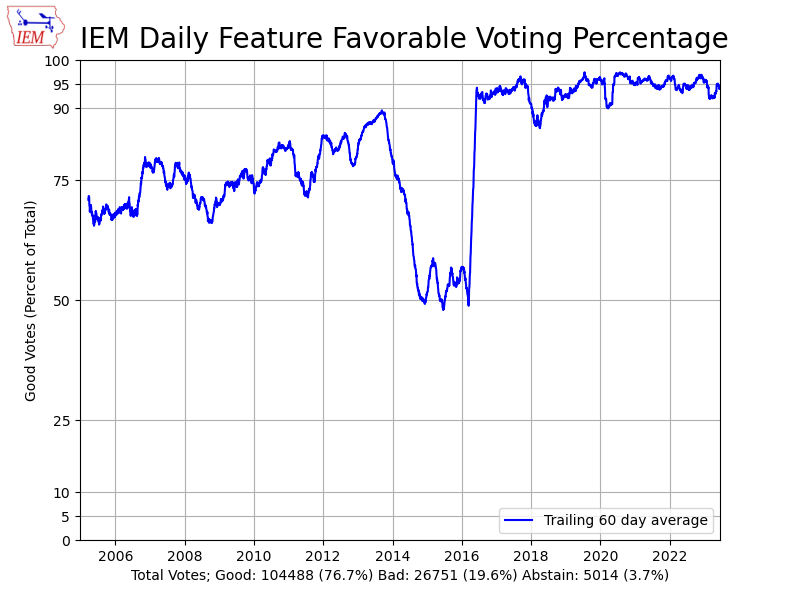
Today's feature is the 5,500th in the series dating back to early 2002! The featured chart presents the percentage of good votes each day since voting was added as an option in 2005. The big drop out between 2012 and early 2016 was unfortunately due to a logic bug with how feature voting was implemented leading to unreliable vote tallying. That aside, hopefully the up and to the right trend with time is an indication of increasing daily feature quality or perhaps it is just audience empathy that I continue this drudgery. The daily feature is meant to highlight something that is hopefully interesting and currently relevant. Whenever possible, it contains a direct link to the IEM app that generated the featured graphic so to promote reproducible science. So I will keep producing these features and please always let me know of any ideas you have for future IEM Daily Features! Thank you.
Voting: Good - 31 Bad - 34
Tags: iem
16 Jun 2023 05:30 AM
Today's feature is the 5,500th in the series dating back to early 2002! The featured chart presents the percentage of good votes each day since voting was added as an option in 2005. The big drop out between 2012 and early 2016 was unfortunately due to a logic bug with how feature voting was implemented leading to unreliable vote tallying. That aside, hopefully the up and to the right trend with time is an indication of increasing daily feature quality or perhaps it is just audience empathy that I continue this drudgery. The daily feature is meant to highlight something that is hopefully interesting and currently relevant. Whenever possible, it contains a direct link to the IEM app that generated the featured graphic so to promote reproducible science. So I will keep producing these features and please always let me know of any ideas you have for future IEM Daily Features! Thank you.
Voting: Good - 31 Bad - 34
Tags: iem
Mon Jun 19, 2023
Weekend Rain Winners
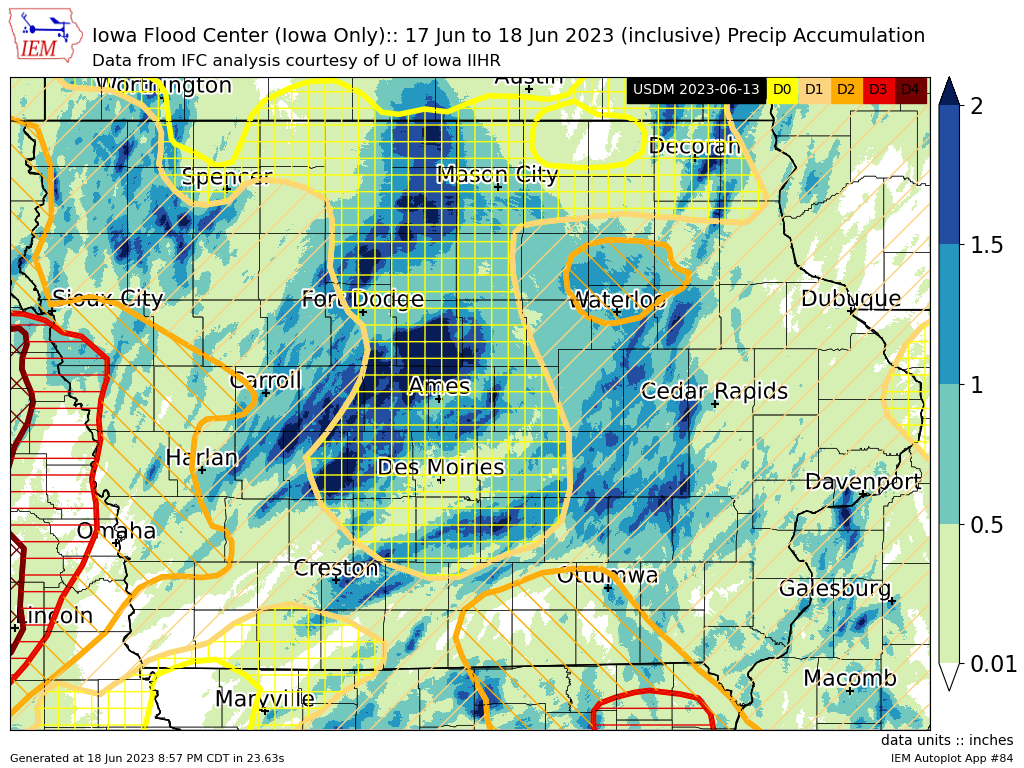
19 Jun 2023 05:30 AM
Much needed rain fell over much of the state this past weekend. The featured map presents the combination of two day precipitation estimates from the University of Iowa Flood Center and the most recent US Drought Monitor. The central portion of the state in the D0 drought classification fared the best, so the bulk of the rain did not exactly fall where it was needed the most. There is also plenty of fine scale variability, so these types of events often lead to significant differences in crop health over small distances over the coming weeks and even with final yield numbers in the fall. We could certainly use more rainfall events like this one, but the bad news is that we have another mostly dry week in store with plenty of sunshine and hot temperatures.
Voting: Good - 13 Bad - 0
Generate This Chart on Website
Tue Jun 20, 2023
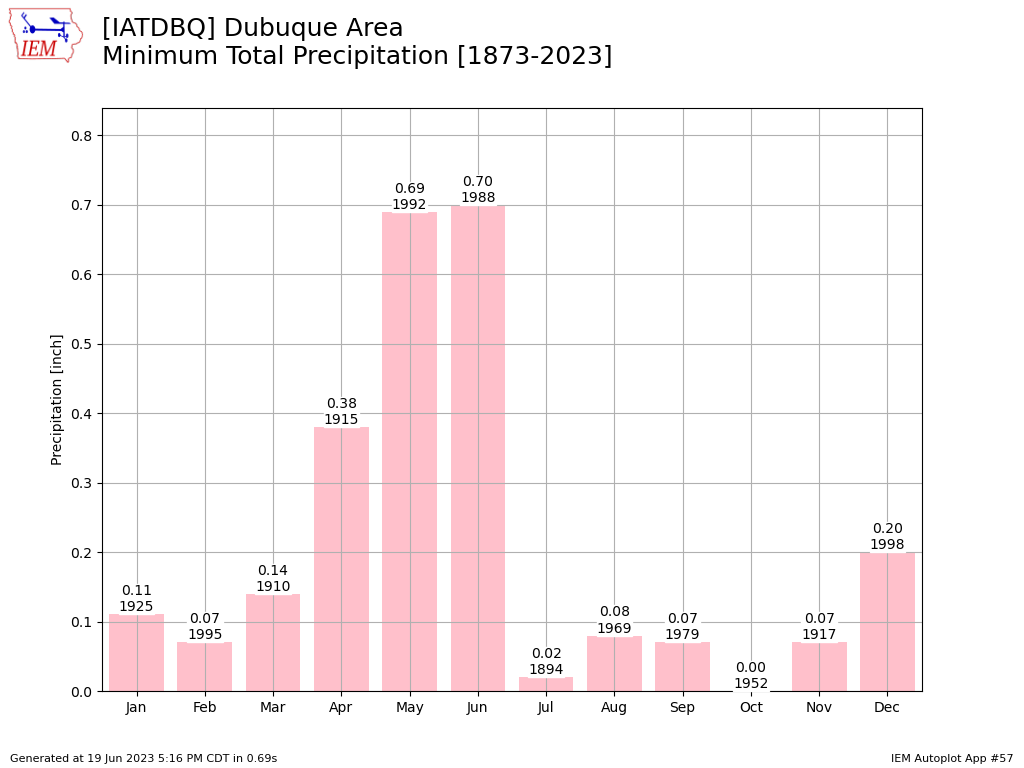
Dubuque Monthly Precip
20 Jun 2023 05:30 AM
With not much for rainfall chances this week and Dubuque sitting at just 0.43 inches for the month of June, perhaps one may wonder if the location has a chance for the driest June on record. The featured chart presents the monthly minimum precipitation records for the site and there is little surprise for the current record holder for June being 1988. Of course, 1988 was a benchmark drought year for the state and it is unnerving to see any comparisons start to appear for this year to that year. There is ten days to go yet this June and rainfall chances are in the forecast for later in the weekend, so hopefully this record can avoid being broken.
Voting: Good - 11 Bad - 0
Generate This Chart on Website
Wed Jun 21, 2023

Sunny as can be
21 Jun 2023 05:30 AM
With high pressure in full control of Iowa's weather and not much for moisture to be found, a cloud was nowhere to be found in the sky on Tuesday. Combined with about the longest daylight time and most direct solar incidence angle, received solar radiation is about as maxed out as it can get! It is difficult to say if we could have set a solar radiation record yesterday as long term solar radiation observations are non-existent and model datasets have their own quirks / availability delays. An illustration of how clear it was can be found by the featured map of analyzed solar radiation totals for the day as derived from the NOAA HRRR model. The single color area over Iowa and slightly beyond is a tell-tale sign of not having any meaningful cloudiness to cause modeled radiation differences. You can see the impact of clouds in other parts of the country as solar radiation values drop off.
Voting: Good - 9 Bad - 0
Generate This Chart on Website
Thu Jun 22, 2023
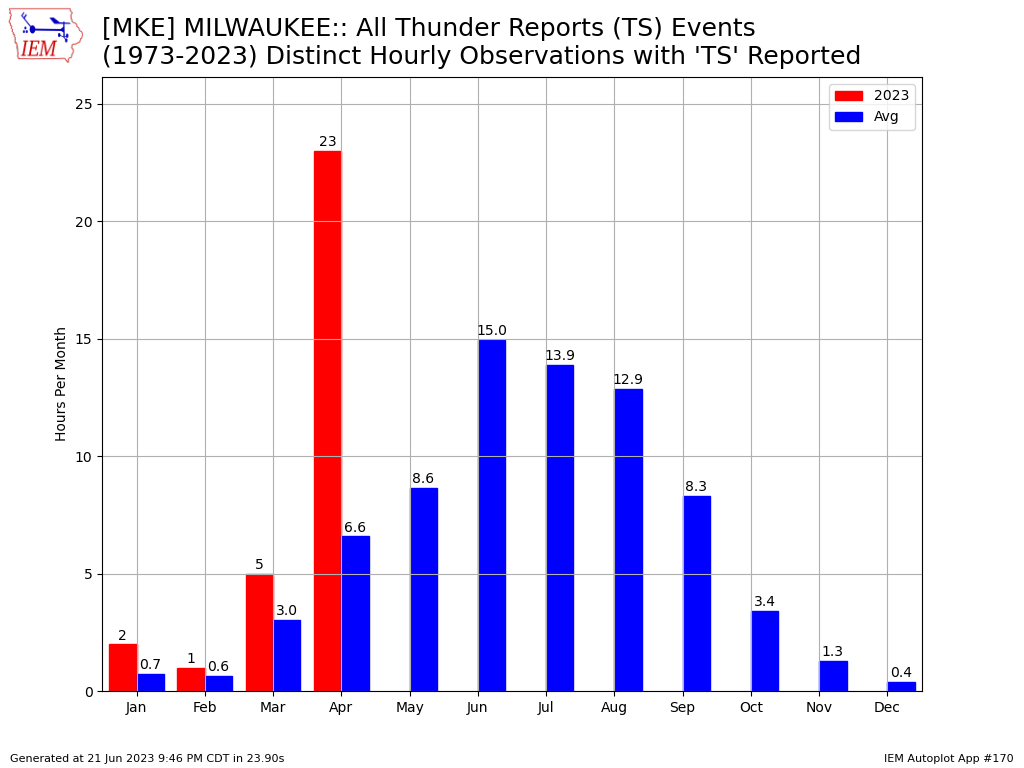
Milwaukee Streak without Thunder
22 Jun 2023 05:30 AM
The lack of thunderstorm activity as of late has contributed to the rapidly worsening drought situation. An example of the lack of thunderstorms can be found by totaling up the number of hours each month that the Milwaukee, Wisconsin ASOS has reported thunderstorm (TS) activity within its METARs. The featured chart shows this year's total along with a crude long term monthly average. The zeros for May and June are remarkable considering the very active April shown with a value well above climatology. The weather forecast models continue to hint that perhaps our messed up weather pattern will shift to something more resembling June next week, but it seems we have been hoping for this shift for the past three weeks. So for completeness with the feature title, the last TS report from Milwaukee was back on 20 April, over two months ago!
Voting: Good - 9 Bad - 0
Generate This Chart on Website
Fri Jun 23, 2023

Drought Change Map
23 Jun 2023 05:30 AM
The US Drought Monitor website is an excellent resource for drought information and has recently added maps showing the weekly change in drought classification. The featured map is courtesy of their website and shows the one week change from last week to this week over the Midwest. For Iowa, no improvements are to be found and plenty of degradation. The rainfall from last weekend mostly missed the driest areas of the state and barely kept up with climatology over the areas that did get rain. Significant rainfall is needed soon and very soon! There are rain chances for this weekend again, so cross all your fingers.
Voting: Good - 20 Bad - 1
Generate This Chart on Website
Mon Jun 26, 2023
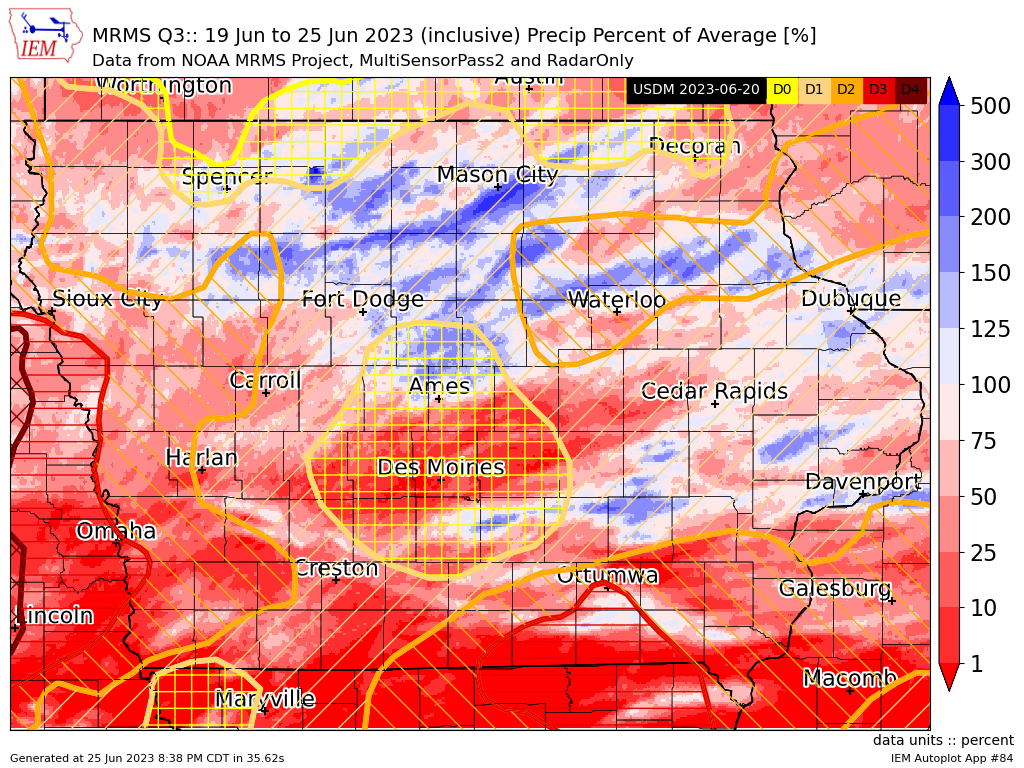
Another Weekend Rainfall
26 Jun 2023 05:30 AM
Last Monday's daily feature looked at the previous weekend's rainfall in relation to the US Drought Monitor. Here we are again on this Monday comparing the weekend rainfall against the US Drought Monitor. The featured map presents percent of average precipitation since the 20th. Since the rainfall on Saturday into Sunday was the only rainfall of this period, the plot is an assessment of where the rainfall had any significant impact over this period. For example, getting a half of an inch on Saturday really isn't all that much when considering the previous week was bone dry and climatology is about an inch. The areas in blue got enough rain over the weekend to top climatology over the past week. Areas in the dark red really missed out over the weekend with far southern and southwestern Iowa faring the worst. There are actually chances for rain during the work week this week, so perhaps we won't need to wait until the weekend. It is definitely crunch time for the corn crop over the next few weeks as it enters a very important development period before and during tasseling.
Voting: Good - 13 Bad - 0
Generate This Chart on Website
Tue Jun 27, 2023
Del Rio Texas Records
27 Jun 2023 05:30 AM
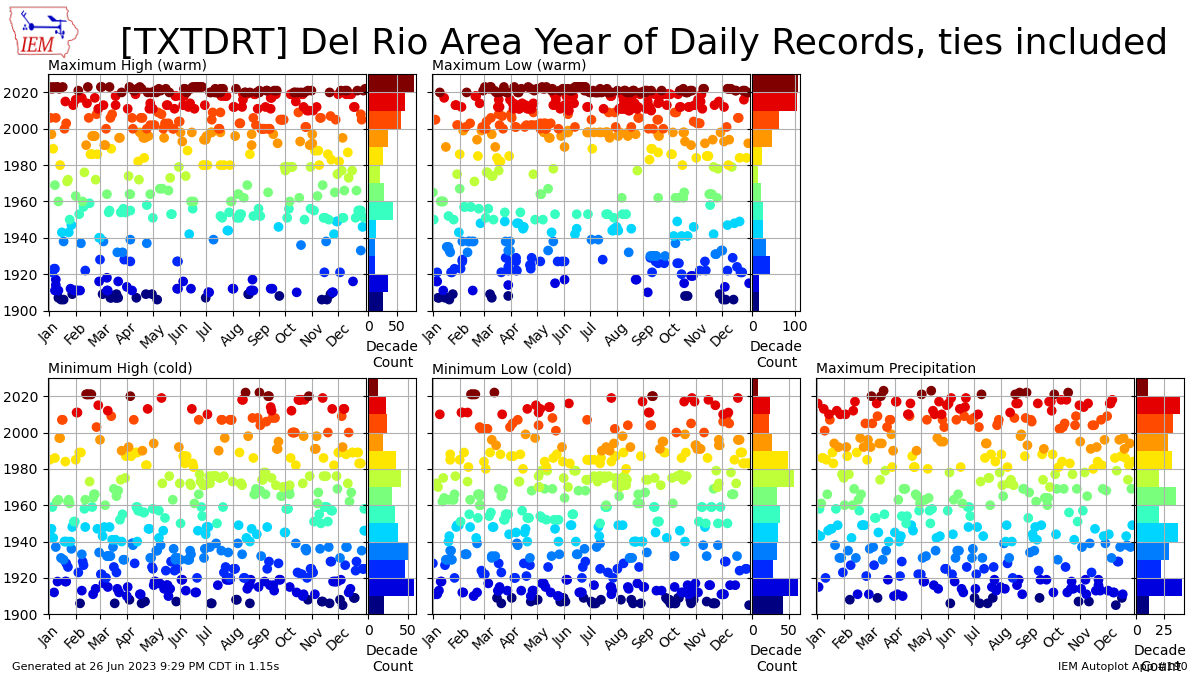
The ongoing heat wave gripping much of Texas has been remarkable. Del Rio, Texas has set a daily high temperature each of the last nine days with a new all time record high of 113 set on the 20th only to be surpassed by two degrees the next day! The featured chart presents the year of current daily records for the site. The small bars to the side count the number of records per decade. Remarkably, the 2020s already have more record high temperatures for the site than any other decade! The site is currently forecast to set another daily record high temperature tomorrow of 109 degrees.
Voting: Good - 10 Bad - 0
Generate This Chart on Website
27 Jun 2023 05:30 AM
The ongoing heat wave gripping much of Texas has been remarkable. Del Rio, Texas has set a daily high temperature each of the last nine days with a new all time record high of 113 set on the 20th only to be surpassed by two degrees the next day! The featured chart presents the year of current daily records for the site. The small bars to the side count the number of records per decade. Remarkably, the 2020s already have more record high temperatures for the site than any other decade! The site is currently forecast to set another daily record high temperature tomorrow of 109 degrees.
Voting: Good - 10 Bad - 0
Generate This Chart on Website
Wed Jun 28, 2023
Day of Smoke
28 Jun 2023 05:30 AM
Outside of the ongoing drought, the biggest weather story this warm season has been the persistent Canadian wildfire smoke that has frequented the state. Yesterday was about as bad as it has gotten so far this year over Eastern Iowa with very poor air quality at the surface. The featured movie is a daytime lapse from the KCRG-TV webcam near the Amana Colonies showing the persistent and at times very thick haze. More of the same is forecast on Wednesday, especially over eastern Iowa again.
Voting: Good - 9 Bad - 2
Tags: video smoke
Generate This Chart on Website
Thu Jun 29, 2023
Summer Visibility Streaks
29 Jun 2023 05:30 AM
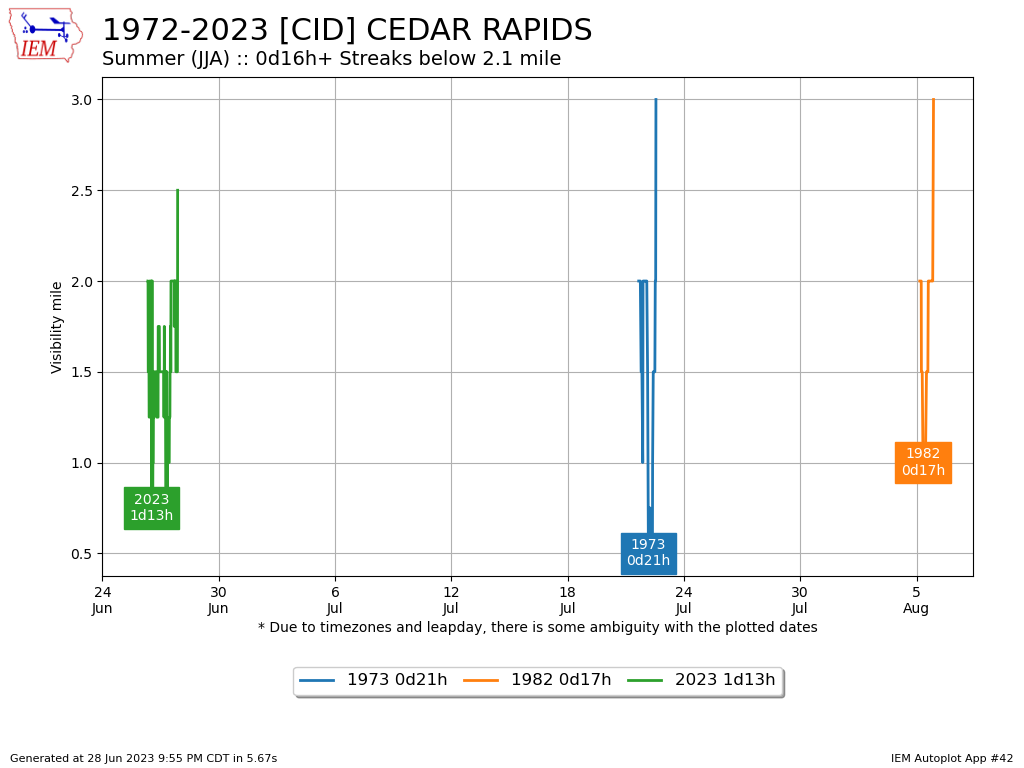
Wednesday was another day of thick smoke over much of the state with conditions again the worst over eastern Iowa. One metric to assess the smoke is surface visibility reports from the airport weather stations. The Cedar Rapids station reported visibility at or below 2 miles starting Tuesday morning and lasted until Wednesday evening making for a streak lasting just over 37 hours. The featured chart presents IEM computed streaks of the site having a visibility of 2 miles or below for at least 16 hours during the summer months. No other streak is to be found lasting even 24 hours, so this current event is very exceptional. Such streaks are much more common during the cold season when low clouds and fog can persist for long periods of time due to limited heating and mixing of the lower atmosphere.
Voting: Good - 9 Bad - 0
Tags: smoke
Generate This Chart on Website
29 Jun 2023 05:30 AM
Wednesday was another day of thick smoke over much of the state with conditions again the worst over eastern Iowa. One metric to assess the smoke is surface visibility reports from the airport weather stations. The Cedar Rapids station reported visibility at or below 2 miles starting Tuesday morning and lasted until Wednesday evening making for a streak lasting just over 37 hours. The featured chart presents IEM computed streaks of the site having a visibility of 2 miles or below for at least 16 hours during the summer months. No other streak is to be found lasting even 24 hours, so this current event is very exceptional. Such streaks are much more common during the cold season when low clouds and fog can persist for long periods of time due to limited heating and mixing of the lower atmosphere.
Voting: Good - 9 Bad - 0
Tags: smoke
Generate This Chart on Website
Fri Jun 30, 2023

Ring of Fire Storms
30 Jun 2023 05:30 AM
A powerful storm complex developed near NE Colorado early Thursday and trucked it east to clip southern Iowa and then deliver a powerful blow to Illinois and Indiana. The system may end up being classified as a derecho for its lengthy in time and space strong winds. Anyway, the storm took a "ring of fire" pathway around the edge of a high pressure system off to the south. The edge is a favored place for such systems to track as the storm is able to feed off of warm and moist air, but can't move toward the high pressure due to very warm temperatures aloft. The featured map is a time composite of base radar reflectivity between 7 PM Wednesday and 7 PM Thursday. The path of the system is readily apparent as it forms the "ring of fire" presentation.
Voting: Good - 31 Bad - 4
Generate This Chart on Website