Past Features
This page lists out the IEM Daily Features for a month at a time. Features have been posted on most days since February 2002. List all feature titles.
Sun Apr 02, 2023
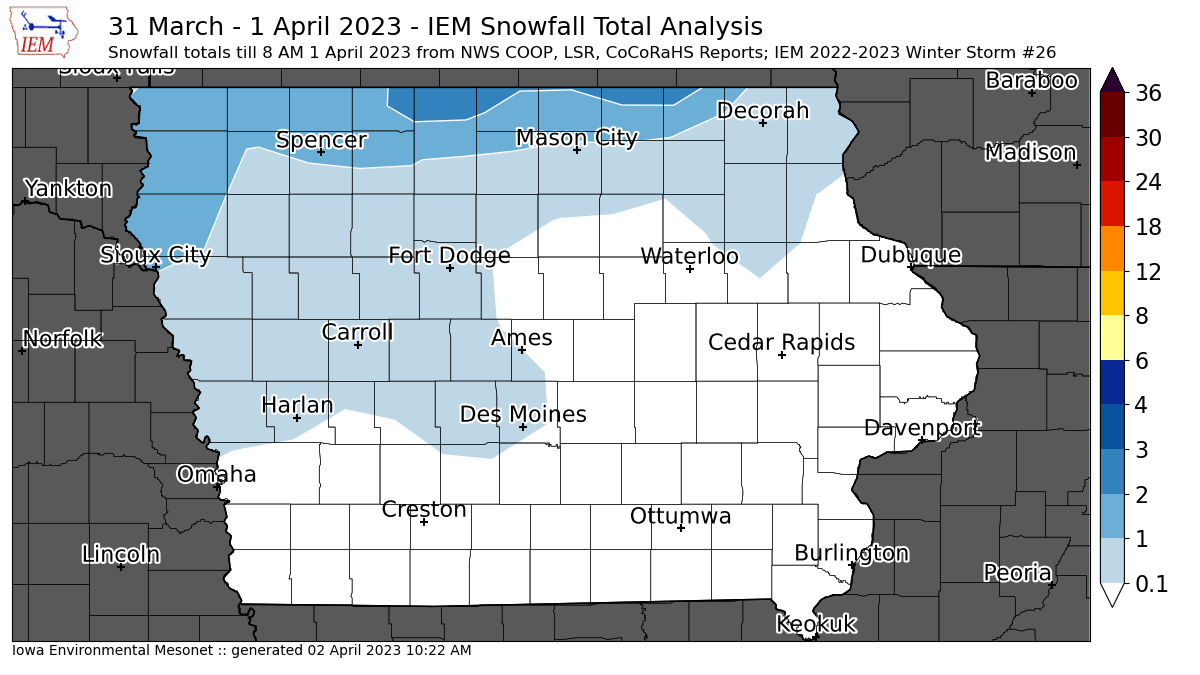
'22-'23 Winter Storm #26
02 Apr 2023 10:28 AM
As a cruel April Fool's joke, the overnight on Friday into Saturday brought some snow to far northern Iowa and was even enough to prompt a Blizzard Warning over portions of far northern Iowa. This was after very warm temperatures on Friday along with strong tornadoes over southeastern Iowa! Snow totals were rather meager and sunshine on Saturday made quick work to remove most of it. Unfortunately, Tuesday into Wednesday of this week looks to repeat what happened with our most recent storm event.
Voting: Good - 115 Bad - 1
Tags: winter2223
Tue Apr 04, 2023

Here we go again
04 Apr 2023 05:43 AM
The featured map presents the current Storm Prediction Center categorical outlook for today. The outlook looks remarkably similar to outlook for last Friday with a large moderate risk centered over southeastern Iowa. The timing and storm coverage is expected to be somewhat different this time, but the chance of a very strong and long lasting tornado appears likely. The storms are expected to get going much later in the afternoon and even after dark than compared with Friday, which will make things even more dangerous. Hopefully this forecast can not verify as nobody wants to see a repeat of the horrible storms from last Friday.
Voting: Good - 23 Bad - 0
Tags: spc
Generate This Chart on Website
Wed Apr 05, 2023

Strong Warm Front
05 Apr 2023 05:29 AM
Tuesday was a another wild day of weather in the state with tornadoes, large hail, damaging winds, and a very strong temperature gradient over the state. The featured chart looks into this gradient by plotting the maximum difference in air temperature by state by hour based on available airport weather station data. Four states along the warm front are highlighted with the maximum hourly value shown in the chart legend. Iowa's 50 degree difference was beat both in Kansas at 59 and an amazing 73 degrees in Nebraska. So your location made a big difference if yesterday felt like summer or it felt like crummy early spring weather. The good news for warm weather lovers is that the forecast continues to be bullish for a significant stretch of warmer weather starting later this week and into next week and beyond.
Voting: Good - 13 Bad - 0
Tags: warmfront
Thu Apr 06, 2023

Watching Soil Temp Response
06 Apr 2023 05:30 AM
It is about that time of year when farmers and even gardeners start to closely monitor soil temperatures to see when conditions become favorable for spring season activities. The featured chart presents a time series of soil temperatures from the Chariton (southcentral Iowa) at 4, 12, 24, and 48 inch depths. The two recent and major air temperature warm-ups on the 31rst and then 4th are readily apparent with the strong warming response at the most shallow depth. Air temperatures did nose dive on Wednesday, but there was some sunshine and the warmth from Tuesday continued to work downward to lower depths. You can see the delayed response of the warming to reach the 24 inch depth sensor. The forecast continues to look favorable for continued soil warming and for dry conditions. The million dollar question is if we can avoid going into May any significant cold and/or wet/chilly stretches that would be troublesome for early planted crops.
Voting: Good - 14 Bad - 0
Generate This Chart on Website
Fri Apr 07, 2023
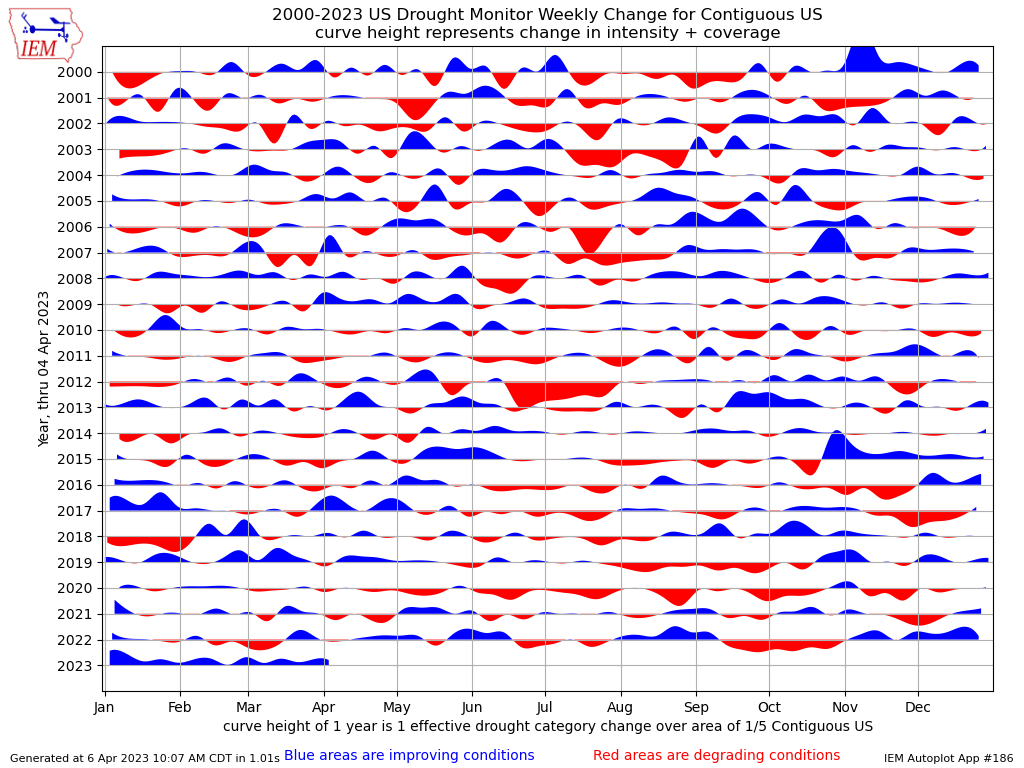
Continued Drought Improvements
07 Apr 2023 05:30 AM
The weekly update to the US Drought Monitor was released yesterday and continued to show overall improvements to analyzed drought over the United States. It has been quite the cold season with numerous "atmospheric rivers" slamming the west coast and record amounts of snow / precipitation over areas of the Midwest and western US. The featured chart presents a smoothed analysis of weekly change in drought coverage over the contiguous US. The magnitude of the filled areas represent the relative amount of change in drought coverage. A unit height represents 1/5th the area of the contiguous US. Since 1 November 2022, we have seen near continuous improvement in drought coverage.
Voting: Good - 13 Bad - 0
Tags: drought
Generate This Chart on Website
Mon Apr 10, 2023
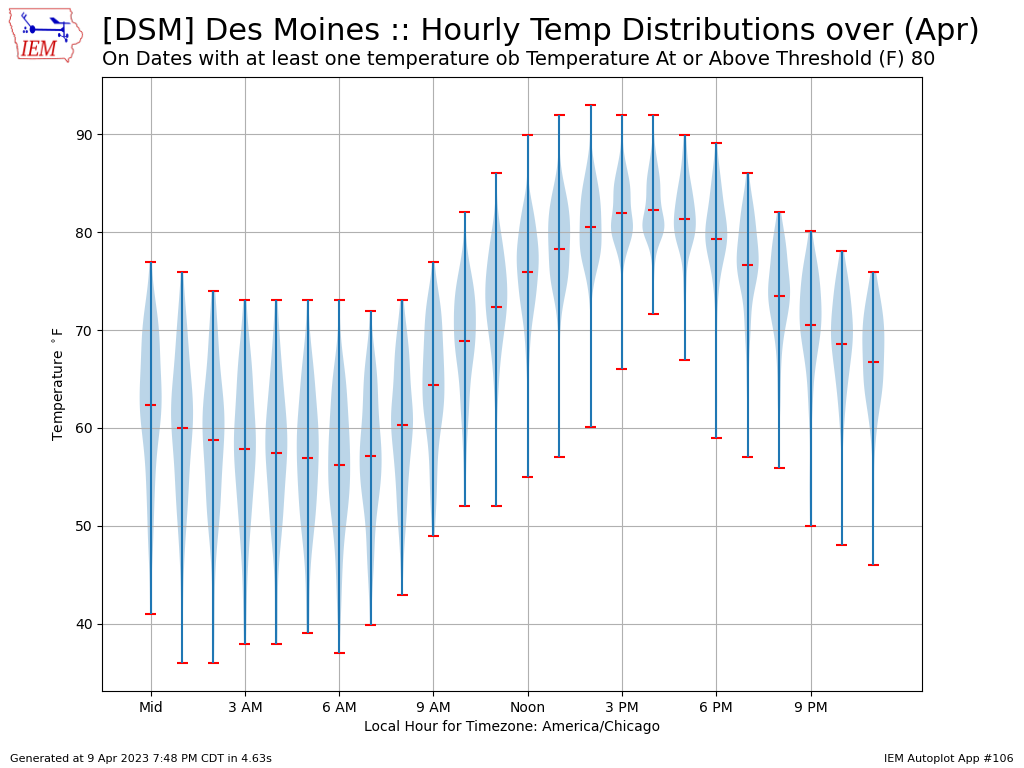
Reaching 80+ in April
10 Apr 2023 05:30 AM
The forecast this week is rather remarkable with a number of chances to reach the 80s! The featured chart looks at the hourly temperature distributions on dates where the high temperature was at least 80 degrees for Des Moines. The distributions are presented as violin charts with increasing width of the violin representation an increasing frequency at the given temperature. The extrema are shown for each hour by the end red ticks and the mean as well. It is rather clear that days with such warm temperatures have very mild overnight temperatures as well. Very few events are shown with lows dipping into the 30s with most of the events showing lows in the 50s. Warm overnight temperatures will certainly help soil temperatures continue their rapid warming this week and make for a very enticing period for farmers to get an early jump on planting.
Voting: Good - 13 Bad - 0
Generate This Chart on Website
Tue Apr 11, 2023

First 80 Degree Date
11 Apr 2023 05:30 AM
The great weather this week rolls on today with even warmer temperatures expected and perhaps the first 80 degree temperature of the year for places like Ames and Des Moines. The featured map presents an IEM analysis of available long term climate sites for the 50th percentile / median date of first 80 degree temperature for the year. These type of plots tend to be a bit noisy due to differenting periods of record and subtle micro-climate difference, but the overall pattern over Iowa can be seen with values ranging from about the first week of April over southwestern Iowa and the end of April for northeastern Iowa.
Voting: Good - 13 Bad - 0
Generate This Chart on Website
Wed Apr 12, 2023
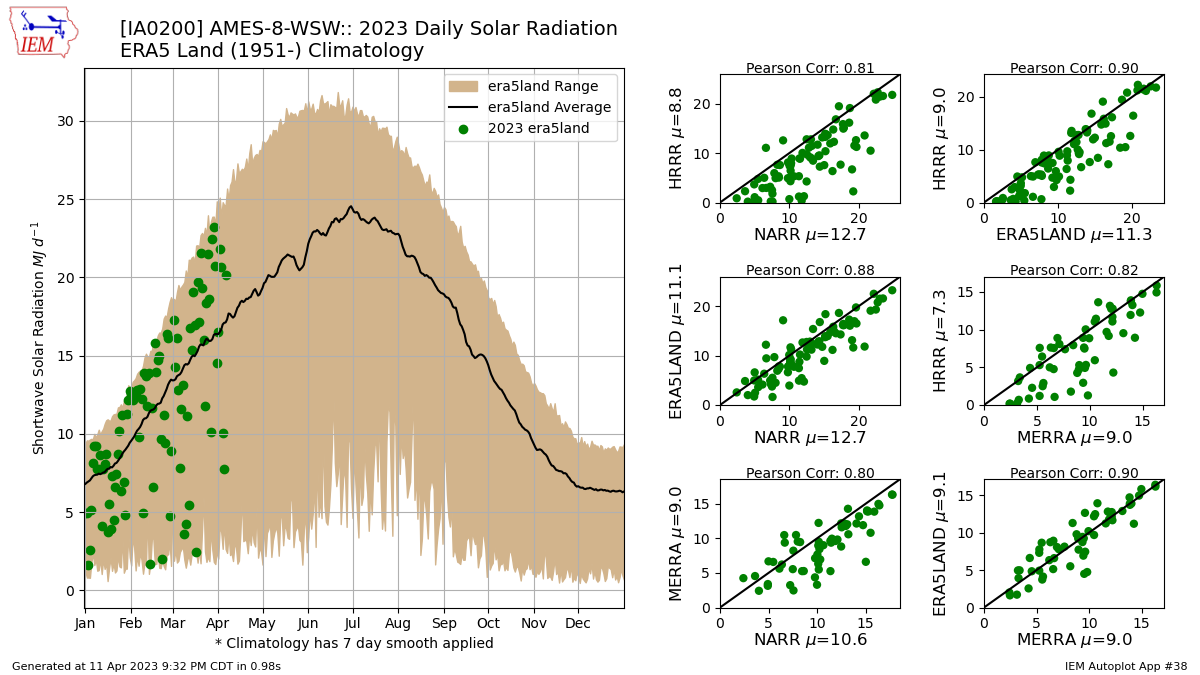
Which model for radiation?
12 Apr 2023 05:30 AM
Received solar radiation is an important variable for many applications including crop growth models and balancing the surface energy budget. Long term and high quality observed solar radiation datasets are extremely rare. A number of reanalysis style model approaches have come into vogue recently and offer such a variable at high spatial and temporal resolution. The IEM processes a number of these and does model grid cell sampling to make available for download along with the long term tracked climate sites. The featured chart compares three of these models and a weather forecast model (hourly HRRR 0-1 hour forecast) for Ames. The left panel shows the range of daily values for ERA5 Land since 1951, a simple smoothed average, and 2023 daily data. The right panels compare the daily values between the various models. So which one is right and which should you use? There's not a simple answer here and the reanalysis datasets have various availability delays to make them not useful for realtime needs (that's why the HRRR data is included as it is "real-time"). With data back to 1951, the ERA5 Land data does look rather intriguing and something you should definitely evaluate for your usage!
Voting: Good - 11 Bad - 0
Tags: solarradiation
Generate This Chart on Website
Thu Apr 13, 2023
Warm Shock
13 Apr 2023 05:30 AM
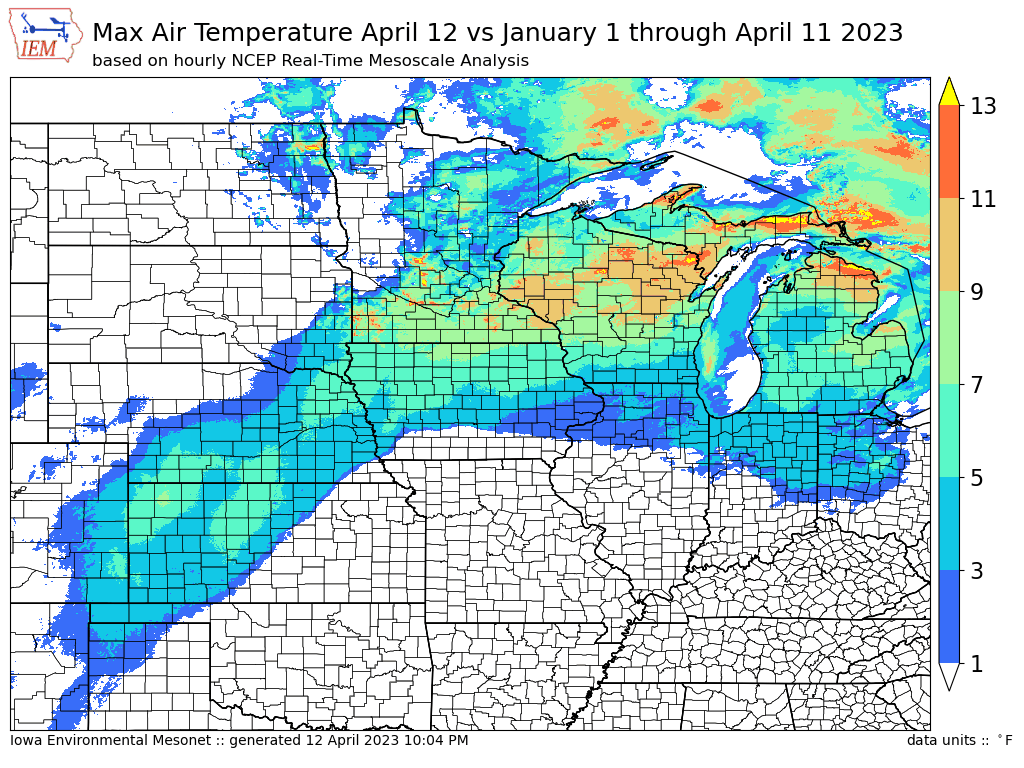
Somehow we have jumped from winter to summer within a week with crazy warmth present again on Wednesday. The featured map presents an analysis of the difference between the warmest hourly temperature between January 1 to April 11 and that of yesterday. This is based on hourly NCEP RTMA (Real-Time Mesoscale Analysis). Much of northern Iowa is shown in the five to nine degree range with higher values found over Wisconsin and Michigan. If you squint closely, you can see some 13+ degree pixels as well. This rapid warm up is trouble for the considerable snowpack that exists to the north of Iowa. Flooding concerns continue to increase.
Voting: Good - 10 Bad - 2
13 Apr 2023 05:30 AM
Somehow we have jumped from winter to summer within a week with crazy warmth present again on Wednesday. The featured map presents an analysis of the difference between the warmest hourly temperature between January 1 to April 11 and that of yesterday. This is based on hourly NCEP RTMA (Real-Time Mesoscale Analysis). Much of northern Iowa is shown in the five to nine degree range with higher values found over Wisconsin and Michigan. If you squint closely, you can see some 13+ degree pixels as well. This rapid warm up is trouble for the considerable snowpack that exists to the north of Iowa. Flooding concerns continue to increase.
Voting: Good - 10 Bad - 2
Fri Apr 14, 2023
Iowa Red Flag Warning
14 Apr 2023 05:30 AM
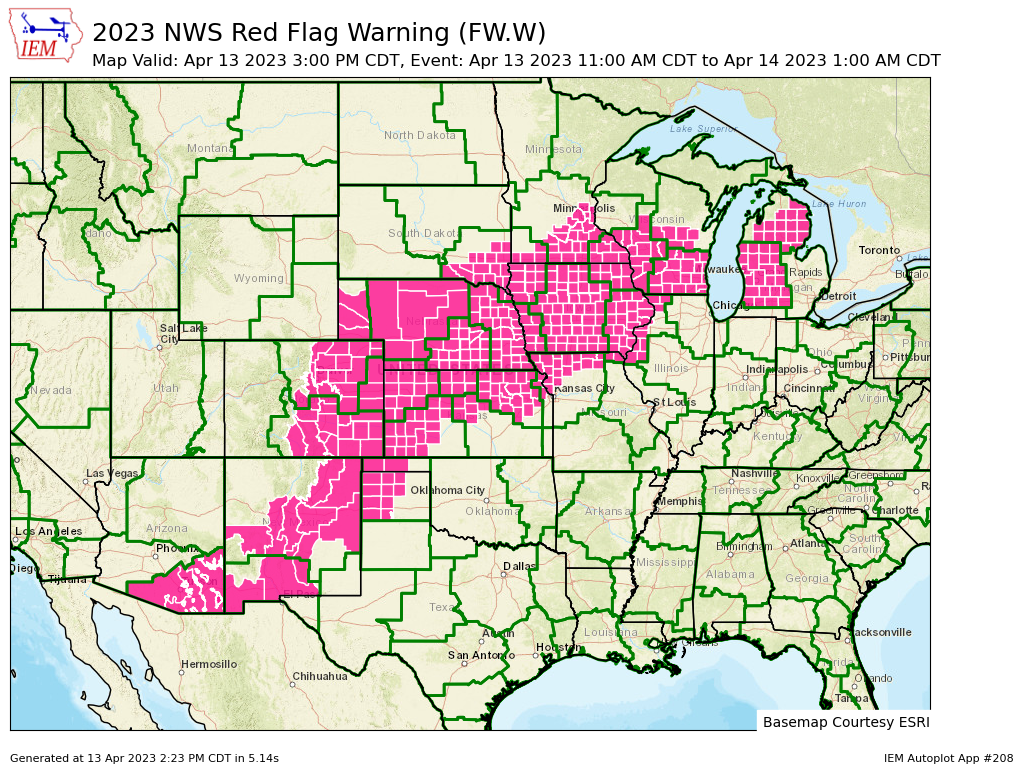
The weather this week has been hot, windy, and low humidity. Combine that with early spring conditions without much yet for greenery and plenty of dead and dry plant materials, you end up with dangerous wind fire conditions. Within the past 10-15 years, the National Weather Service offices covering Iowa have started to more aggressively alert for generous wild fire conditions and one of their available headlines is called a "Red Flag Warning". It is unclear the origin of this term to apply to fire weather, but the association of red being a dangerous color and a flag to fly helps to alert folks outside to take caution. On Wednesday and Thursday, the entire state was simultaneously covered by such an alert for the first time since the statewide inception of this product back in 2014. The featured map presents the areal extent of Red Flag Warnings on Thursday afternoon. We'll have one more day of such hot and dry weather before a return to what we should expect for mid April returns for the weekend and into next week.
Voting: Good - 17 Bad - 1
Tags: redflag
Generate This Chart on Website
14 Apr 2023 05:30 AM
The weather this week has been hot, windy, and low humidity. Combine that with early spring conditions without much yet for greenery and plenty of dead and dry plant materials, you end up with dangerous wind fire conditions. Within the past 10-15 years, the National Weather Service offices covering Iowa have started to more aggressively alert for generous wild fire conditions and one of their available headlines is called a "Red Flag Warning". It is unclear the origin of this term to apply to fire weather, but the association of red being a dangerous color and a flag to fly helps to alert folks outside to take caution. On Wednesday and Thursday, the entire state was simultaneously covered by such an alert for the first time since the statewide inception of this product back in 2014. The featured map presents the areal extent of Red Flag Warnings on Thursday afternoon. We'll have one more day of such hot and dry weather before a return to what we should expect for mid April returns for the weekend and into next week.
Voting: Good - 17 Bad - 1
Tags: redflag
Generate This Chart on Website
Mon Apr 17, 2023
'22-'23 Winter Storm #27
17 Apr 2023 08:16 AM
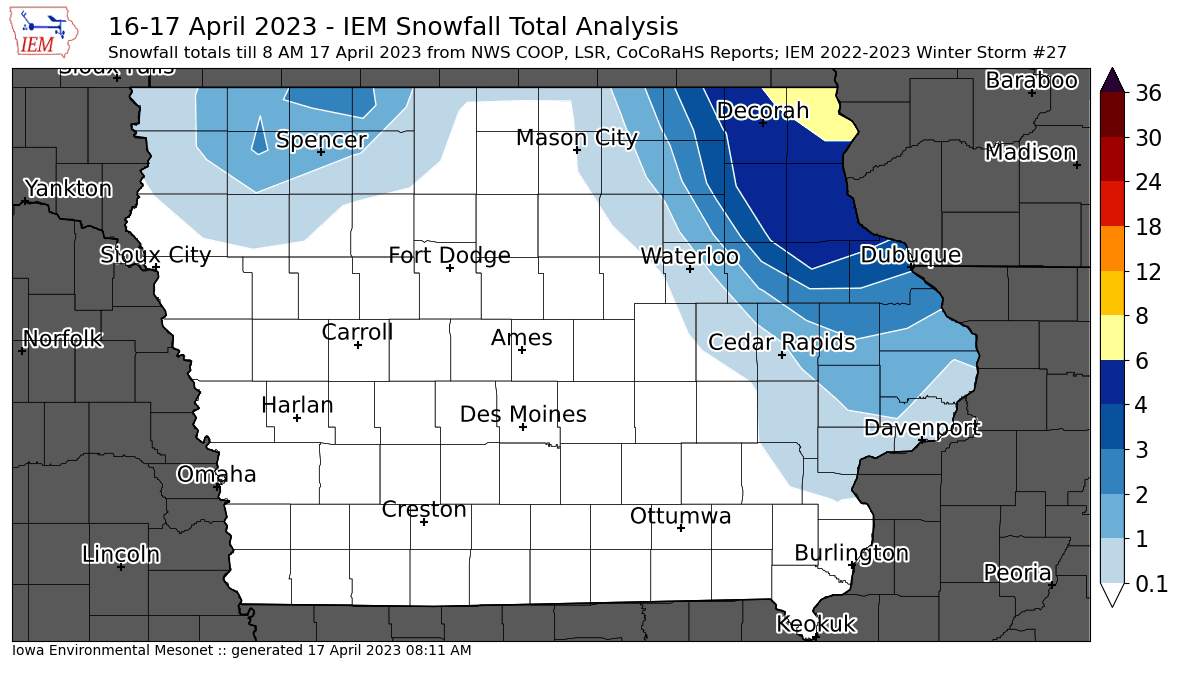
Yikes! The week of high temperatures in the 80s has been replaced by accumulating snow over northern and northeastern Iowa. The featured map is an attempted analysis of available NWS and CoCoRaHS reports. These snowfalls are difficult to measure as much of the snow melted during the day on Sunday. Additionally, the lowest contour interval for this map is 0.1 inches, so all of the locations that reported a Trace of snowfall are not shown by this map. Anyway, far northeastern Iowa got a lot of snow and even higher amounts can be found off to the north and east in Wisconsin. Snow this time of year has very little chance to stick around and the warm soil temperatures from last week will further help to get rid of it. Unfortunately, there is some more cold in the forecast for the upcoming weekend.
Voting: Good - 12 Bad - 2
Tags: winter2223
17 Apr 2023 08:16 AM
Yikes! The week of high temperatures in the 80s has been replaced by accumulating snow over northern and northeastern Iowa. The featured map is an attempted analysis of available NWS and CoCoRaHS reports. These snowfalls are difficult to measure as much of the snow melted during the day on Sunday. Additionally, the lowest contour interval for this map is 0.1 inches, so all of the locations that reported a Trace of snowfall are not shown by this map. Anyway, far northeastern Iowa got a lot of snow and even higher amounts can be found off to the north and east in Wisconsin. Snow this time of year has very little chance to stick around and the warm soil temperatures from last week will further help to get rid of it. Unfortunately, there is some more cold in the forecast for the upcoming weekend.
Voting: Good - 12 Bad - 2
Tags: winter2223
Tue Apr 18, 2023
Away Goes The Snow
18 Apr 2023 05:30 AM
The accumulated snow from Sunday into Monday did not stand much of a chance against warmer air temperatures, warm soil temperatures, and sunshine on Monday. The featured webcam lapse is from the KCRG-TV CityCam in Fayette (northeastern Iowa) and nicely shows the snow melting away as the day progresses. Temperatures will continue to recover this week until another strong shot of cold weather arrives for the weekend. At this point, it seems a hard freeze (temp below 29) is likely over much of the state Saturday Night.
Voting: Good - 11 Bad - 0
Tags: webcam snowcover melting
Generate This Chart on Website
Wed Apr 19, 2023

An Inch over 14 Days
19 Apr 2023 05:30 AM
The featured chart estimates the areal coverage of Iowa receiving at least an inch of precipitation over a trailing fourteen day window. The big precipitation events that frequented the state over the winter season have become a bit more fickle to start off this spring season. This is the time of the year when such events should become more common and help to further recharge soil moisture levels now that the frost is out of the ground. There are at least rainfall chances in the forecast, but it appears that there will be winners and losers much like what happened over most of the 2022 growing season.
Voting: Good - 11 Bad - 2
Generate This Chart on Website
Thu Apr 20, 2023
An Average April
20 Apr 2023 05:30 AM
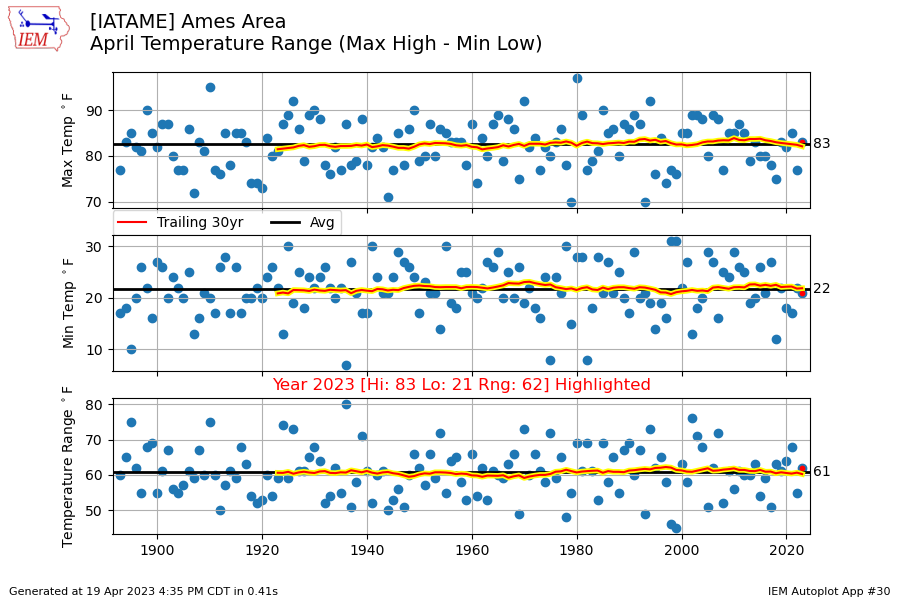
The featured chart presents the max daily high, min daily low, and range between the two temperature each April for Ames. A simple long term average is plotted for all three values and this year's data comes in remarkable close to average for all three! The present forecast does not have much hope for challenging the high of 83, but perhaps Saturday night will take a run at the low of 21. The red line represents a trailing 30 year average and there's not much trend to be seen for these metrics.
Voting: Good - 12 Bad - 0
Generate This Chart on Website
20 Apr 2023 05:30 AM
The featured chart presents the max daily high, min daily low, and range between the two temperature each April for Ames. A simple long term average is plotted for all three values and this year's data comes in remarkable close to average for all three! The present forecast does not have much hope for challenging the high of 83, but perhaps Saturday night will take a run at the low of 21. The red line represents a trailing 30 year average and there's not much trend to be seen for these metrics.
Voting: Good - 12 Bad - 0
Generate This Chart on Website
Fri Apr 21, 2023
Awaiting Warmer Temps
21 Apr 2023 05:30 AM
One of the more popular plots on the IEM website is a map of yesterday's four inch soil temperatures. It combines ISU Soil Moisture Network observations with a NWS weather model analyses. The page that provides that map has recently been updated to include a similar style plot of forecast soil temperatures from the NWS Global Forecast System (GFS). The featured loop presents a recent single run of the GFS model forecast out to early May with the average daily soil temperature at approximately four inch depth shown. This model run shows chilly temperatures over the coming days and a wait until early May for warmer temperatures to return.
Voting: Good - 19 Bad - 0
Generate This Chart on Website
Mon Apr 24, 2023

Chilly April Weekend
24 Apr 2023 08:24 AM
Temperatures were rather chilly for mid to late April over this past weekend. Given the significant warmth we received earlier this April, the cold temperatures over the weekend were likely not good for many plants that got an early start to the growing season. As such, the NWS issued a number of Freeze alerts to cover the event. The featured map presents the minimum temperature found within the 15 minute interval high-resolution temperature analysis from the NCEP Rapid-Update Real-Time Mesoscale Analysis since Friday morning. There's quite a bit of variability shown over Iowa as the model is likely trying to capture fine-scale microclimate effects driven by topography and vegetation differences. Unfortunately, we are not done with the cold yet as more near to sub freezing temperatures are in the forecast.
Voting: Good - 12 Bad - 1
Generate This Chart on Website
Tue Apr 25, 2023

Chilly End to April
25 Apr 2023 05:30 AM
The warmth earlier this month is becoming a distant memory as chilly weather has mostly dominated since about the 15th. The forecast now into May looks to continue this weather and is frustrating for those with crops planted and those that wish to soon do so. The featured map presents an IEM calculated growing degree day departure over the next seven days using the NWS grid forecast information and a computed GDD climatology. Only very isolated areas are shown with an above average accumulation. Average daily accumulations this time of year are somewhere around 5-10 units, so a departure of 20 would indicate falling behind by two to three days over this period.
Voting: Good - 11 Bad - 1
Generate This Chart on Website
Wed Apr 26, 2023
Daily GDD Forecast
26 Apr 2023 05:30 AM
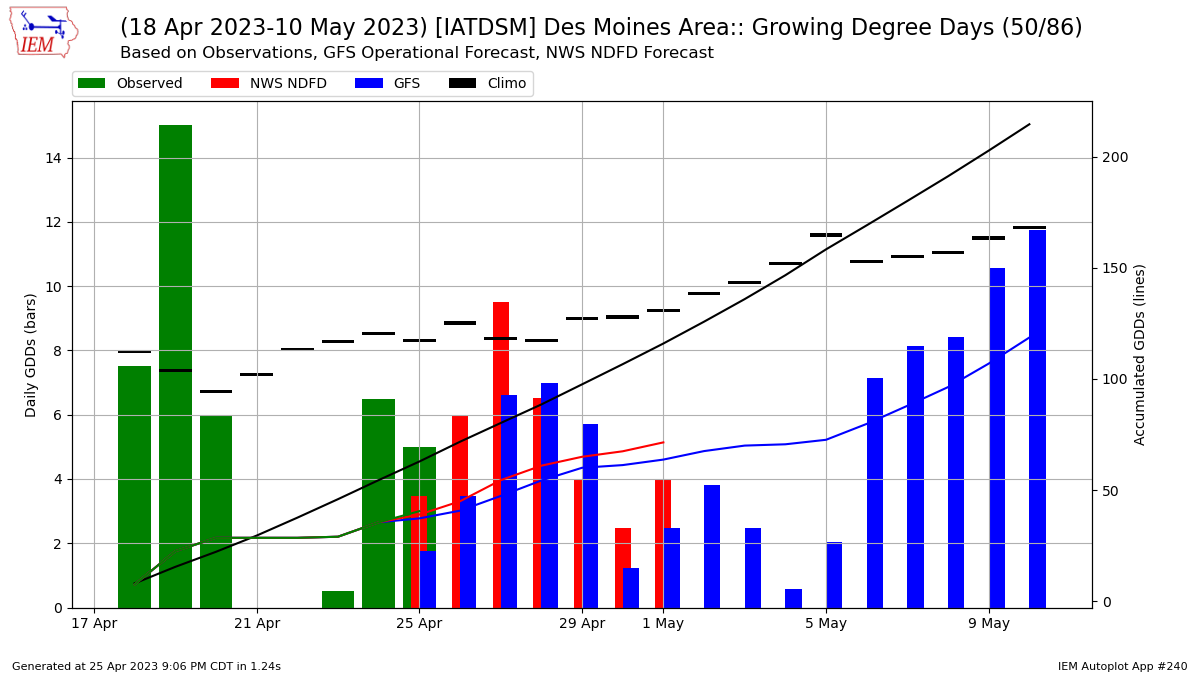
The featured chart has a lot going on and taken from a newly added IEM autoplot that combines recent daily Growing Degree Day (GDD) observations along with two NWS forecasts. The chart is for Des Moines and shows the past eight days of GDD observations [green bars/line] along with a seven day forecast from the NWS National Digital Forecast Database (NDFD) [red] and a single deterministic forecast from the NWS Global Forecast System (GFS) [blue] out sixteen days or so. The climatology is shown by the floating black bars and line. Whew, so what is the point of all this? There isn't much optimism to be found that we'll see significant GDD accumulations over this period. Almost all the daily data is well below average and the accumulated values for the GFS model on 10 May is about half of average. It certainly did not help that the most recent weekend saw 0 GDDs for a base 50 degree calculation.
Voting: Good - 8 Bad - 1
Tags: gdd
Generate This Chart on Website
26 Apr 2023 05:30 AM
The featured chart has a lot going on and taken from a newly added IEM autoplot that combines recent daily Growing Degree Day (GDD) observations along with two NWS forecasts. The chart is for Des Moines and shows the past eight days of GDD observations [green bars/line] along with a seven day forecast from the NWS National Digital Forecast Database (NDFD) [red] and a single deterministic forecast from the NWS Global Forecast System (GFS) [blue] out sixteen days or so. The climatology is shown by the floating black bars and line. Whew, so what is the point of all this? There isn't much optimism to be found that we'll see significant GDD accumulations over this period. Almost all the daily data is well below average and the accumulated values for the GFS model on 10 May is about half of average. It certainly did not help that the most recent weekend saw 0 GDDs for a base 50 degree calculation.
Voting: Good - 8 Bad - 1
Tags: gdd
Generate This Chart on Website
Thu Apr 27, 2023
2023 Daily GDD Departures
27 Apr 2023 05:30 AM
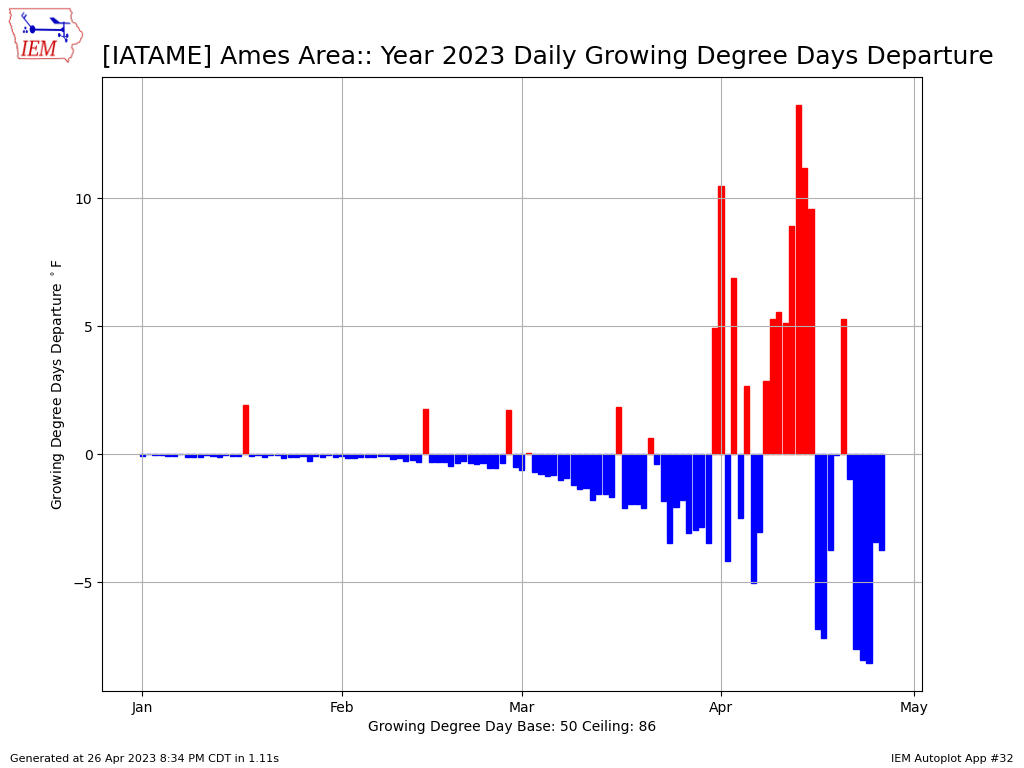
The old saying goes that if you set your expectations low, it is difficult to be disappointed. The same can sort of be applied to growing degree days (GDD) as illustrated by the featured chart. The chart presents the daily GDD departures from average for Ames. During March and early April, not much is expected for GDDs as the climatological accumulation is very low. But now that we are to the end of April, expectations are much higher and so daily disappointments can be of larger magnitude! The increase in more negative blue bars is evident and only one positive departure day over the past 12 days or so.
Voting: Good - 10 Bad - 0
Generate This Chart on Website
27 Apr 2023 05:30 AM
The old saying goes that if you set your expectations low, it is difficult to be disappointed. The same can sort of be applied to growing degree days (GDD) as illustrated by the featured chart. The chart presents the daily GDD departures from average for Ames. During March and early April, not much is expected for GDDs as the climatological accumulation is very low. But now that we are to the end of April, expectations are much higher and so daily disappointments can be of larger magnitude! The increase in more negative blue bars is evident and only one positive departure day over the past 12 days or so.
Voting: Good - 10 Bad - 0
Generate This Chart on Website
Fri Apr 28, 2023

Mississippi River Flooding
28 Apr 2023 05:30 AM
It was an epic winter for accumulating snowfall to the north of Iowa. Much of this snowfall has melted and is now flowing south via the Mississippi River to produce flooding. It is somewhat fortunate that dry weather in Iowa and elsewhere this month has not added to stream flows. The featured chart presents recent USGS/NWS stage observations and forecasts for Guttenburg (northeastern Iowa). It shows a forecast crest happening Friday/Saturday and then receding afterwards. The crest reaching 21 feet would put it into "major flooding" category. These forecasts make assumptions about expected rainfall and rainfall runoff impacts take time to reach the Mississippi, so near-term unexpected heavy rainfall events and future events currently outside of the forecast window will impact future river stage observations.
Voting: Good - 18 Bad - 0
Tags: flood mississippi
Generate This Chart on Website