Past Features
This page lists out the IEM Daily Features for a month at a time. Features have been posted on most days since February 2002. List all feature titles.
Wed Mar 01, 2023
Wet January and February
01 Mar 2023 05:30 AM
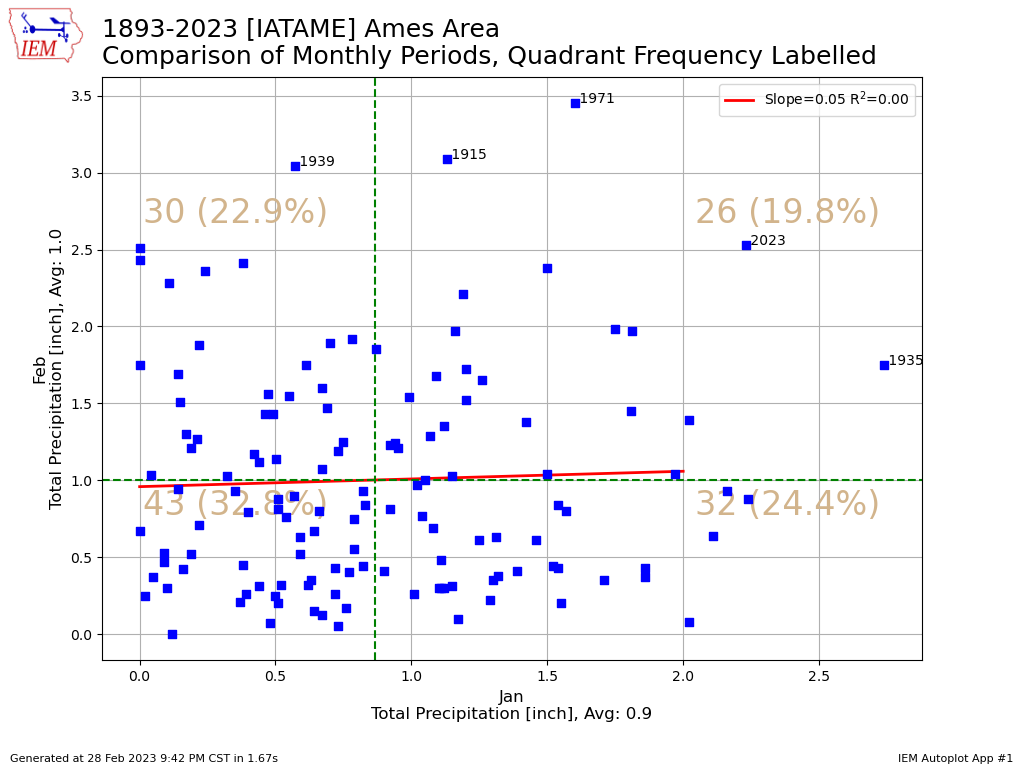
The featured chart presents the yearly combination of January precipitation vs February precipitation for Ames. Some statistical measures are shown on the plot attempting to tease out any relationship between these two variables, which there is none. What's interesting about this plot is the dot shown for 2023. The year features the first combination of January and following February with monthly precipitation totals both over two inches for Ames! A few of the other extreme years are labelled on the chart as well with the most recent comparable being 1971. Our first chance of precipitation for March arrives Thursday evening as another blockbuster storm winds up to our south and perhaps spins some winter weather our way.
Voting: Good - 9 Bad - 0
Tags: 2023
Generate This Chart on Website
01 Mar 2023 05:30 AM
The featured chart presents the yearly combination of January precipitation vs February precipitation for Ames. Some statistical measures are shown on the plot attempting to tease out any relationship between these two variables, which there is none. What's interesting about this plot is the dot shown for 2023. The year features the first combination of January and following February with monthly precipitation totals both over two inches for Ames! A few of the other extreme years are labelled on the chart as well with the most recent comparable being 1971. Our first chance of precipitation for March arrives Thursday evening as another blockbuster storm winds up to our south and perhaps spins some winter weather our way.
Voting: Good - 9 Bad - 0
Tags: 2023
Generate This Chart on Website
Thu Mar 02, 2023
Sunday/Monday Runoff
02 Mar 2023 05:30 AM
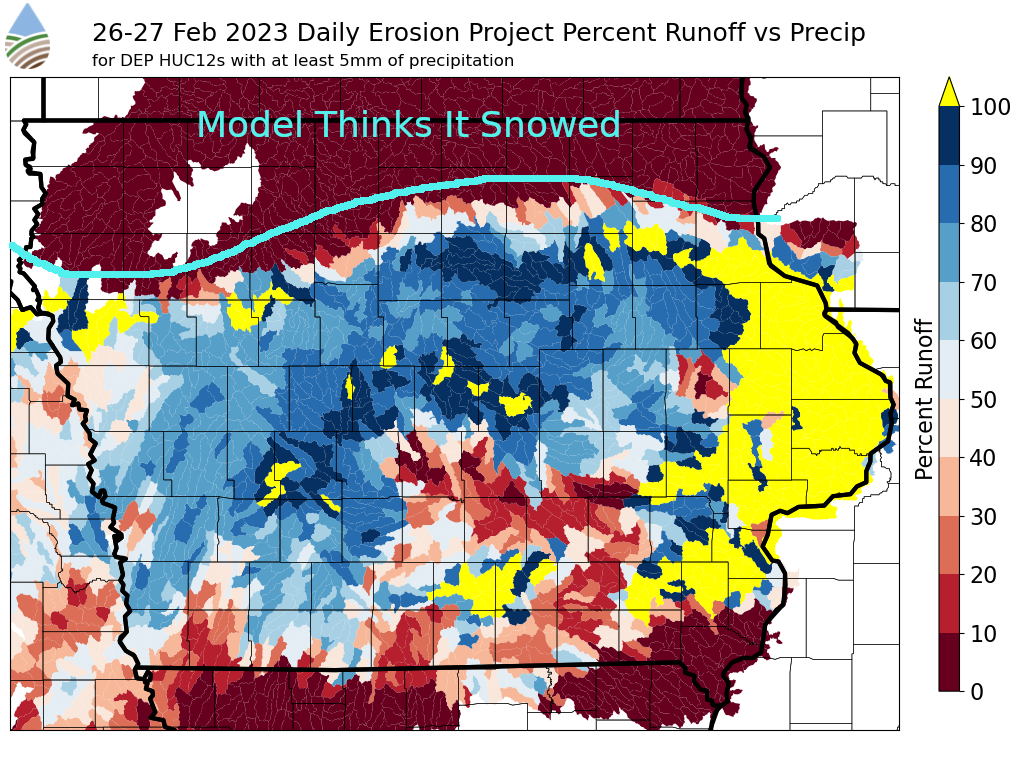
Sunday night and into Monday of this week featured a significant rainfall event with a number of locations receiving over an inch of rain. A big question is how much of this rainfall infiltrated the ground vs immediate run off due to frozen soils. You have generally have guessed an answer to this by observing the various nearby rivers running at bankful or not after the event. Anyway, the Daily Erosion Project (an ISU research project closely tied with the IEM) runs a physical model called WEPP that attempts to use real-world inputs to analyze soil erosion on a daily time step. The featured map presents an output from this model system with the plotted ratio between water runoff and precipitation for the two day event. An immediate caveat is that the red area over northern Iowa is likely poorly simulated with model producing too much snow vs rainfall for the event. The rest of the area is extremely interesting with runoff percentages shown at very high values and even above 100% (snowpack being melted) due to frozen soils. There are areas south and east of Des Moines that indicate much of the rainfall did infiltrate due to model analyzing the frost being mostly gone. Areas further south in the red are likely completely frost free and good infiltration did occur.
Voting: Good - 11 Bad - 0
Tags: dep
Generate This Chart on Website
02 Mar 2023 05:30 AM
Sunday night and into Monday of this week featured a significant rainfall event with a number of locations receiving over an inch of rain. A big question is how much of this rainfall infiltrated the ground vs immediate run off due to frozen soils. You have generally have guessed an answer to this by observing the various nearby rivers running at bankful or not after the event. Anyway, the Daily Erosion Project (an ISU research project closely tied with the IEM) runs a physical model called WEPP that attempts to use real-world inputs to analyze soil erosion on a daily time step. The featured map presents an output from this model system with the plotted ratio between water runoff and precipitation for the two day event. An immediate caveat is that the red area over northern Iowa is likely poorly simulated with model producing too much snow vs rainfall for the event. The rest of the area is extremely interesting with runoff percentages shown at very high values and even above 100% (snowpack being melted) due to frozen soils. There are areas south and east of Des Moines that indicate much of the rainfall did infiltrate due to model analyzing the frost being mostly gone. Areas further south in the red are likely completely frost free and good infiltration did occur.
Voting: Good - 11 Bad - 0
Tags: dep
Generate This Chart on Website
Fri Mar 03, 2023
2023 Big Precipitation Events
03 Mar 2023 05:30 AM
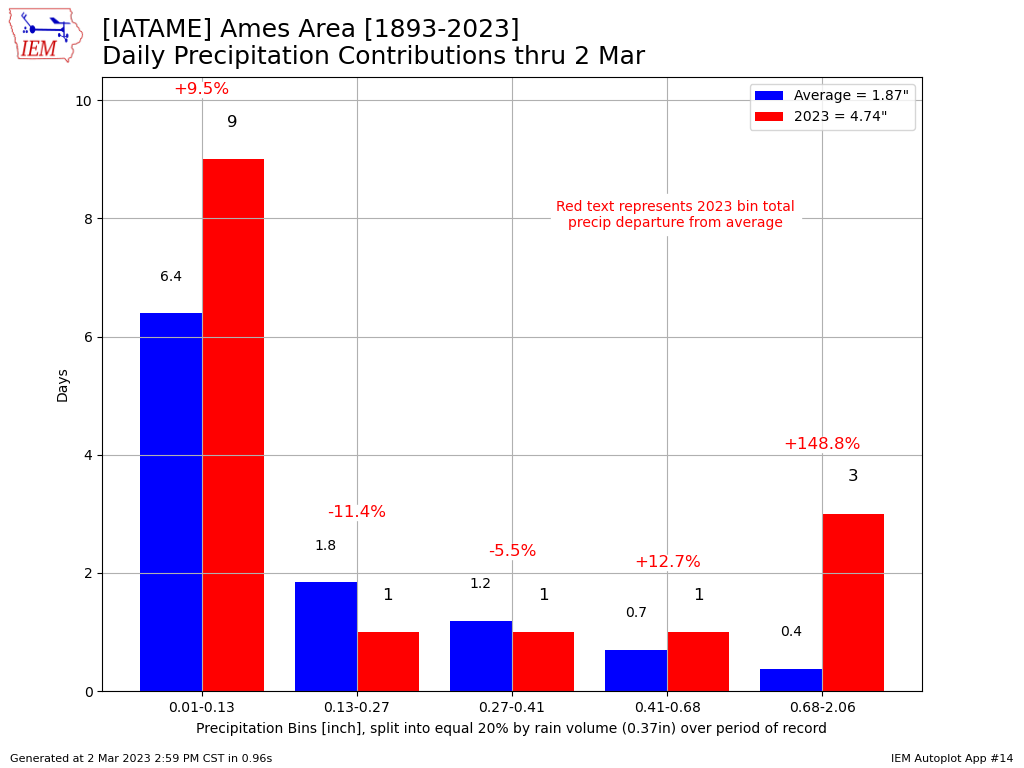
Precipitation totals for Ames and most other places in Iowa have gotten off to a fast start this year. The featured chart illustrates this by partitioning up the year to date precipitation into approximately equal volume bins. These bins were created based on period of record data. The 2023 totals are plotted as number of events (~days) with the percentage departure denoting how much over average that given partition has been for the year. You can see the big reason why our totals this year are well above average are due to the three big precipitation events in the right most bin. The intermediate partitions are barely above or even below average.
Voting: Good - 13 Bad - 1
Generate This Chart on Website
03 Mar 2023 05:30 AM
Precipitation totals for Ames and most other places in Iowa have gotten off to a fast start this year. The featured chart illustrates this by partitioning up the year to date precipitation into approximately equal volume bins. These bins were created based on period of record data. The 2023 totals are plotted as number of events (~days) with the percentage departure denoting how much over average that given partition has been for the year. You can see the big reason why our totals this year are well above average are due to the three big precipitation events in the right most bin. The intermediate partitions are barely above or even below average.
Voting: Good - 13 Bad - 1
Generate This Chart on Website
Mon Mar 06, 2023

29 Years of NEXRAD Mosaics
06 Mar 2023 05:36 AM
One of the unique datasets that the IEM curates is a mosaic of NWS NEXRAD imagery. These spatially and temporally consistent mosaics provide a nice overview and allow for simple visual details on precipitation patterns over the US. The IEM has an archive of these mosaics dating back to 1995 with the featured map showing a postage stage presentation of the data for each year at 5 AM on 6 March. It is kind of neat to be able to quickly contrast the previous years with what is happening this morning. In fact, the RADAR this morning is about the most active for any year at this date and time since 1995!
Voting: Good - 13 Bad - 0
Tags: nexrad
Generate This Chart on Website
Tue Mar 07, 2023
Limited Spring Flooding So Far
07 Mar 2023 05:30 AM
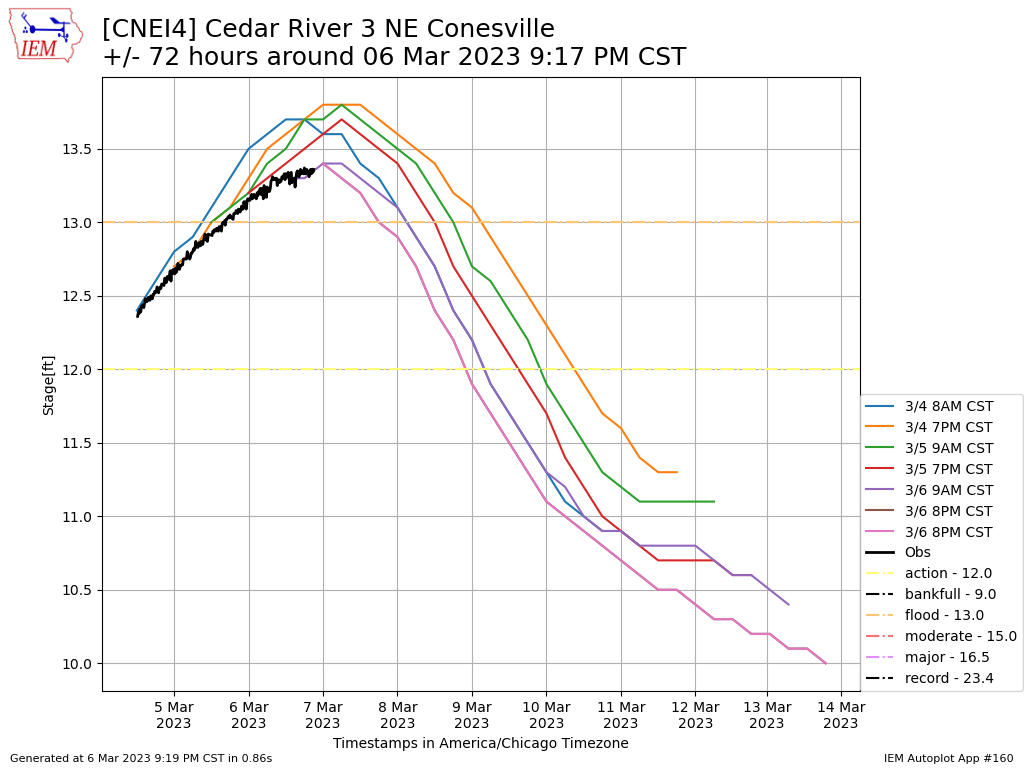
This year has featured a number of heavy precipitation events, but flooding has been limited thus far and likely thanks to the low stream flows that existed yet from last year's drought. The featured chart presents river stage observations and NWS forecasts from a site along the Cedar River near Conesville (SE Iowa). The black line shows the stage reports and they are currently just above minor flood stage. The sloping colorful lines represent sequential NWS forecasts and they continue to trend downward.
Voting: Good - 12 Bad - 0
Generate This Chart on Website
07 Mar 2023 05:30 AM
This year has featured a number of heavy precipitation events, but flooding has been limited thus far and likely thanks to the low stream flows that existed yet from last year's drought. The featured chart presents river stage observations and NWS forecasts from a site along the Cedar River near Conesville (SE Iowa). The black line shows the stage reports and they are currently just above minor flood stage. The sloping colorful lines represent sequential NWS forecasts and they continue to trend downward.
Voting: Good - 12 Bad - 0
Generate This Chart on Website
Wed Mar 08, 2023
Below 40 during March
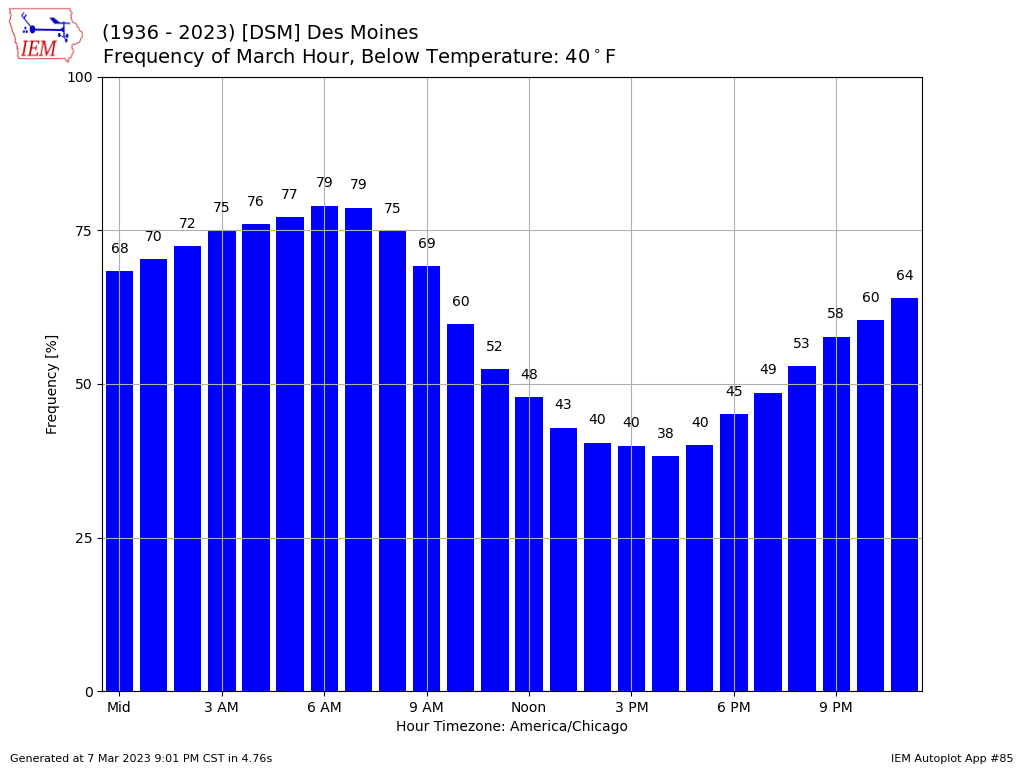
08 Mar 2023 05:30 AM
The weather during the month of March can be a bit confusing in Iowa. While we are now outside of the coldest 90 day period of the year, the daylight time is noticeable longer, and vegetative signs of spring are ever increasing; we are still in a month that can see plenty of snowfall and cold. The featured chart presents the hourly frequency of having an air temperature below 40 degrees. The near term forecast has plenty of such hours in store along with a snowstorm for northern Iowa on Thursday.
Voting: Good - 10 Bad - 1
Generate This Chart on Website
Thu Mar 09, 2023
Winter Sub-Zero Low Days
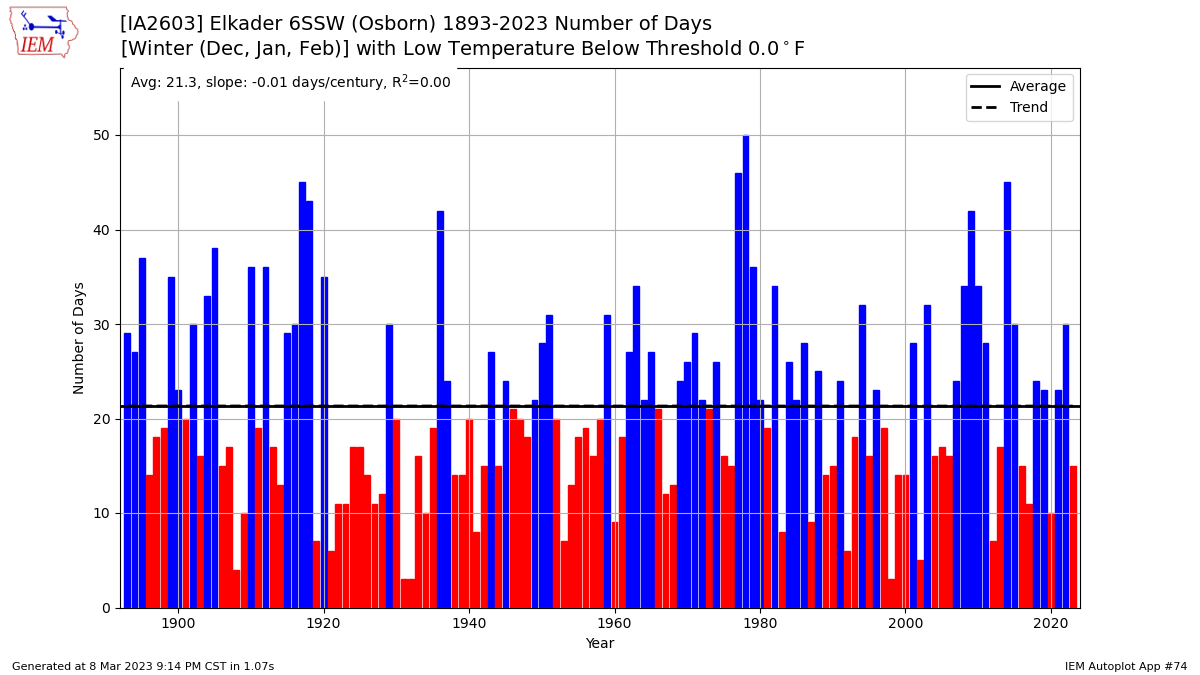
09 Mar 2023 05:30 AM
Even with a snow producing winter storm today, temperatures will not be all that bad and the near term forecast does not have much for extreme cold for early March. The featured chart checks in on the winter season (Dec through Feb) total number of days with a daily low temperature below 0 degrees Fahrenheit for a site near Elkader (far NE Iowa). This particular site is notorious for having the coldest temperature in Iowa during the winter season thanks to its location in a valley with cold air settling in during calm conditions. The chart also plots a simple period of record average and a linear fit trend line, which does not show much trend for this site. The most recent two decades have seen both extremes of having many or few such days each winter season.
Voting: Good - 10 Bad - 0
Generate This Chart on Website
Fri Mar 10, 2023
'22-'23 Winter Storm #20
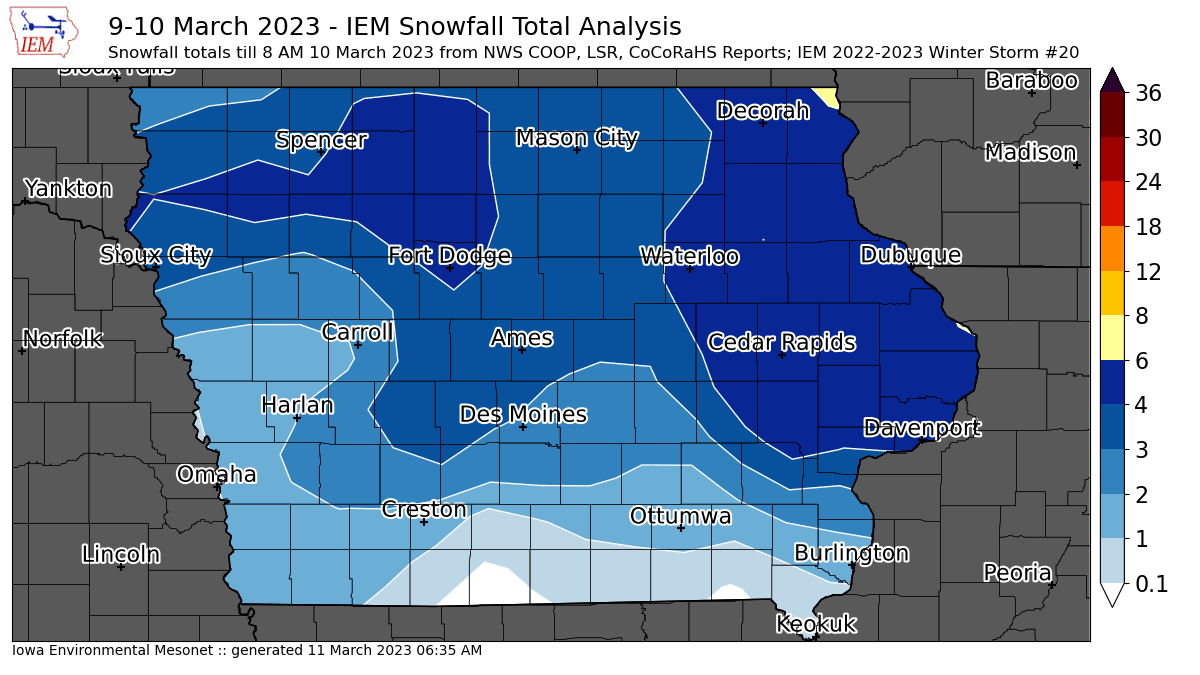
10 Mar 2023 07:11 AM
Measuring snowfall is often not easy! Sometimes the snow is fluffy and wind blows it into uneven piles. Sometimes the snow falls as a slushy mess with melting and compaction both working to reduce its depth. Early spring season snowfalls during daylight hours can receive significant melting even with cloudy conditions as solar insolation will heat the surface. So measuring the snowfall from Thursday is fraught with peril and the featured map will need updated later today as more reports are received and a better analysis can be made. The highest totals were found over far eastern Iowa with a few reports of six inches made.
Voting: Good - 9 Bad - 1
Tags: winter2223
Sun Mar 12, 2023
'22-'23 Winter Storm #21
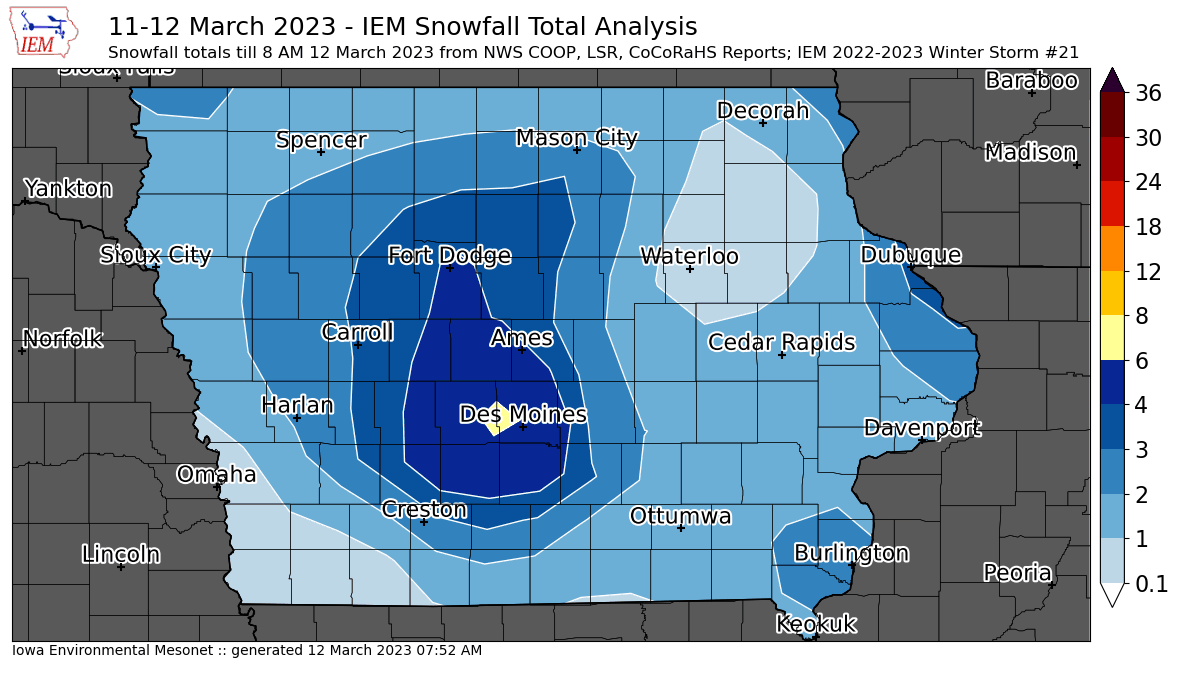
12 Mar 2023 07:57 AM
A somewhat surprising Saturday snowstorm surpassed forecast expectations and dumped a significant amount of very wet snow over central Iowa. The heaviest totals approaching eight inches were found over the western Des Moines metro area. As with the storm this past Thursday, the majority of the snow fell during the daytime and compacted/melted making for a difficult measurement. Temperatures were slightly cooler than Thursday, so less rain mixed in with the snow and thus boosted totals. It looks like this snow will stick around for a few days as a return to warmer weather arrives later this week.
Voting: Good - 124 Bad - 1
Tags: winter2223
Tue Mar 14, 2023
Cold Profile
14 Mar 2023 05:30 AM
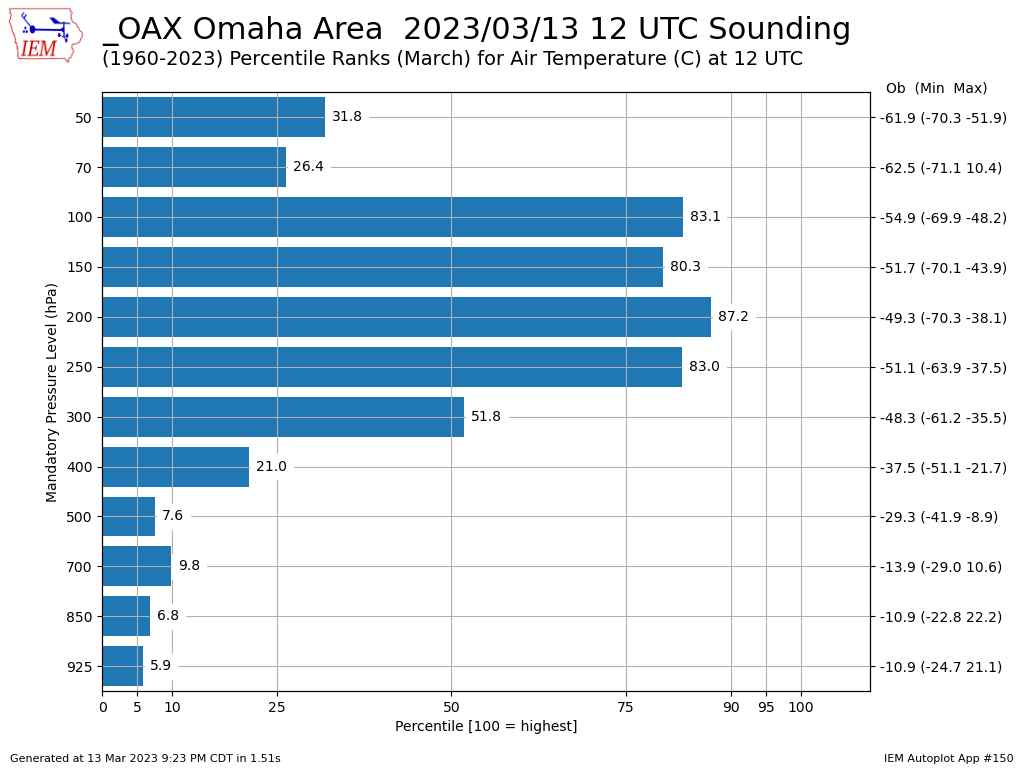
Monday was a very raw and not at all spring break like March day for Iowa. Much of the state stayed below 32 degrees Fahrenheit for the entire day! When it is cold at the surface, it is often interesting to look aloft to see how cold it is there as well. The featured chart presents mandatory level sounding temperature percentiles for the Omaha sounding from Monday morning. Indeed, the temperature percentiles aloft are cold as well for March, but you may wonder why things reverse as you reach 400 hPa and higher levels. The reason is when the lower atmosphere is colder than average, the thickness as measured by distance between pressure levels decreases and pressure levels higher up occur at lower altitudes. Temperatures are warmer at lower altitudes and so the temperatures reported at a given pressure level are higher.
Voting: Good - 7 Bad - 0
Tags: sounding
Generate This Chart on Website
14 Mar 2023 05:30 AM
Monday was a very raw and not at all spring break like March day for Iowa. Much of the state stayed below 32 degrees Fahrenheit for the entire day! When it is cold at the surface, it is often interesting to look aloft to see how cold it is there as well. The featured chart presents mandatory level sounding temperature percentiles for the Omaha sounding from Monday morning. Indeed, the temperature percentiles aloft are cold as well for March, but you may wonder why things reverse as you reach 400 hPa and higher levels. The reason is when the lower atmosphere is colder than average, the thickness as measured by distance between pressure levels decreases and pressure levels higher up occur at lower altitudes. Temperatures are warmer at lower altitudes and so the temperatures reported at a given pressure level are higher.
Voting: Good - 7 Bad - 0
Tags: sounding
Generate This Chart on Website
Wed Mar 15, 2023
Temperature within Ranges
15 Mar 2023 05:30 AM
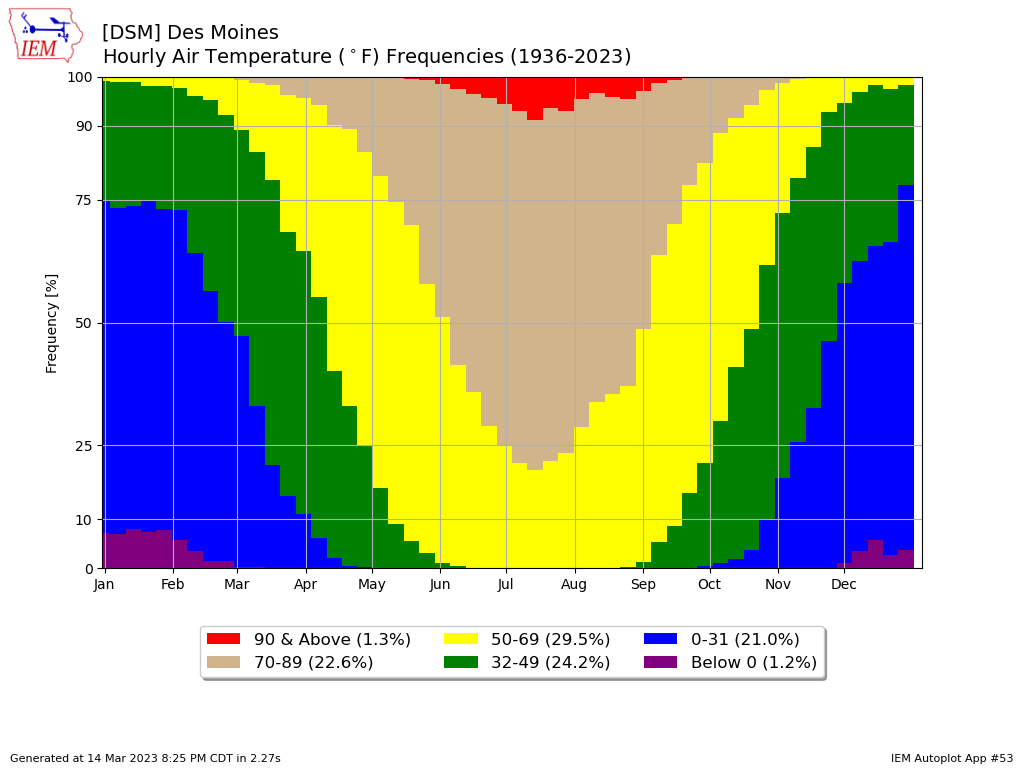
Temperatures Tuesday morning started off very chilly in the single digits over northern Iowa and also started a wild swing of temperatures forecast over the coming days with highs on Wednesday pushing 50 degrees and then crashing back down to below freezing by Friday. The featured chart presents the weekly frequency of having an hourly temperature within a given range of temperatures for Des Moines. The chart nicely shows that the most extreme cold temperatures (below 0F) are mostly gone by mid March and we slowly start to see an increasing frequency of warmer temperatures in the 70s. If you imagine lines between the different thresholds, the steepness of them provides some hope that warmer spring temperatures are not far off!
Voting: Good - 7 Bad - 0
Generate This Chart on Website
15 Mar 2023 05:30 AM
Temperatures Tuesday morning started off very chilly in the single digits over northern Iowa and also started a wild swing of temperatures forecast over the coming days with highs on Wednesday pushing 50 degrees and then crashing back down to below freezing by Friday. The featured chart presents the weekly frequency of having an hourly temperature within a given range of temperatures for Des Moines. The chart nicely shows that the most extreme cold temperatures (below 0F) are mostly gone by mid March and we slowly start to see an increasing frequency of warmer temperatures in the 70s. If you imagine lines between the different thresholds, the steepness of them provides some hope that warmer spring temperatures are not far off!
Voting: Good - 7 Bad - 0
Generate This Chart on Website
Thu Mar 16, 2023
Accumulated below 32 days
16 Mar 2023 05:30 AM
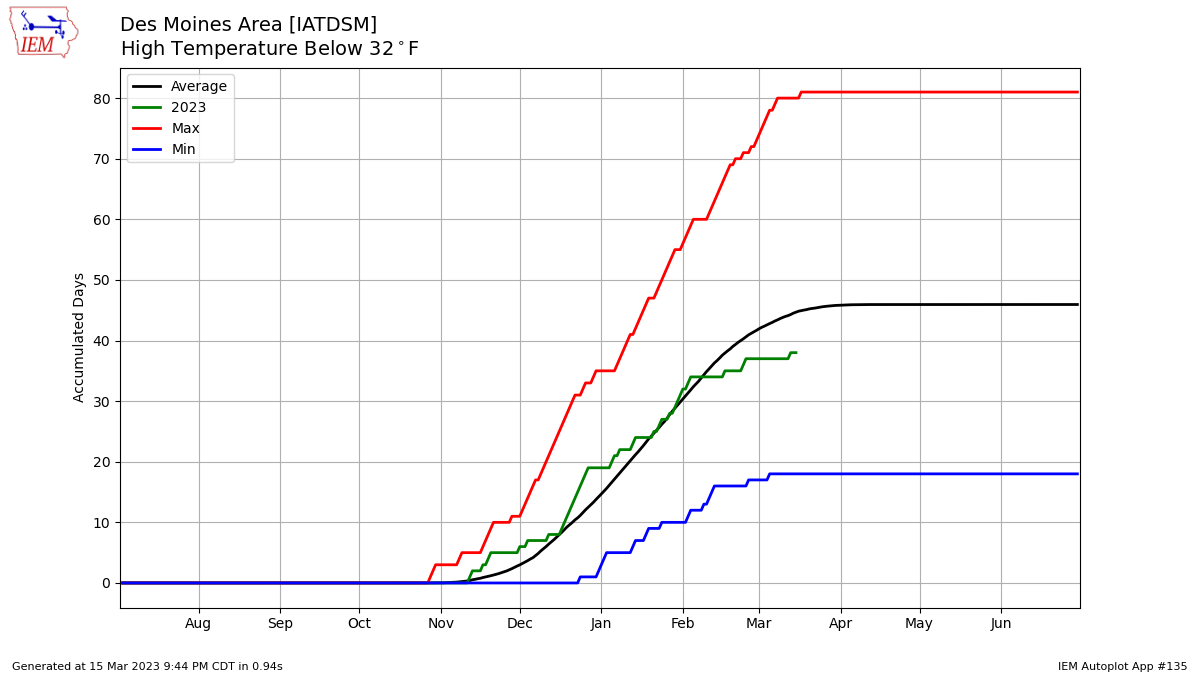
Temperatures warmed nicely on Wednesday and provided a brief respite from a recent stretch of chilly March weather. Unfortunately, a return to chilly weather returns today and the forecast has a few days with a high temperature below 32 degrees Fahrenheit expected. The featured chart presents the accumulated number of such days for Des Moines with a simple mean shown along with the min and max values. The season to date totals this year were slightly above average, but had recently trailed off, which is likely due to the transient snow cover for the location.
Voting: Good - 8 Bad - 0
Generate This Chart on Website
16 Mar 2023 05:30 AM
Temperatures warmed nicely on Wednesday and provided a brief respite from a recent stretch of chilly March weather. Unfortunately, a return to chilly weather returns today and the forecast has a few days with a high temperature below 32 degrees Fahrenheit expected. The featured chart presents the accumulated number of such days for Des Moines with a simple mean shown along with the min and max values. The season to date totals this year were slightly above average, but had recently trailed off, which is likely due to the transient snow cover for the location.
Voting: Good - 8 Bad - 0
Generate This Chart on Website
Fri Mar 17, 2023
'22-'23 Winter Storm #22
17 Mar 2023 08:10 AM
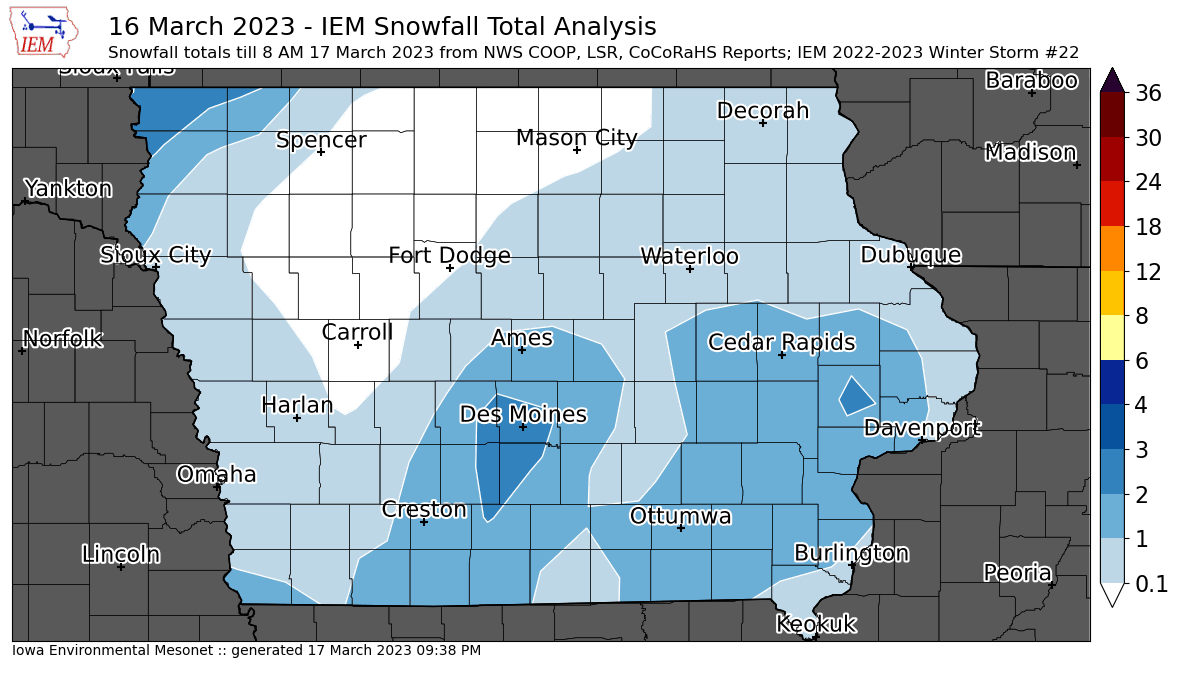
The most recent storm failed to produce much in the way of snow over Iowa, but much colder temperatures and strong winds are certainly being felt this Friday morning. The featured map presents an analysis of available snowfall reports with the largest amounts of just over a few inches confined to far northwestern Iowa. Thankfully warmer weather is in the forecast for next week, but for those of you that had "spring break" this week, there was not much spring weather to be found unless you went south!
Voting: Good - 9 Bad - 2
Tags: winter2223
17 Mar 2023 08:10 AM
The most recent storm failed to produce much in the way of snow over Iowa, but much colder temperatures and strong winds are certainly being felt this Friday morning. The featured map presents an analysis of available snowfall reports with the largest amounts of just over a few inches confined to far northwestern Iowa. Thankfully warmer weather is in the forecast for next week, but for those of you that had "spring break" this week, there was not much spring weather to be found unless you went south!
Voting: Good - 9 Bad - 2
Tags: winter2223
Mon Mar 20, 2023
Cold for Mid March
20 Mar 2023 05:30 AM
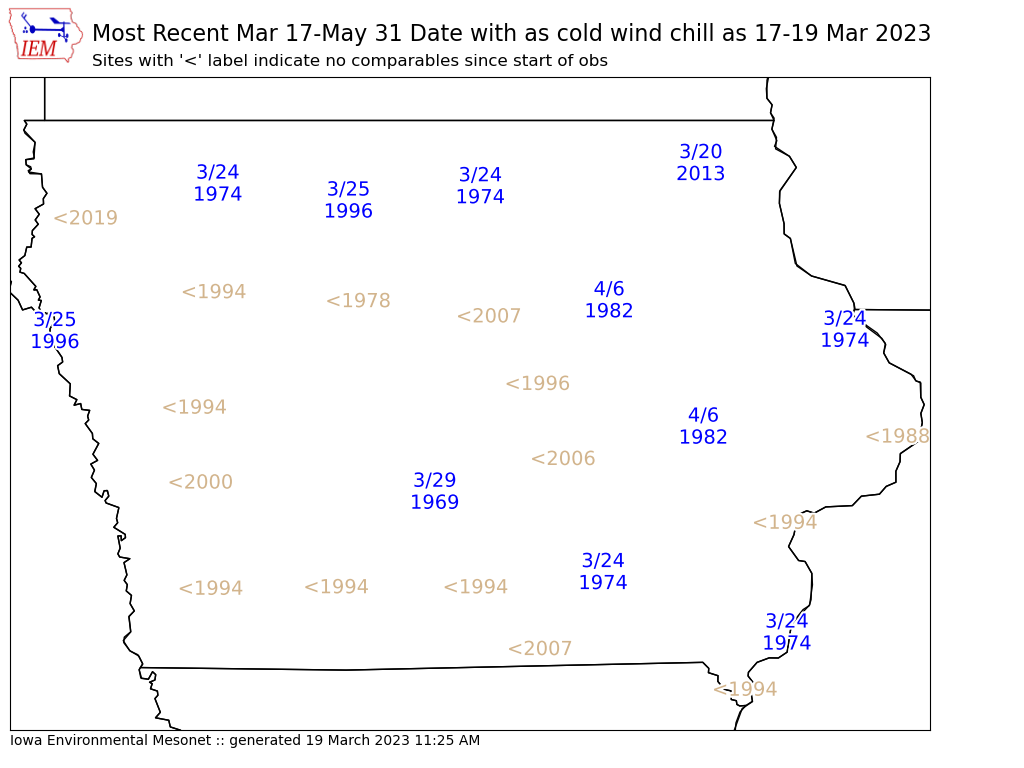
A bit of sunshine and a slightly warmer Sunday afternoon saved what otherwise was a miserable weekend of bitter mid March cold temperatures. Strong winds combined with the cold temperatures to produce extremely low wind chill values for mid March. The featured map presents the most recent date with as cold a wind chill temperature as was experienced since Friday. This is based on automated hourly reports from the Iowa airport weather stations and sites shown in tan indicate no comparable readings over the period of record for the site. So this was generational cold wind chill temperatures for this late into March with a number of sites having to go back to 24 March 1974 to find as cold a reading. Thankfully some moderation in temperature will happen this week, but it certainly could be warmer this time of year!
Voting: Good - 7 Bad - 2
20 Mar 2023 05:30 AM
A bit of sunshine and a slightly warmer Sunday afternoon saved what otherwise was a miserable weekend of bitter mid March cold temperatures. Strong winds combined with the cold temperatures to produce extremely low wind chill values for mid March. The featured map presents the most recent date with as cold a wind chill temperature as was experienced since Friday. This is based on automated hourly reports from the Iowa airport weather stations and sites shown in tan indicate no comparable readings over the period of record for the site. So this was generational cold wind chill temperatures for this late into March with a number of sites having to go back to 24 March 1974 to find as cold a reading. Thankfully some moderation in temperature will happen this week, but it certainly could be warmer this time of year!
Voting: Good - 7 Bad - 2
Tue Mar 21, 2023

Good Spring Start for Some
21 Mar 2023 05:30 AM
The first day of the astronomical spring season got off to a good start for those on the right side of the warm front that bisected the state. The featured map presents an analysis of Iowa airport weather stations and shows a remarkable contrast of around 30 degrees north to south over western Iowa. This was still a pleasant relief for all from the ugly cold of late last week. Temperatures will cool off some for the rest of the week along with a number of chances of precipitation that should mostly be in the form of rain for much of the state.
Voting: Good - 11 Bad - 0
Generate This Chart on Website
Wed Mar 22, 2023
Corn Yield Departures
22 Mar 2023 05:30 AM
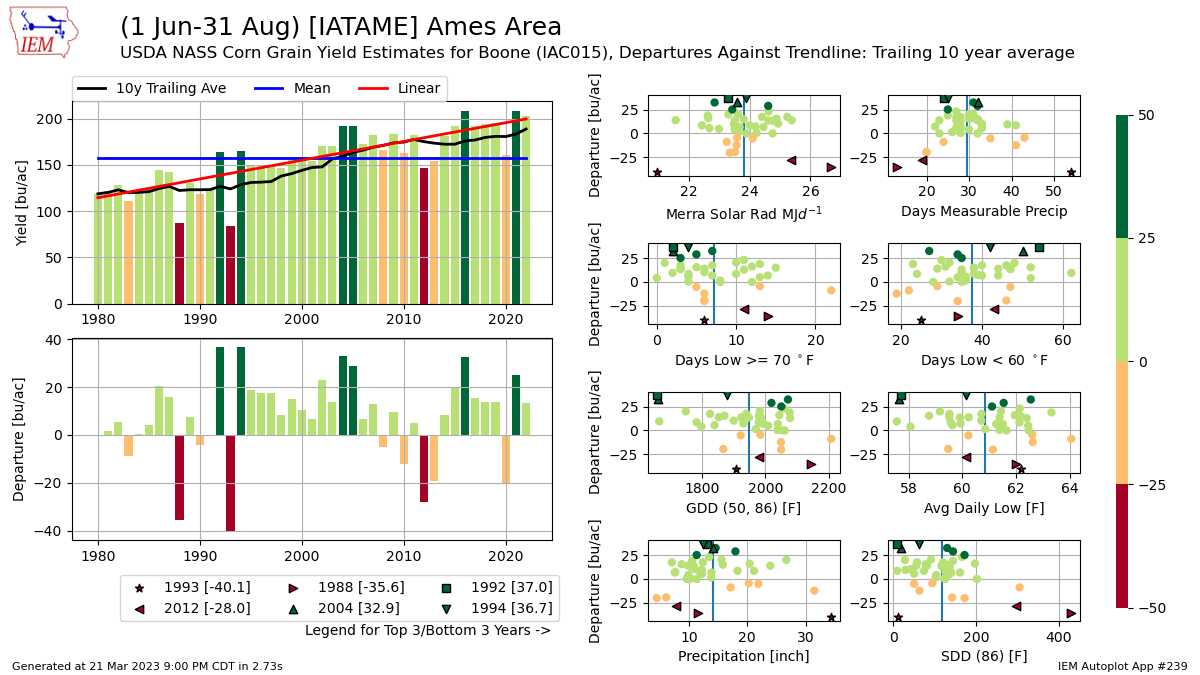
There is an entire industry and academic study built around attempting to correlate agricultural crop yields and environmental data. So today's featured chart contains nothing groundbreaking, but highlights a new autoplot tool on the IEM website that allows you to plot combinations of USDA NASS county yield estimates and IEM tracked long term climate sites weather summary variables over a date period of your choice. There's a lot going on with this plot! The upper left plot shows the raw yield estimates for Boone County with three different trend lines plotted. The lower right plot shows the yearly departures from a trailing ten year averaged trendline with the colors representing the magnitude of the departures. Genetics and management continues to improve over the years, so the trendline allows you to attempt to back out these changes and focus on the year to year variability from weather. These departures are then plotted against eight summary weather metrics over the inclusive 1 June through 31 August period for Ames with the top three and bottom three departure years highlighted by special icons. There are some intuitive relationships readily seen with the lack of precipitation and excess of precipitation clearly leading to negative yield departures. If this interests you, try out the "Generate this Chart on Website" link and see what relationships you can find :)
Voting: Good - 11 Bad - 0
Generate This Chart on Website
22 Mar 2023 05:30 AM
There is an entire industry and academic study built around attempting to correlate agricultural crop yields and environmental data. So today's featured chart contains nothing groundbreaking, but highlights a new autoplot tool on the IEM website that allows you to plot combinations of USDA NASS county yield estimates and IEM tracked long term climate sites weather summary variables over a date period of your choice. There's a lot going on with this plot! The upper left plot shows the raw yield estimates for Boone County with three different trend lines plotted. The lower right plot shows the yearly departures from a trailing ten year averaged trendline with the colors representing the magnitude of the departures. Genetics and management continues to improve over the years, so the trendline allows you to attempt to back out these changes and focus on the year to year variability from weather. These departures are then plotted against eight summary weather metrics over the inclusive 1 June through 31 August period for Ames with the top three and bottom three departure years highlighted by special icons. There are some intuitive relationships readily seen with the lack of precipitation and excess of precipitation clearly leading to negative yield departures. If this interests you, try out the "Generate this Chart on Website" link and see what relationships you can find :)
Voting: Good - 11 Bad - 0
Generate This Chart on Website
Thu Mar 23, 2023
'22-'23 Winter Storm #23
23 Mar 2023 07:43 AM
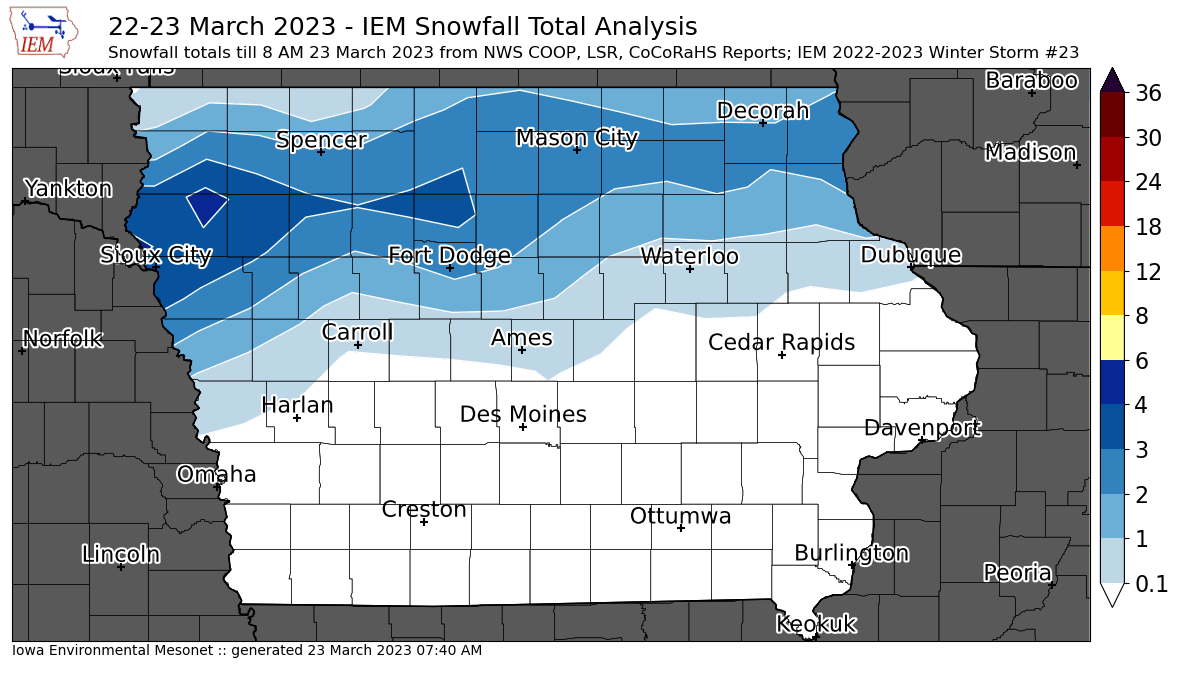
An overnight storm brought upwards of four inches over northern Iowa. The featured map presents a current analysis of available NWS and CoCoRaHS reports. Temperatures are safely below freezing over this area, so roads are in rough shape this morning. Another round of snow is expected Friday night, so winter continues to hold on even after the calendar flipped to astronomical spring earlier this week.
Voting: Good - 12 Bad - 0
Tags: winter2223
23 Mar 2023 07:43 AM
An overnight storm brought upwards of four inches over northern Iowa. The featured map presents a current analysis of available NWS and CoCoRaHS reports. Temperatures are safely below freezing over this area, so roads are in rough shape this morning. Another round of snow is expected Friday night, so winter continues to hold on even after the calendar flipped to astronomical spring earlier this week.
Voting: Good - 12 Bad - 0
Tags: winter2223
Fri Mar 24, 2023

Ames Sub-60 Streak
24 Mar 2023 05:30 AM
It has been a rather interesting winter with plenty of precipitation and rather limited periods of very cold temperatures. For Ames, the temperature has yet to reach 60 degrees this year and one needs to go all the way back to 12 November 2022 for the last such temperature. The featured chart presents the yearly maximum streaks below 60 degrees for Ames. The top 20 events shows the ongoing event coming in 19th place, but likely not going to climb into the top 10 as warmer temperatures are expected by around the first of April, which is the end of next week! The end date of these streaks is informative to denote that they rarely can last more than the first week into April. The 1974-1975 streak is certainly an outlier, lasting till the 15th.
Voting: Good - 8 Bad - 0
Generate This Chart on Website
Sat Mar 25, 2023
'22-'23 Winter Storm #24
25 Mar 2023 12:06 PM
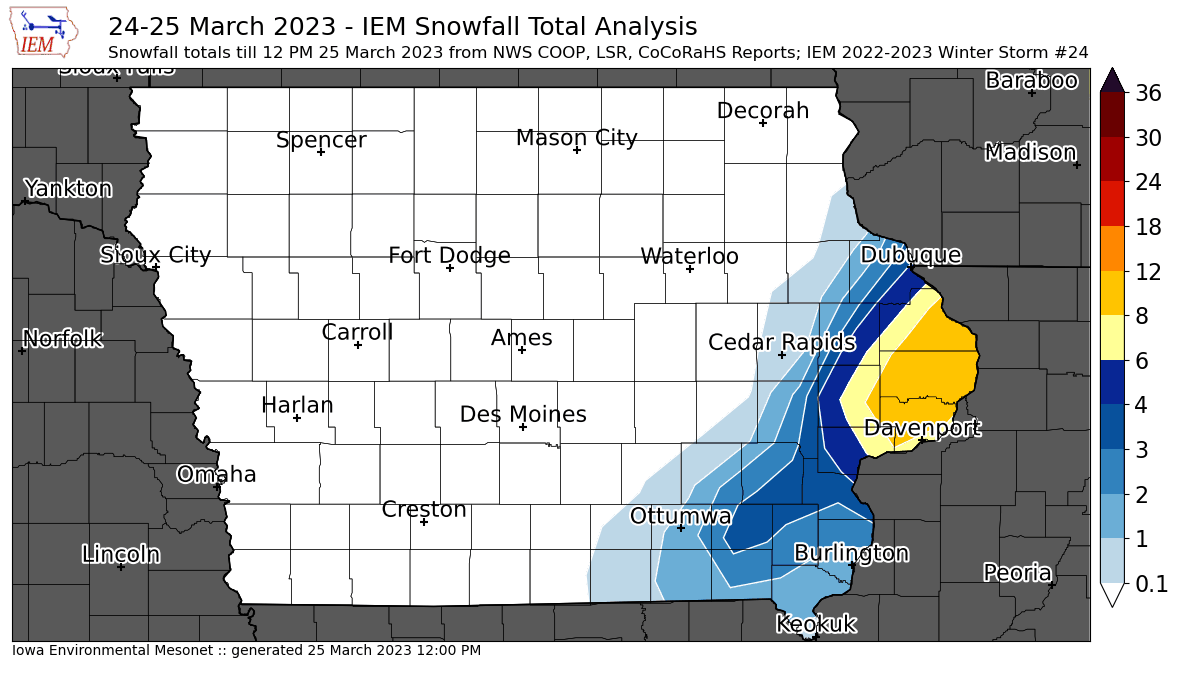
Far eastern Iowa got clipped by a lot of snow this Saturday morning with a number of reports over 10 inches found just north of Davenport. The western cut off to the snow was very sharp and likely a bit under-done with this analysis. More snow is likely on the way for this evening and into Sunday.
Voting: Good - 10 Bad - 0
Tags: winter2223
25 Mar 2023 12:06 PM
Far eastern Iowa got clipped by a lot of snow this Saturday morning with a number of reports over 10 inches found just north of Davenport. The western cut off to the snow was very sharp and likely a bit under-done with this analysis. More snow is likely on the way for this evening and into Sunday.
Voting: Good - 10 Bad - 0
Tags: winter2223
Mon Mar 27, 2023
'22-'23 Winter Storm #25
27 Mar 2023 08:07 AM
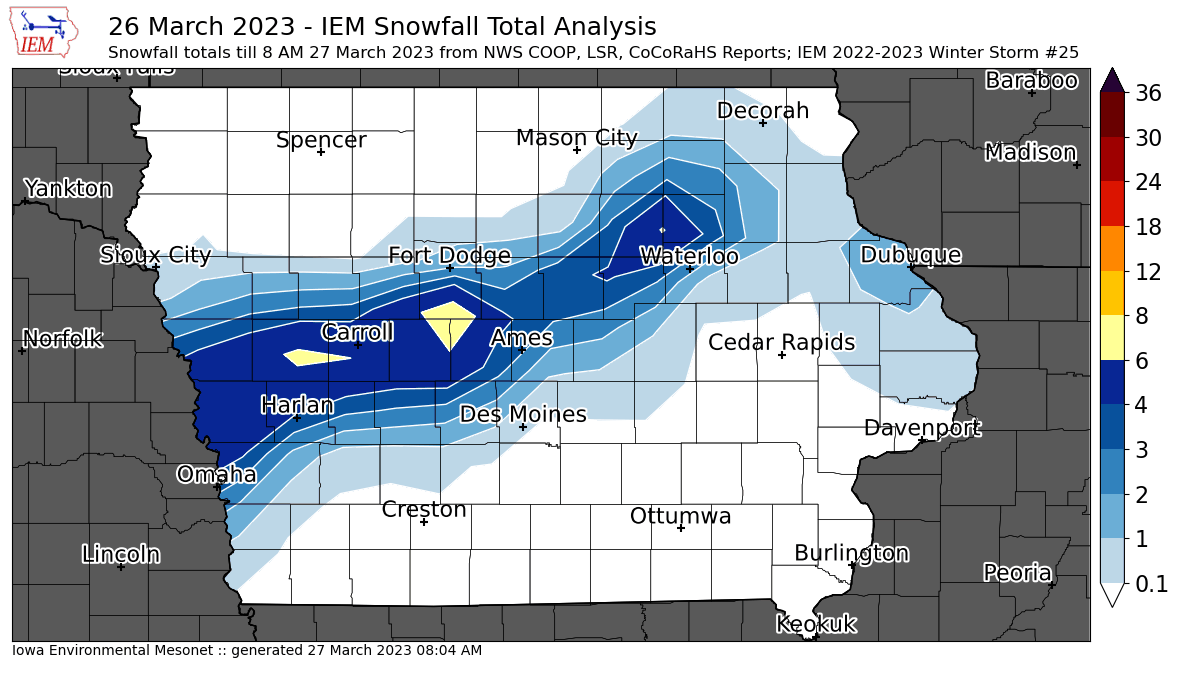
Sunday brought a very intense and narrow band of heavy snowfall to portions of northern and western Iowa. The featured analysis of available NWS and CoCoRaHS reports is struggling a bit to accurately portray the sharp gradient on both the north and south side of this stripe of snow. This snow also was very rich in water and fell during the daylight, so melting and compaction made snowfall measurements very tricky. The good news is that this snow will not stick around long as sunshine today will make quick work of it.
Voting: Good - 11 Bad - 3
Tags: winter2223
27 Mar 2023 08:07 AM
Sunday brought a very intense and narrow band of heavy snowfall to portions of northern and western Iowa. The featured analysis of available NWS and CoCoRaHS reports is struggling a bit to accurately portray the sharp gradient on both the north and south side of this stripe of snow. This snow also was very rich in water and fell during the daylight, so melting and compaction made snowfall measurements very tricky. The good news is that this snow will not stick around long as sunshine today will make quick work of it.
Voting: Good - 11 Bad - 3
Tags: winter2223
Tue Mar 28, 2023
Day 5 30% Risk
28 Mar 2023 05:30 AM
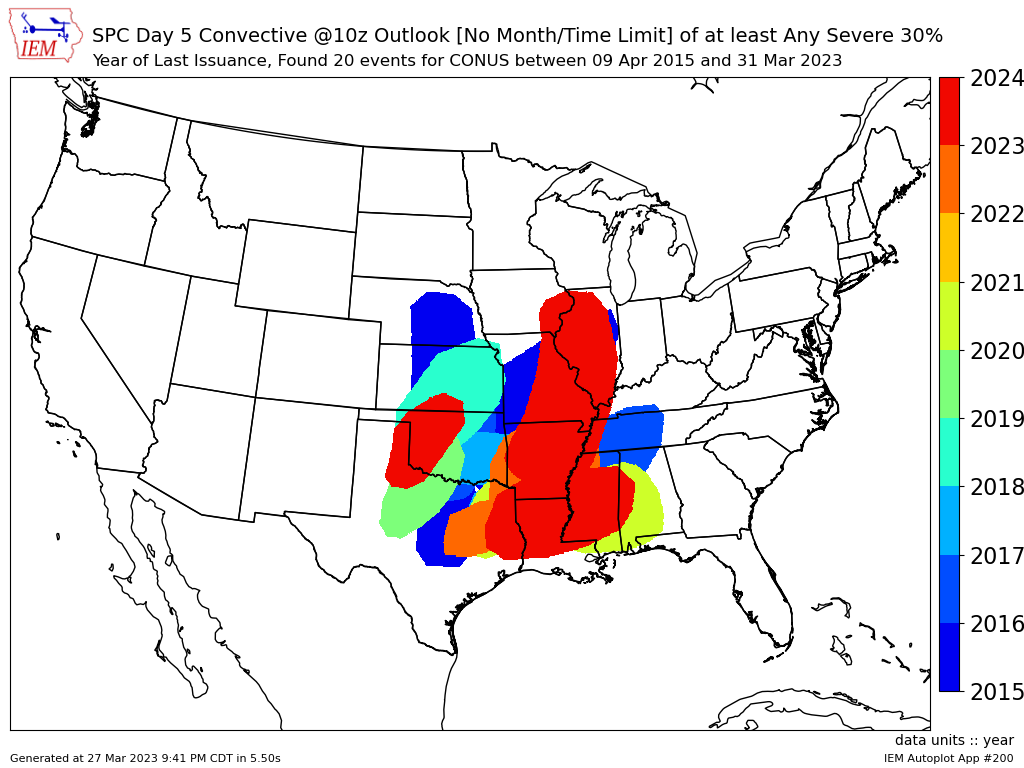
It is Severe Weather Awareness Week in Iowa, so it seems fitting that a significant severe weather event is forecast for Friday. Based on yesterday's forecast, the Storm Prediction Center has a chunk of southeastern Iowa highlighted for a 30% risk of severe weather at forecast day five. This is a high probability at a forecast time of five days out and something that happens only a handful of times each year. The featured map shows the most recent year a given location was under such a forecast risk of severe weather. This map does not directly show this, but this is practically the first such 30% risk for Iowa at day five since 2015 (the start of this threshold's archive). Much can certainly change by Friday, but it is a good week to prepare for the worst and follow along with the awareness week at hand.
Voting: Good - 11 Bad - 0
Generate This Chart on Website
28 Mar 2023 05:30 AM
It is Severe Weather Awareness Week in Iowa, so it seems fitting that a significant severe weather event is forecast for Friday. Based on yesterday's forecast, the Storm Prediction Center has a chunk of southeastern Iowa highlighted for a 30% risk of severe weather at forecast day five. This is a high probability at a forecast time of five days out and something that happens only a handful of times each year. The featured map shows the most recent year a given location was under such a forecast risk of severe weather. This map does not directly show this, but this is practically the first such 30% risk for Iowa at day five since 2015 (the start of this threshold's archive). Much can certainly change by Friday, but it is a good week to prepare for the worst and follow along with the awareness week at hand.
Voting: Good - 11 Bad - 0
Generate This Chart on Website
Wed Mar 29, 2023

Tornado Warning Polygon Heatmap
29 Mar 2023 05:30 AM
Severe Weather Awareness Week continues today with the statewide tornado warning drill at 10 AM. So today's feature takes a deep dive into NWS Tornado Warnings. The NWS issues Tornado Warnings by polygon, which is a spatial area defined by latitude and longitude boundaries with only 0.01 degrees of resolution at the vertices. The featured map presents a heat map of these polygons warnings by rasterizing them onto a regular grid with each grid cell representing the number of warnings since 2008. There are many interesting artifacts shown on the map. First, you may notice a number of white slivers that have not seen a single polygon warning over this period. Second, there is an east to west frequency bias shown over counties due to an unfortunate legacy artifact of how NWS warnings are still tied to counties. NWS polygon warnings are often drawn to the county border, which implies for a storm moving generally east that the eastern portion of a county will see a higher number of warnings than the western portion. Those issues aside, some climatological "hot spots" in the state are readily apparent and likely have some physical/meteorological reasons that they exist. Being a far distance from a NWS RADAR likely decreases the chance that a NWS forecaster / RADAR algorithms can see weak tornado signatures with storms.
Voting: Good - 17 Bad - 0
Tags: tornado
Generate This Chart on Website
Thu Mar 30, 2023
ERA5 Land Solar Radiation
30 Mar 2023 05:30 AM
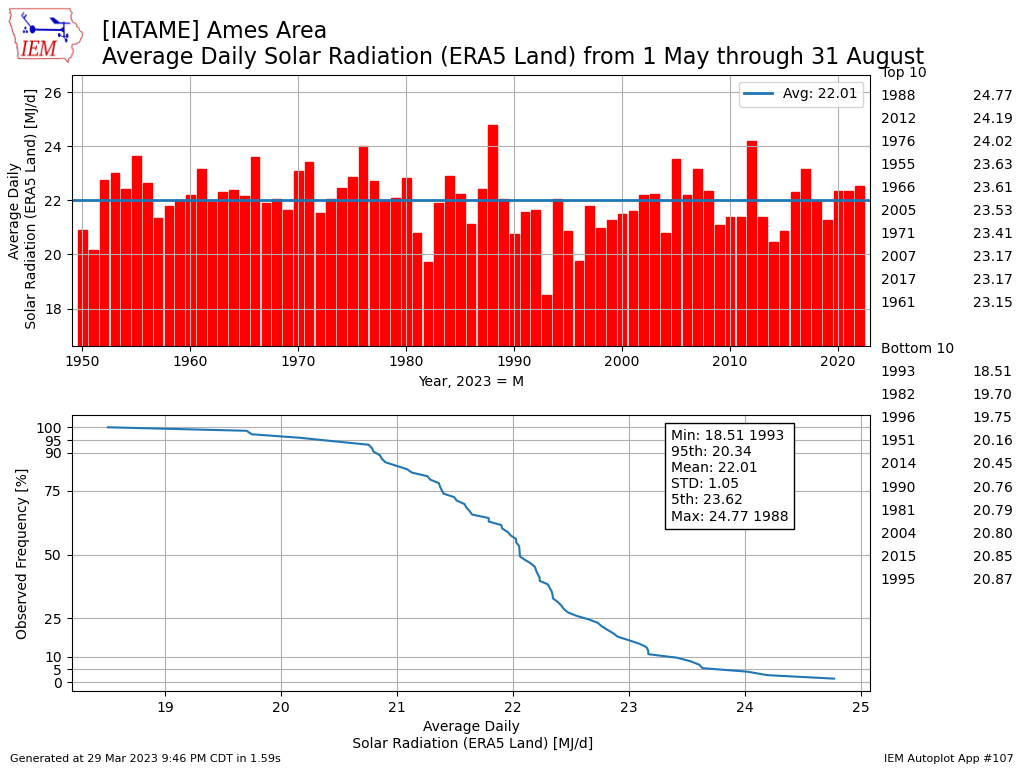
The folks at the European Centre for Medium Range Weather are producing many innovate products and services. One such product is the ERA5 Land dataset, which is a high resolution hourly reanalysis of many atmospheric variables dating back to 1950 (perhaps soon to 1940). One of the variables is shortwave / solar radiation and the IEM has recently completed a process to provide these solar radiation estimates along side the long term climate data. The featured chart presents this data expressed as a daily average flux value (megajoules per day) for Ames for the date period between 1 May and 31 August. It is somewhat wild to denote the the recent drought years of 1988 and 2012 coming in at the top of the most radiation list and 1993 plus 1982 at the bottom of least radiation. It is difficult to have observations to compare against these analyses, but they intuitively make sense as flood years are cloudier than drought years. It also gives some credibility to the dataset that folks over in Europe may have gotten the data right in Iowa! More tools and other ERA5 Land variables will be appearing on the IEM website with time!
Voting: Good - 12 Bad - 0
30 Mar 2023 05:30 AM
The folks at the European Centre for Medium Range Weather are producing many innovate products and services. One such product is the ERA5 Land dataset, which is a high resolution hourly reanalysis of many atmospheric variables dating back to 1950 (perhaps soon to 1940). One of the variables is shortwave / solar radiation and the IEM has recently completed a process to provide these solar radiation estimates along side the long term climate data. The featured chart presents this data expressed as a daily average flux value (megajoules per day) for Ames for the date period between 1 May and 31 August. It is somewhat wild to denote the the recent drought years of 1988 and 2012 coming in at the top of the most radiation list and 1993 plus 1982 at the bottom of least radiation. It is difficult to have observations to compare against these analyses, but they intuitively make sense as flood years are cloudier than drought years. It also gives some credibility to the dataset that folks over in Europe may have gotten the data right in Iowa! More tools and other ERA5 Land variables will be appearing on the IEM website with time!
Voting: Good - 12 Bad - 0
Fri Mar 31, 2023
Out Like a Roaring Lion
31 Mar 2023 05:33 AM
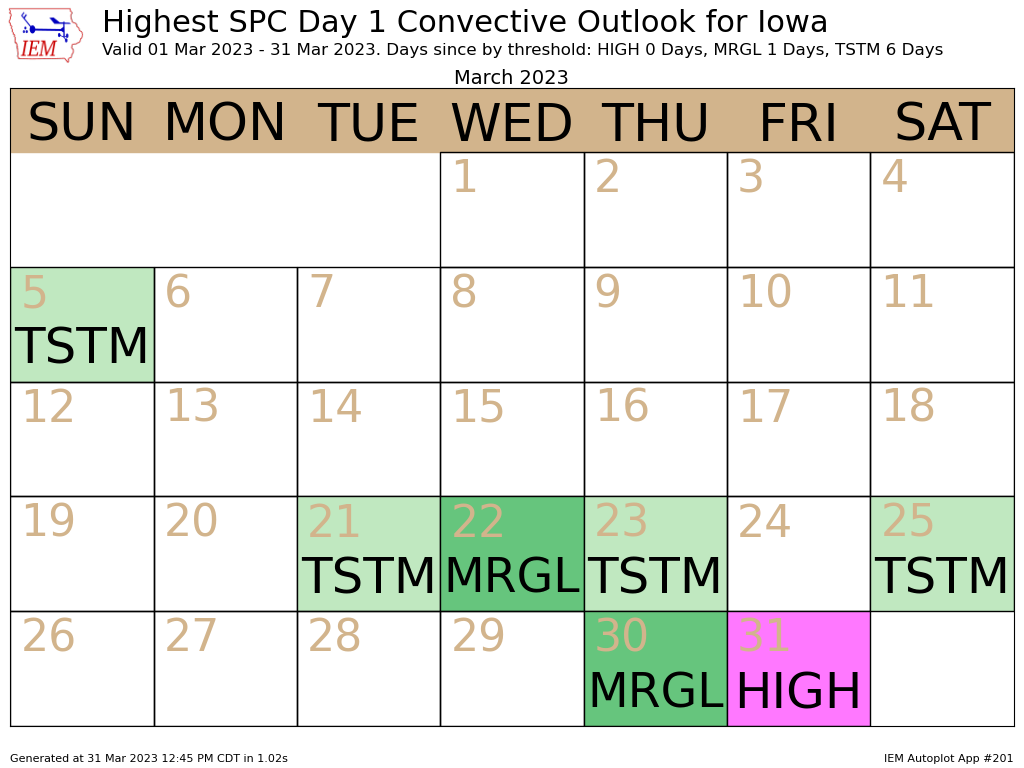
With a big storm system impacting the middle of the country today, there is little doubt that this March is going out like a lion. As powerful storm systems this time of year often do, it will feature a side producing significant severe weather and a side producing a winter storm along with blizzard conditions for some. Iowa will mostly miss out on the winter side of the storm with only far northern Iowa expected to see snow overnight. The main show for Iowa is expected to come in a couple of waves today in the form of severe convective storms. The featured chart presents a calendar of maximum daily Storm Prediction Center Day 1 convective outlook category for the state. It is been a rather quiet month up until today with the moderate (MDT) risk covering much of southeastern Iowa. It is good timing after the week of preparation associated with Severe Weather Awareness Week for Iowa!
31 Mar 2023 05:33 AM
With a big storm system impacting the middle of the country today, there is little doubt that this March is going out like a lion. As powerful storm systems this time of year often do, it will feature a side producing significant severe weather and a side producing a winter storm along with blizzard conditions for some. Iowa will mostly miss out on the winter side of the storm with only far northern Iowa expected to see snow overnight. The main show for Iowa is expected to come in a couple of waves today in the form of severe convective storms. The featured chart presents a calendar of maximum daily Storm Prediction Center Day 1 convective outlook category for the state. It is been a rather quiet month up until today with the moderate (MDT) risk covering much of southeastern Iowa. It is good timing after the week of preparation associated with Severe Weather Awareness Week for Iowa!
Updated 12 PM: Updated plot to show the upgrade SPC did to High Risk for today.
Voting: Good - 31 Bad - 0
Generate This Chart on Website