Above Average Again
Posted:
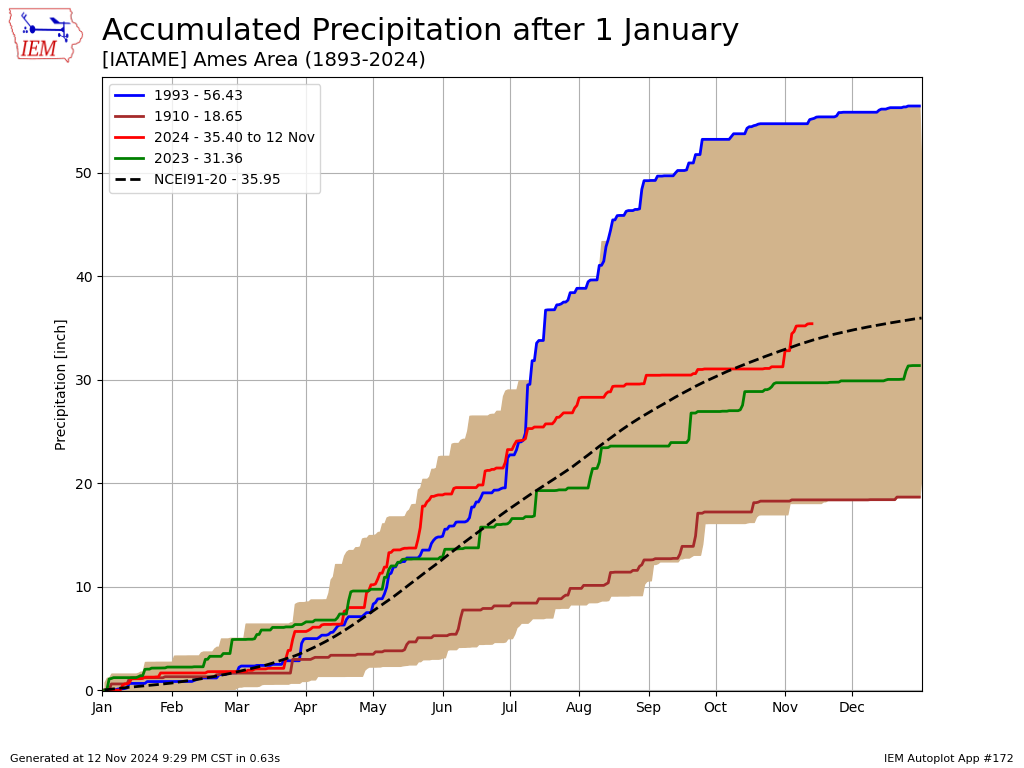
The featured chart presents year to date accumulated precipitation for Ames. The tan area represents the envelope of observed data, with the maximum year (1993), minimum year (1910), climatology (dashed line), this year and last year's data also plotted. This year's line of travel is rather remarkable with a good chunk of spring spent at levels above the wettest year of 1993 and well above average. The fortunes reversed by July into August with the mostly flat line from September into October. Then the deluge happened over the past two weeks and the year to date total is again above average. We'd only need another half inch for the rest of the year to finish above average for the year.
Voting:
Good = 18
Bad = 0
Voting:
Good = 18
Bad = 0