IEM Daily Feature
Friday, 19 June 2020
Friday, 19 June 2020
Normal Distribution
Posted: 19 Jun 2020 05:37 AM
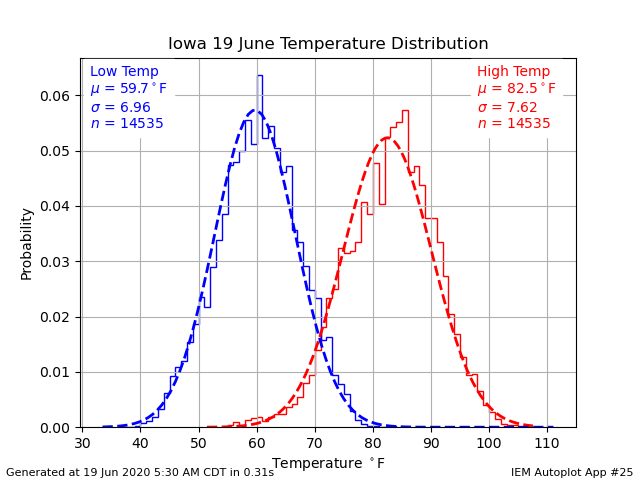
The featured chart presents a histogram of daily high and low temperatures for the 19th of June for
all available climate reporting sites in Iowa. The stepped line represents the actual frequency at a
given temperature and the dashed line is the "normal distribution" given the dataset's mean and
standard deviation. The fit between the two lines looks rather good and this type of relationship is
common in Iowa for days without temperatures near freezing. The simple average shown of a high of
82 and low of 60 is close to the forecast over the next few days as we enjoy cooler weather and more
chances of needed rainfall.
Voting:
Good = 15
Bad = 0
Voting:
Good = 15
Bad = 0