Past IEM Features tagged: 2018

2018 Temperature Range
04 Jan 2019 05:34 AMBased on a high resolution hourly temperature analysis from NOAA, the featured map depicts the range between the coldest and warmest value for all of 2018. Iowa is shown in the 110 to 130 degree range. Even larger values can be found to our north and west over the High Plains where elevation, the Rocky Mountains and other things conspire to allow for more extreme heat and cold. The map is rather clear that if you don't like variability, you should be living in the southern tip of Florida where the abundance of surrounding ocean moderates temperatures.
Voting:
Good: 19
Bad: 4
Abstain: 1
Tags: 2018

Waterloo Tops 1993
28 Dec 2018 05:35 AMWith over 1.50 inches of rain on Thursday, Waterloo Iowa has topped its previous yearly record for precipitation set during the infamous flood year of 1993. The featured chart displays the yearly precipitation totals and 2018 joins just two other years with over 50 inches reported. The rest of the precipitation expected for the site to finish 2018 will come in the form of snow.
Voting:
Good: 13
Bad: 0
Tags: 2018

Two Months in a Row
02 Nov 2018 05:34 AMBased on unofficial IEM calculations, the northeastern Iowa climate district had its second wettest month on record in a row. The featured chart depicts the highest monthly precipitation totals. Both September and now October rank number one for the area. Thankfully the last portion of October was mostly dry, which helped to allow crop harvest progress and prevent any further flooding. Sadly, this area of the state looks to again be the wettest portion of Iowa over the next week or so. Hopefully rainfall totals do not get out of hand, like they did for the previous months.
Voting:
Good: 9
Bad: 2
Tags: 2018

New Hampton Precipitation Record
08 Oct 2018 05:35 AMBased on preliminary data, New Hampton (north central Iowa) is already exceeded its maximum yearly rainfall total set just two years back during 2016. The featured chart displays the yearly totals from the site since 1893. A simple linear regression is shown and denotes a rather disturbing increase in yearly precipitation over this period. When the yearly record was set during 2016, it did not happen until the end of the December. This year it is being set with nearly three full months remaining in the year and near term heavy rainfall events forecasted this week.
Voting:
Good: 14
Bad: 0
Tags: 2018

Hot, Humid, and Windy!!!
04 Oct 2018 05:35 AMIowa's weather on October 3rd was nothing sort of amazing and exceptional. The day featured a rare combination of heat, humidity, and wind. While windy conditions frequently happen with hot temperatures, the winds tend to be dry and also mix out humidity located near the ground which both tend to lower dew points. Wednesday's setup was aided by tropical moisture advecting our way from the southwest, so strong southwesterly winds which are typically dry were not so for this event. The featured chart presents some selected observations and a count of previous hourly reports with as hot, humid, and windy report. The chart shows that very few analogs exist. This event was very rare and not even to mention that it happened in October!
Voting:
Good: 17
Bad: 1
Tags: 2018 extreme

Wettest Month for Waterloo
26 Sep 2018 05:33 AMThe featured chart presents the largest precipitation totals by month for Waterloo. With just over an inch on Tuesday, the rainfall total for this September is now the largest on record for the site for any month! The 12.89 inches this month bests the previous largest total of 12.82 inches for July 1999. Having the wettest month on record be September is somewhat rare for a long term climate site in Iowa. Of the 113 long term climate sites in Iowa tracked by the IEM, a previous September was the wettest month on record for 14 of them. The most common wettest month is June (41 sites).
Voting:
Good: 10
Bad: 1
Tags: 2018
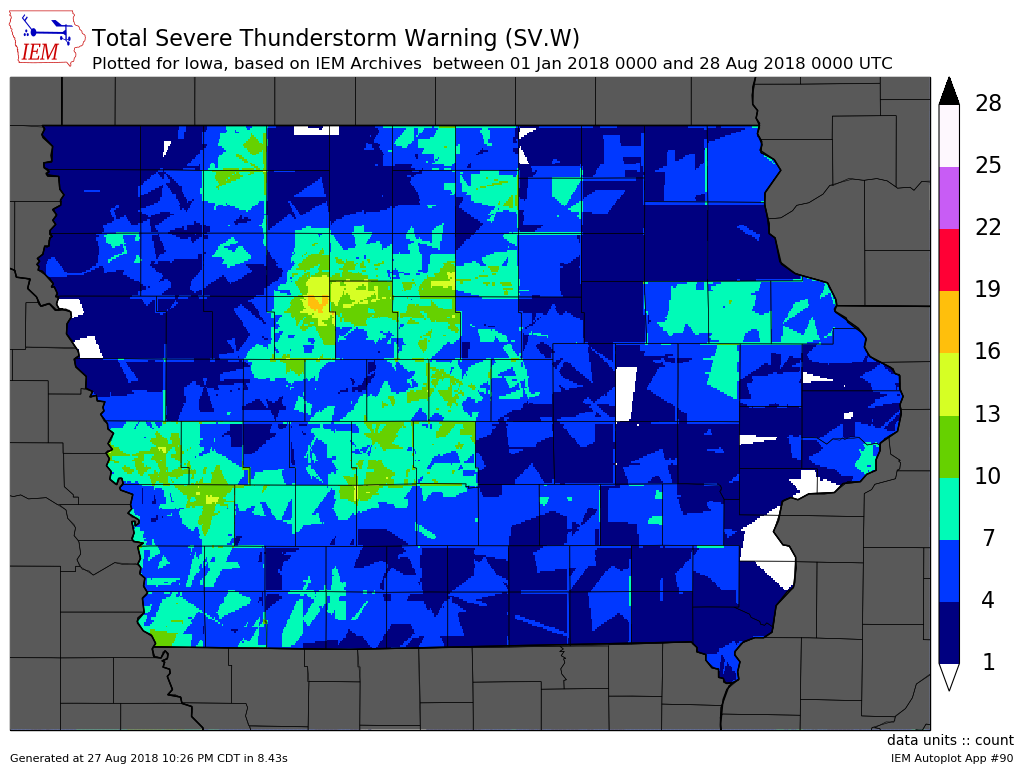
2018 Severe T'Storm Warnings
28 Aug 2018 05:33 AMThunderstorms impacted Iowa on Sunday and again on Monday with an encore expected on Tuesday. Some of these storms warranted warnings, which are issued by the National Weather Service for distinct spatial polygon regions (called Storm Based Warnings). The featured map presents an accounting of the number of warnings per location in the state (discretized on a 1/100 of a degree grid). The locations in white are indicated to have gotten zero Severe Thunderstorm Warnings so far this year. The most active location on this map is northeastern Calhoun County. You can generate maps like this on the website for other locations, times, and severe phenomena of your choice!
Voting:
Good: 12
Bad: 0
Tags: 2018 warnings

Humidity Switch Turned On
17 Jul 2018 05:35 AMThe featured chart displays daily averaged surface mixing ratio for Ames. This value is an absolute measure of humidity that is more linear in nature than dew point and is not directly temperature dependent like relative humidity. The top panel shows this year's values along with the range of values from previous years. The bottom panel shows the daily departures from period of record averages. The departures for this year show a remarkable switch near 1 May from dry to humid conditions. It is almost like a switch was thrown and the elevated humidity has dominated since. Thankfully, a respite has arrived for Tuesday with comfortable dew point temperatures.
Voting:
Good: 8
Bad: 0
Tags: 2018

Plenty of Humidity
06 Jul 2018 05:40 AMMuch drier air is expected for this weekend, which is a welcome break from the increased humidity levels we have seen for much of 2018. The featured chart presents the number of hours this year and on average that the dew point temperature was at a given level for Des Moines. The 2018 totals are well above average. The increased humidity has certainly helped fuel heavy precipitation events so far this summer. It has also helped buoy overnight low temperatures, which have been exceptionally warm this summer. Thankfully, the break from the elevated humidity this weekend will also help over night low temperatures drop safely into the 'open your windows' range.
Voting:
Good: 13
Bad: 1
Tags: 2018 dewpoint

Des Moines Metro Flash Flooding
01 Jul 2018 01:41 PMA historic Flash Flood event hit the Des Moines Metro hard on Saturday night with between three to ten inches of rain falling over just a few hours on the evening of 30 June 2018. The featured plot is of NOAA MRMS rainfall estimates from the event and are actually underestimating the totals some given the overlain reports from the NWS. The initial Flash Flooding has given way to more long term flooding with impacts to be felt for days to come.
Voting:
Good: 14
Bad: 2
Tags: 2018 flashflooding

CONUS Above Average
20 Jun 2018 05:34 AMThe National Centers for Environmental Information (NCEI) recently declared May 2018 as being the warmest May on record for the continental US (CONUS). This warmth has persisted into June with this month perhaps on track to set the record for June as well. This warm stretch got started in late April as illustrated by the featured chart. The chart depicts the percentage of NWS CLImate reporting sites over the CONUS that have had their daily high temperature above or below average. Please note that this total is not spatially weighted. The red side of the chart has been at or above 50% coverage since the first of May. The current forecast for the rest of June continues the above average temperatures for most of the CONUS, but hot weather for Iowa will likely hold off until next week.
Voting:
Good: 7
Bad: 0
Tags: 2018

Low SPC Watch Total
09 May 2018 05:32 AMWhile there have been a few active days this year, the severe weather season has been rather quiet to date thus far. The featured chart depicts the number of Storm Prediction Center issued Severe Thunderstorm and Tornado Watches for the year to date period each year since 1997 (start of modern period of record). This year's total is just about half the total of the previous lowest accumulation year.
Voting:
Good: 12
Bad: 0
Tags: spc 2018
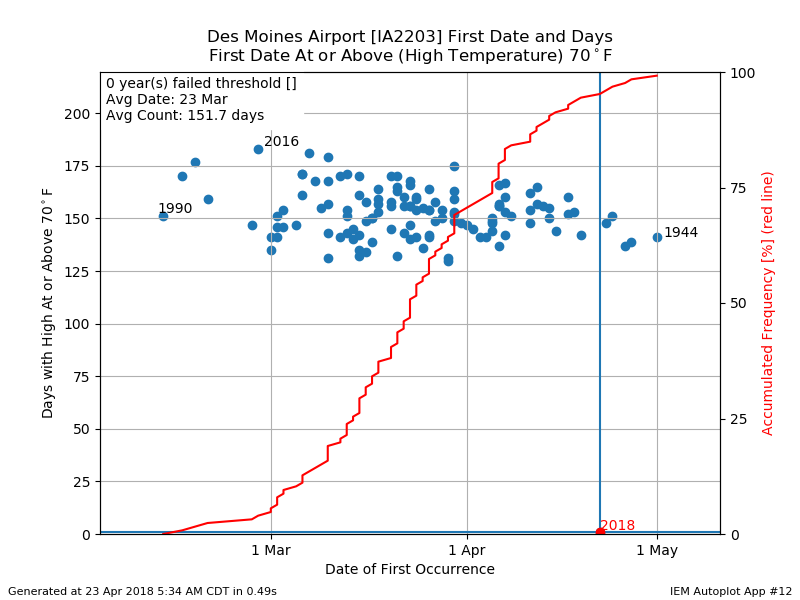
Late for First 70+
23 Apr 2018 05:35 AMIt was like a miracle occurred and temperatures were above average on a Sunday for much of the state, well sans the areas still with some pesky snow cover left. Des Moines hit 70+ for the first time this year. With the date being 22 April, this was one of the latest dates on record for the site as shown by the featured chart. The chart compares the first date of hitting 70+ for the high temperature and the number of days that year at or above that level. Having such a late date does not doom the season total as this level is hard to be under with most of the summer season.
Voting:
Good: 10
Bad: 0
Tags: 2018

Only Few Colder Easters
03 Apr 2018 04:32 AMEaster Sunday was very cold for Iowa. The high temperatures struggled to get above freezing. The actual date of Easter each year can vary from late March to late April and so the average temperature presented in the featured chart can be somewhat misleading. Even so, the high this year was way below the long term average and only a few previous years (2008, 1964, 1940, 1920, 1899, 1894) were colder. The forecast for the next seven days continues to show a struggle for warm or even average temperatures along with the snow that will fall today!
Voting:
Good: 11
Bad: 1
Abstain: 1
Tags: easter 2018