High temperatures today are expected to soar into the low 70s for much
of Iowa. The calendar does now say November, so one may expected the
staying power of such warm temperatures to be fleeting. The featured
chart presents the frequency of having a day above 70 followed by
another day over 70 by each day of the year. As shown by the chart,
the chances for early November are not good. Indeed, temperatures will
fall back into the 40s tomorrow as the warm up will be brief!
After high temperatures soared into the 70s on Tuesday, they will
struggle to do any raising at all today with some locations expected to
set their daily high temperature at midnight this morning. The
featured chart looks at the frequency of having the warmest temperature
of the day occur during the midnight hour for Des Moines. For
November, these frequencies equate to roughly 4-5 days per year.
Iowa got a preview of winter yesterday with some locations picking up
their first measurable snowfall of the season. This was thanks to a
process of cooling the air from having snow fall into warmer air near
the surface and cooling it from phase change into rain. The more
intense precipitation will lead to the strongest cooling rates and best
chances of snow in these situations. The featured chart presents a
comparison of average afternoon temperature against a composite of
RADAR reflectivity. In general, the coolest temperatures are
associated with the higher rates of precipitation.
The sham that is daylight saving time ends this weekend and so to
encourage those who wear tin foil hats, the featured chart is
presented comparing two periods of the day computed in CST and CDT.
For the work day, the difference is computed between the 8 hour
average temperature computed over the 8 AM to 4 PM period based in CST
and CDT year-round. The "CDT effect" is for a slightly cooler 8 hour
work day as compared to the same period if it was CST all summer.
This effect remains the same in the winter time, but lo and behold our
clocks go back to CST to reverse the effect. From an energy
perspective, the result is potentially favorable for businesses to
save a bit on cooling in the summertime and heating in the winter
time. It is a conspiracy! Of course, when we are at home, the effect
is reversed, so we have slightly warmer sleeping periods in the summer
with CDT and cooler sleeping periods in the winter with CST. Your
head is probably spinning trying to follow the logic presented, but
think how CDT shifts the work day into earlier in the day to leave
more light at night and time for lawyers to golf after work (net
cooler, less cooling bill). In the winter, the shift is for more
light in the morning (so that kids have light to go to school,
whatever) which puts more of the work day into hours with sunlight
(net warmer, less heating bill). Enjoy the extra hour of sleep :)
The featured chart presents the frequency of having a high temperature
above average and observed precipitation by day of the week so far this
year for Ames. Sunday has seen the highest percentage of days with
precipitation with Saturday having the least. Of course, over a long
enough time period, this plot evens out as there is not a physical
process that depends on day of the week. Precipitation is in the
forecast this week along with chances of measurable snow for the
northern parts of Iowa.
A winter storm watch was in effect for portions of Iowa this evening
and tomorrow for an approaching winter storm. The watch was upgraded
to a winter weather advisory with a few inches of snow expected. The
featured map presents the frequency of winter storm watches for the
past six years. Most of the state is shown in the 4-8 watches per
year.
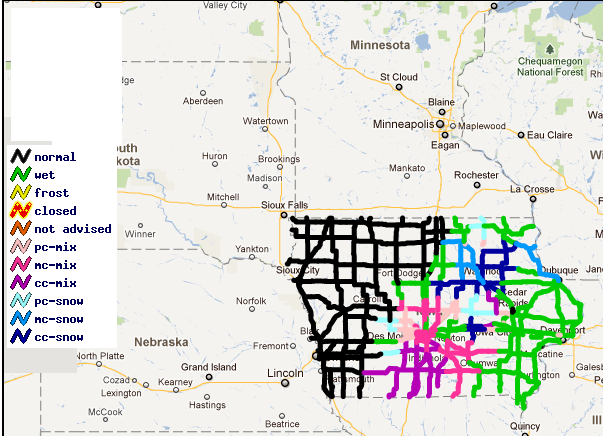
Our first major winter storm of the season is dumping wet snow over
most of the central portion of the state. Slushy snowfall totals have
been reported over 6 inches to the southwest of Des Moines so far this
morning. The featured map is of Iowa State Patrol road conditions
showing roads in southeast Iowa just wet with the snow covered roads to
the west in the central part of the state. This snow will have a tough
time sticking around as ground temperatures are still warm and air
temperatures are expected to be well above freezing during the daytime.
The first winter storm of the season is in the books dumping very wet
snow over swath of Iowa including most of Des Moines. The featured map
is a crude analysis of snowfall reports from the storm with the highest
totals around 6 inches. We'll produce maps like this after every storm
this winter season and you can find these maps later by clicking on
"Winter Storms of 2011-2012" link underneath "Most Popular Links" on
the homepage. Last year, we had 16 such maps, so we have plenty of
winter to go this year!
Having clear skies after a new snowfall always makes for pretty
pictures from space like the one featured today. The new snow cover
also makes for interesting local weather effects as can be seen by
afternoon high temperatures on Thursday. The snow reflects much of the
sun's energy back out into space which keeps air temperatures cooler
than neighboring snow free areas. This snow patch should continue to
decrease in size with more above freezing temperatures expected.
Outside of a very warm day for the first day this month, temperatures
have been to stay above average. High temperatures this past weekend
warmed nicely into the 50s, but cooler weather back in the 40s is
expected for most of this coming week. Highs in the 40s are about
average for this time of year, so it could certainly be much worse!
The featured chart presents an analysis of minimum reported temperature
so far this fall season. It would appear that practically all portions
of the state have seen a freezing temperature so far this fall season.
Some of the coldest weather so far this season is expected to arrive in
the state this evening with lows in the 20s and highs on Wednesday
barely breaking 40.
The past few days have seen bouts of severe weather over various parts
of the country. The Storm Prediction Center issues tornado and severe
thunderstorm watches in advance of these storms. The featured chart
presents the year to date totals of watches issued for Iowa and Texas
since 1997. Last year was the only year Iowa has beaten Texas in total
watches. The bottom chart shows the percentage of total watches issued
that covered a portion of Iowa. This year's percentage is the second
lowest behind 1997.
The precipitation total for this November has already exceeded the
total for all of October for Ames. The featured chart presents the
difference in precipitation between October and November each year for
Ames. 37 of the total 119 years have seen a wetter November than
October, so having this happen is about an one in three years chance.
There are only small rainfall chances in the forecast.
Thursday morning saw our coldest temperatures of the season with lows
approaching zero degrees in far northwest Iowa. The featured chart
presents the average first date of occurrence for a given temperature
for four sites in Iowa. It is interesting to see how much closer Ames
is to Sioux City than Des Moines. Davenport's climatology is about two
weeks later than Ames, so for example Ames hits its first sub freezing
around mid October and Davenport is toward the end of October.
After two very windy days on Friday and Saturday, Sunday was a bit
calmer as shown by the featured chart of daily average and peak wind
speeds from the Des Moines Airport sensor. November has yet to see a
day with wind speeds below 10 mph for the entire day. This is not
uncommon as November is a battle ground month for air masses, which
drive the windy conditions.
You may have remembered it like yesterday, but back on the 7th of July
the three cities of Burlington, IA , Miami, FL, and Fairbanks, AK had a
high temperature within two degrees of each other around 80 degrees.
Fast forward a bit more than 4 months and a much different tale is to
be told. While Fairbanks struggled to breach -30 degrees, Miami
enjoyed a warm 85 and Burlington was stuck somewhere the middle around
40 degrees. This graph makes the directional choice for Iowans going
on vacation in the winter easy.
The featured chart presents the range in forecasted morning lows and
afternoon highs from the "NAM" weather model output statistics (MOS)
and actual observations for the Des Moines Airport. The forecast for
Thanksgiving has high temperatures around 60 degrees, which is around
20 degrees warmer than average for this time of year! The warm weather
will be fleeting with rain chances for your trip home from
grandmother's house.
Temperatures have warmed nicely on Thanksgiving with 50s and 60s
reported in Iowa. For Ames, today is the warmest day since the first
of the month (23 days). The featured chart presents the number of days
prior to Thanksgiving that were cooler than the high temperature on
Thanksgiving. This year's total is the second longest on record!
Reality will set back in with highs back below average by next week.
Since setting record high temperatures on Thanksgiving, our weather has
been on the windy side with wind gusts measured above 30 mph each day
since somewhere in the state. The featured chart presents the
climatology of having one or more hours of wind observations at or
above 30 mph for each day of the year. The annual signal is clear with
these events more limited in the summer and peaking during the
transition seasons of spring and fall. There are some localized peaks
due to peaks in thunderstorms and strong winter storms.
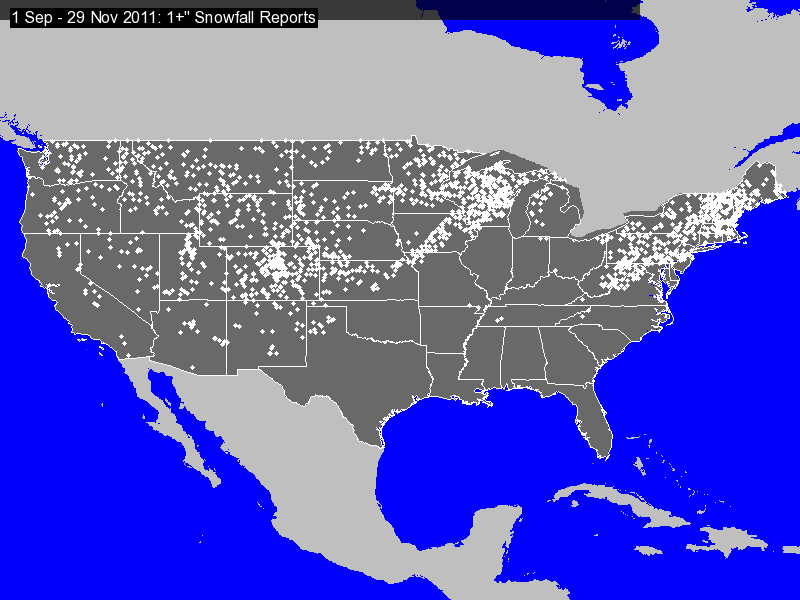
Snow was reported yesterday over locations well to our southeast in
Tennessee and Alabama. Not all in Iowa have yet to see their first
snowfall of the year! The featured chart presents the NWS Cooperative
Observer reports of 1+ inches of snowfall so far this year. Just a
swipe of snow from the 9 November storm is about all Iowa has to show
this year. There are chances of snow in the forecast for this coming
weekend.
The airport weather sensors for Des Moines and Ames are typically
called 'ASOS' sensors and lumped into the same data pile as they both
have similar sensors and maintenance standards. The featured chart
presents a summary of reported sky conditions at 6 AM each morning this
year. While these sites are only separated by 30 some miles, there are
some large differences in the number of clear mornings reported. The
difference here is that the Des Moines sensor has augmentors that
report cloud ceilings higher (to 25,000 feet) in the sky than the Ames
sensor can (to 12,000 feet). This is just one of the data quirks that
keeps life fun and various people employed to keep track of this all!