Past Features
This page lists out the IEM Daily Features for a month at a time. Features have been posted on most days since February 2002. List all feature titles.
Wed Oct 01, 2014

Another Cool Month
01 Oct 2014 05:23 AM
Preliminary September data is in the books and statewide it appears to come in just a bit below average. The featured chart plots the monthly temperature departures along with the monthly El Nino 3.4 Index values. These two variables are often compared, but the impact of the El Nino index on our weather is not considered to be instantaneous (there is some lag for what's happening over the central Pacific Ocean to reach us). You can now generate this chart for a time period of your choice and for other locations in the midwestern US.
Voting: Good - 8 Bad - 6
Generate This Chart on Website
Thu Oct 02, 2014

September Ranks
02 Oct 2014 05:43 AM
Climate Districts are a spatial aggregation that exist between individual counties and states that provide a map unit to produce estimated climate data on. The IEM generates daily spatially averaged estimates of precipitation and high/low temperature for these climate districts and has daily data available back to 1893. The featured map displays the rank of the September total precipitation for each of these districts. A value of one represents the wettest month. Even within a climate district, there is plenty of variability as convective rain events are on a much smaller scale and thus lead to large district to district differences in some cases.
Voting: Good - 18 Bad - 9
Tags: sep14
Generate This Chart on Website
Fri Oct 03, 2014

First Sub-50 High
03 Oct 2014 05:39 AM
A brisk taste of fall has arrived in Iowa for Friday with high temperatures struggling to reach 50 degrees in some locations. The featured chart looks at the last spring date and first fall date that the high temperature was sub 50 degrees for Ames. If Ames stays below 50 today, it would be a few weeks earlier than average but the calendar is now October so let it be fall! The forecast has warmer temperatures next week and pleasant conditions. We could use some dry weather to help the fall harvest to progress.
Voting: Good - 28 Bad - 24
Tags: 50
Generate This Chart on Website
Mon Oct 06, 2014

Fall Minimum Percentile
06 Oct 2014 05:40 AM
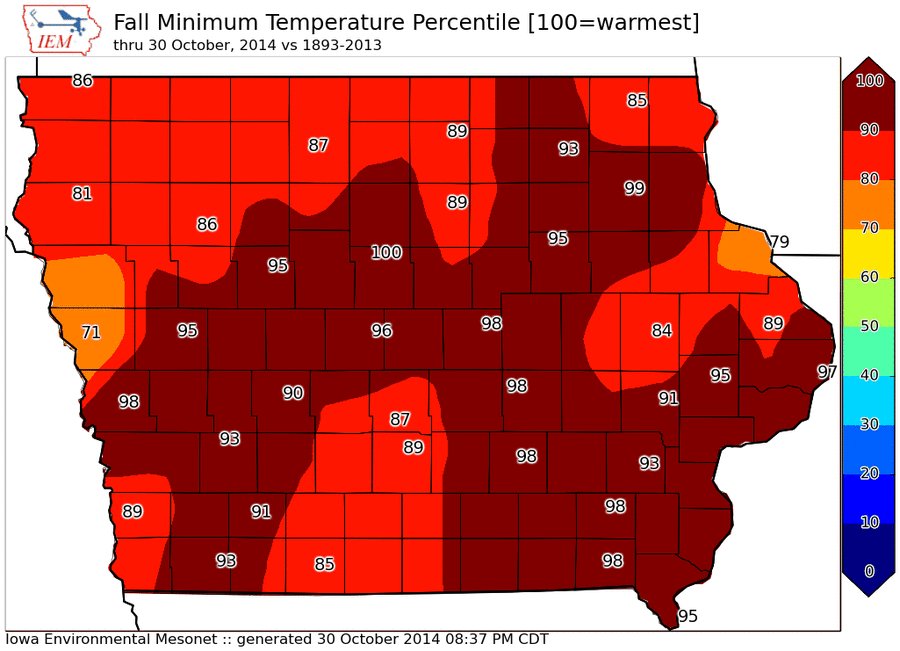
The coldest air of the season arrived this past weekend with some locations receiving snow flurries and frost. The featured map presents the fall minimum percentile to date comparing this year with past years back to 1951. There is some noise to this plot as a few degree difference can make a very large difference with the rank percentile. In general, we have been on the warm side of long term averages and the forecast looks to keep it that way for the rest of this week.
Voting: Good - 10 Bad - 13
06 Oct 2014 05:40 AM
The coldest air of the season arrived this past weekend with some locations receiving snow flurries and frost. The featured map presents the fall minimum percentile to date comparing this year with past years back to 1951. There is some noise to this plot as a few degree difference can make a very large difference with the rank percentile. In general, we have been on the warm side of long term averages and the forecast looks to keep it that way for the rest of this week.
Voting: Good - 10 Bad - 13
Tue Oct 07, 2014

Temperature Spreads
07 Oct 2014 05:40 AM
After a mild start this morning, temperatures are expected to warm nicely today to above average levels. The featured chart looks at the distribution of reported daily high and low temperatures for all long term sites in Iowa for the 7th of October. The solid line is the actual frequency with the dashed line representing a normal distribution approximately fitting the data. The high temperature distribution has a slight skew to the warm side of average as sunshine tends to help push to slightly warmer days than what we see with clouds and yet a warm soil.
Voting: Good - 13 Bad - 5
Generate This Chart on Website
Wed Oct 08, 2014

90 Degree Departures
08 Oct 2014 05:44 AM
The chances of Iowa reaching 90 degrees again this year are very slim, so the departures plotted on the map are likely final for much of the Midwest. The map compares the total number of days at or above 90 degrees this year with the average total from previous years. The really warm weather has been difficult to come by with most of Iowa analyzed in the 10-20 day range meaning we experienced 10 to 20 fewer days this year at or above 90 degrees.
Voting: Good - 17 Bad - 8
Tags: 90
Thu Oct 09, 2014

Fall Minimum to Date
09 Oct 2014 05:39 AM
The featured chart displays the climatology of minimum to date temperature for dates after 1 July. The trace for this year is shown as well for Ames. This year saw a very cold temperature arrive in mid September and we have only recently breached that level lower. As it stands now, we are about at average for the minimum temperature to date. You can generate this chart dynamically on the website and plot previous years for comparison.
Voting: Good - 17 Bad - 6
Tags: fall
Generate This Chart on Website
Fri Oct 10, 2014

Gas Mileage
10 Oct 2014 05:39 AM
The featured chart presents a summary of the primary IEM fleet vehicle's (IEM1) gas mileage and the monthly temperature climatology. Is there a relationship? The gas mileage is presented by monthly box and whisker plots showing the mean, range between 25th and 75th percentile, and the range is shown by the whiskers. The chart shows a clear annual signal with mean monthly gas mileage varying by +/- 10%. Is temperature the simple reason why this phenomena happens? The decline in the cold season is due to a number of factors related to temperature, these include decreased tire pressure, winter blend fuels being less energetic, battery and alternator inefficiencies, excessive idling to "warm up the car", and driving inefficiencies related to snow and ice.
Voting: Good - 30 Bad - 22
Tags: car gas
Mon Oct 13, 2014

Days till killing frost
13 Oct 2014 05:47 AM
The coldest air of the season visited Iowa this past weekend with many locations reaching their first sub freezing temperature on Saturday morning. For Ames, the temperature bottomed out at 31 degrees. The featured chart presents the number of days from the first sub freezing temperature until the first sub 29 degree temperature which is considered a killing frost. The slanted grid lines simply allow you to see the date that the dots fall on. So for having the first freeze on 11 October, we've previously waited up to 20 some days for the killing frost.
Voting: Good - 12 Bad - 11
Tags: freeze
Generate This Chart on Website
Tue Oct 14, 2014
Days since last Tornado Warning
14 Oct 2014 05:44 AM
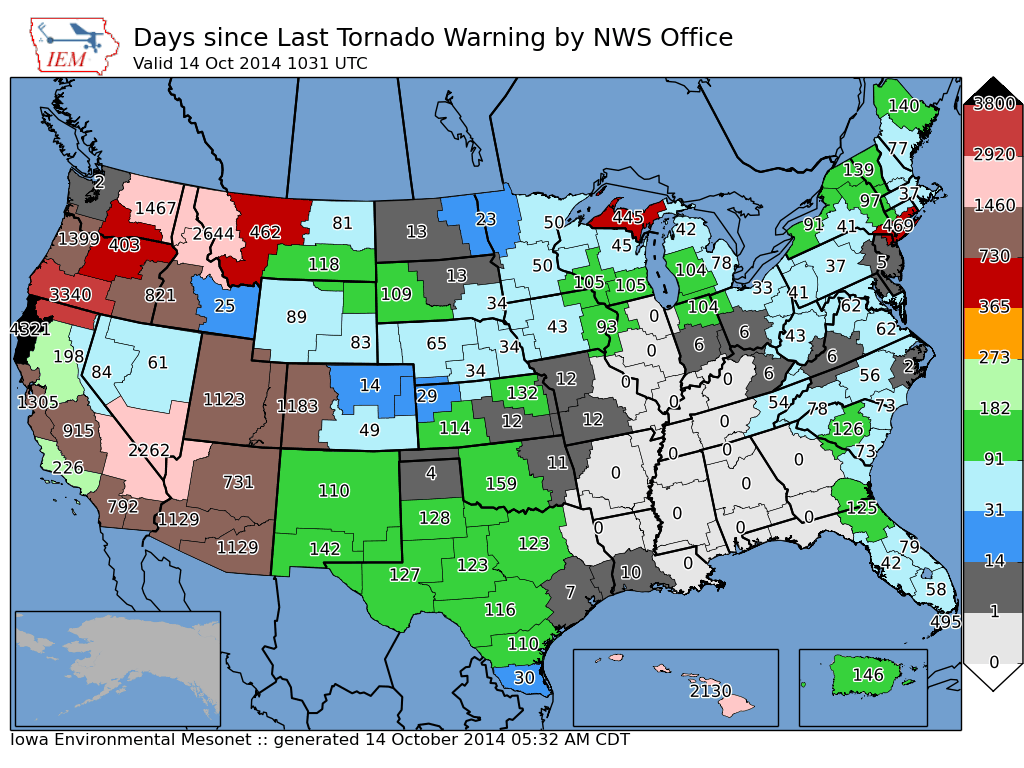
A powerful storm system that has brought us near non-stop rain for the past day also brought plenty of severe weather over the southern plains. The featured map displays the number of days since an individual NWS forecast office has issued a tornado warning. The numerous zeros plotted on the map show the extent of the recent warnings issued. Related to this, just last week, Seattle Washington office issued their first Tornado Warning since 1997! This particular map was popular on the Internet to show Seattle's tornado warning drought. You can generate this map for other warning products as well by clicking the "Generate" button below.
Voting: Good - 13 Bad - 6
Tags: tornado
Generate This Chart on Website
14 Oct 2014 05:44 AM
A powerful storm system that has brought us near non-stop rain for the past day also brought plenty of severe weather over the southern plains. The featured map displays the number of days since an individual NWS forecast office has issued a tornado warning. The numerous zeros plotted on the map show the extent of the recent warnings issued. Related to this, just last week, Seattle Washington office issued their first Tornado Warning since 1997! This particular map was popular on the Internet to show Seattle's tornado warning drought. You can generate this map for other warning products as well by clicking the "Generate" button below.
Voting: Good - 13 Bad - 6
Tags: tornado
Generate This Chart on Website
Wed Oct 15, 2014

October Rain
15 Oct 2014 05:45 AM
The recently departed storm system dumped a considerable amount of rainfall over much of the state. The featured map presents NOAA MRMS estimates for the 48 hour period prior to 7 AM last evening. Over four inches of rain was reported in the Pella - Oskaloosa area! All of this rain has further delayed an already late fall harvest of soybeans and corn. The good news is that the near term forecast does look mostly dry.
Voting: Good - 17 Bad - 8
Tags: oct14
Thu Oct 16, 2014

To Date Ranks
16 Oct 2014 05:42 AM
The featured chart displays the to date ranks of accumulated precipitation for intervals from 1 to 366 days prior to 15 October 2014 for Des Moines. The x-axis goes from right to left as each bar presents the respective rank for the number of days prior to yesterday. The chart shows how wet it has been this past year with most the ranks safely in the top 10. The lines on the chart represent the actual accumulations (red line) and the maximum on record (green line). Thankfully, we have dry weather in the forecast, so our rankings won't go any lower!
Voting: Good - 8 Bad - 12
Generate This Chart on Website
Fri Oct 17, 2014

In the 70s
17 Oct 2014 05:42 AM
Temperatures on Thursday were in the 70s, which is doing rather well for mid October. The featured chart presents the frequency of having the 3 PM CDT (2 PM LST) in the 70s. For October, the value is around 20% meaning that one in five days experience temperatures this warm. September and June are practically tied for the highest percentage, so if this type of weather fits your fancy than those are your favorite months.
Voting: Good - 29 Bad - 27
Tags: 70
Generate This Chart on Website
Mon Oct 20, 2014

Week of Mostly Dry Weather
20 Oct 2014 05:40 AM
Our recent weekend of weather was on the dry and mild side. This looks to continue this week, which is exactly what is needed to help the agricultural crop harvest to progress. The featured map is forecasted seven day precipitation from the Weather Prediction Center. Only small amounts of precipitation are forecasted over western Iowa with eastern Iowa dry. The crop harvest is a bit behind schedule this year thanks to a late maturing crop and wet conditions.
Voting: Good - 11 Bad - 5
Tue Oct 21, 2014

Corn Harvest Progress
21 Oct 2014 05:44 AM
The USDA released updated crop progress numbers on Monday. The featured map displays the statewide corn harvest progress along with the departure from long term average for approximately this time of year. Iowa and North Dakota are shown the furthest behind schedule. About half of Iowa's corn would normally have been harvested by now, but a late growing season and wet conditions have lead to delays. A very late harvest of the soybean crop has also delayed the corn harvest as farmers typically harvest the beans first. Our current weather and near term forecast look to help the progress tremendously as most will stay dry with very mild temperatures.
Voting: Good - 14 Bad - 7
Tags: corn
Wed Oct 22, 2014

October Ranges
22 Oct 2014 05:44 AM
This has been a rather tranquil October with temperatures within a range of 40 some degrees as shown by the featured chart. The range shown is simply the difference between the warmest high and coldest low for the month. The range this October, so far, is one of the smallest on record with only 1998 (38) smaller. Of course, this October is not over yet, but the forecast only has temperatures that may extend the range a bit higher on the warm side... An interesting data point on this chart is 1925 with the minimum that year at negative 7! In fact, the last three days of Oct 1925 all had lows below 10 degrees!
Voting: Good - 10 Bad - 9
Tags: oct
Generate This Chart on Website
Thu Oct 23, 2014

Last 70?
23 Oct 2014 05:42 AM
Temperatures are expected to warm nicely today and Friday, perhaps reaching 70+ degrees. The featured chart presents the first spring and last fall dates that the high temperature is 70 or greater for Ames. November 1 is about the average last fall date for 70+ degrees, so could the upcoming days of 70 be our last for the year?
Voting: Good - 13 Bad - 6
Tags: 70
Generate This Chart on Website
Fri Oct 24, 2014

Dense Fog Advisories
24 Oct 2014 05:44 AM
After the rain yesterday, skies cleared off and temperatures cooled creating dense fog this morning. The National Weather Service has much of the state under a Dense Fog Advisory this morning. The featured map displays the yearly average number of Dense Fog Advisories issued by forecast zone. The lines on the map are the edges of NWS forecast office zones. For Iowa, most of the state is in the 7-10 advisories per year range. The highest frequencies are near the Gulf of Mexico as the warm and humid air comes onshore and cools, creating fog. There is an interesting white patch over West Virginia. This is the Charleston, WV forecast office, which according to IEM databases has not issued a Dense Fog Advisory since at least 1 Jan 2006.
Voting: Good - 28 Bad - 12
Tags: nws fog
Mon Oct 27, 2014

Nice for Late October
27 Oct 2014 05:44 AM
High temperatures this past weekend were spectacular with much of the state reaching the 70s. The featured map plots NWS reported daily climate report data showing high temperatures on Sunday. Council Bluffs was able to reach 80, while parts of northeastern Iowa were stuck in the 60s. Hard to complain as type of weather is a treat for this time of year. One more day of warm weather today before cooler and more seasonable weather arrives on Tuesday.
Voting: Good - 17 Bad - 4
Generate This Chart on Website
Tue Oct 28, 2014

Trap Weather
28 Oct 2014 05:40 AM
After a very nice stretch of mid-fall weather, our weather looks to turn cooler. Temperatures on Tuesday will be a trap for those expecting to see a repeat of the recent past of warm temperatures. The featured chart looks at the maximum increases and decreases from a period of the five days of high temperatures. For example, the past five days for Ames had a high temperature at least above 69 degrees. If the high temperature on Tuesday is 54 degrees, this would be considered a negative 15 degree jump down for this plot. The chart shows that the expected change today is still much smaller than the most extreme on record. The high today would have to be about 39 degrees to match the shown extreme.
Voting: Good - 11 Bad - 6
Tags: high
Generate This Chart on Website
Wed Oct 29, 2014
2014 Daily Departures
29 Oct 2014 05:41 AM
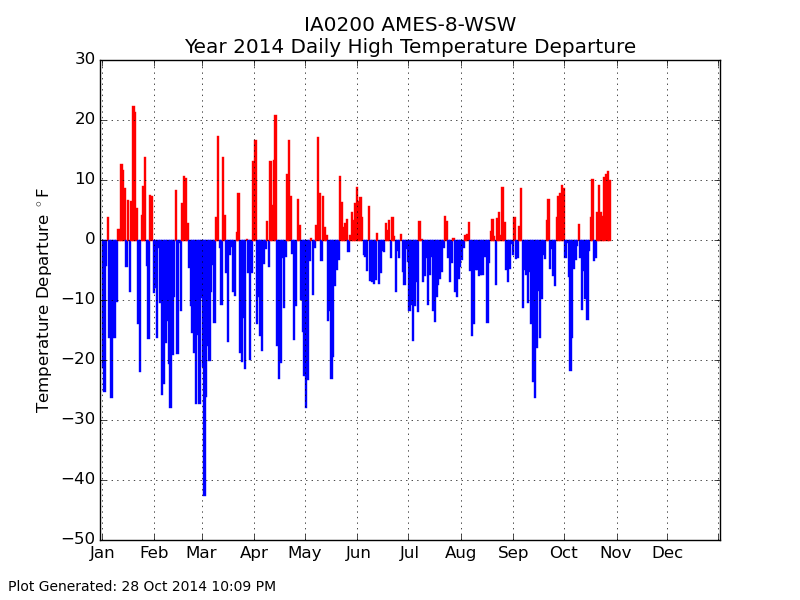
Up until yesterday, our recent stretch of weather has seen plenty of days with above average high temperatures. The featured chart displays the daily temperature departures for Ames this year. The red bars are days warmer than average and blue bars would be cooler than average. There have been plenty more days below average this year and particularly over this summer. The forecast for the rest of this week has mostly below average weather.
Voting: Good - 9 Bad - 8
Tags: 2014
Generate This Chart on Website
29 Oct 2014 05:41 AM
Up until yesterday, our recent stretch of weather has seen plenty of days with above average high temperatures. The featured chart displays the daily temperature departures for Ames this year. The red bars are days warmer than average and blue bars would be cooler than average. There have been plenty more days below average this year and particularly over this summer. The forecast for the rest of this week has mostly below average weather.
Voting: Good - 9 Bad - 8
Tags: 2014
Generate This Chart on Website
Thu Oct 30, 2014

Last colder than first of month
30 Oct 2014 05:43 AM
October is ending on a very chilly note with highs on Friday expected to only be in the lower 40s. This temperature will be much colder than the high on October 1. The featured chart presents the observed frequencies of having the last day of the month being colder than the first day of the month. For the fall months, the frequencies are all over 80% so this situation is certainly common.
Voting: Good - 15 Bad - 6
Fri Oct 31, 2014
Warm Fall Minimums
31 Oct 2014 06:55 AM
Up until today, the minimum fall temperature so far has been rather warm. The featured map displays the percentile rank that this year's fall minimum compares with the long term climate sites in Iowa. For much of the state, the percentile rank is 90 and higher. Low temperatures this morning are well below freezing for most of the state as it appears the first wide spread killing frost has come to Iowa.
Voting: Good - 22 Bad - 15
Tags: 2014