After one of the wettest Junes on record, July was on the cool and dry side of average.
The featured map displays calculated monthly precipitation totals from the automated
airport weather sensors in the state. Only a few locations were above average with many
others well below and even below an inch for the month. After having mostly eliminated the
drought situation in the state during June, it may start creeping back in unless rain
returns.
The featured chart looks at the combination of growing degree day (base 50) and
precipitation departures for the month of July over the state of Iowa. This year's July was
one of the coolest on record and on this chart shows up about normal for precipitation.
The departure metric used is in units of sigma or one standard deviation based on the
distribution of historical GDD and precip totals for July. The circle on the chart represents
the distance from the origin the 2014 value was with more extreme years labelled on the
chart. It is interesting to see four of the past six years labelled on this chart meaning that
most of our recent Julys have been extreme!
For some locations in the state, like Ames, this recent July failed to reach 90 degrees.
The featured chart displays the yearly maximum temperature reported during July. While
the long term average is near 96 degrees, most of the recent years have struggled to
reach that level. The 1930s show up prominently on this chart with a stretch of around 15
years all above current long term average. The near term forecast does not hold much
hope for significant heat.
Widespread rainfall has been difficult to come by recently as shown by the featured chart.
The chart attempts to estimate the areal coverage of the state that has received a total of
one inch of precipitation within the period of the trailing seven days. Rewording, what
portion of the state has seen an inch or more over seven days. Since mid July, our rainfall
events have been widely scattered and you can see the change in coverage from the wet
period in June. Precious rainfall is falling this morning over Iowa with more chances in the
forecast.
After numerous heavy rainfall events in June, the spigot had mostly closed in July with
rainfall events few and far between. Heavy rainfall returned to the state on Wednesday
with some locations in western Iowa receiving over 4-6 inches! The featured map is
estimated precipitation totals based on RADAR from the MRMS project. While its totals
are perhaps a bit overdone, some very localized spots probably got over six inches
yesterday. More rainfall is in the forecast for today, but totals will be much smaller.
Temperatures were again a struggle on Thursday with highs near 70 instead of our
average near 85! For Des Moines, the high temperature was only 71 with a low
temperature of 68. This three degree difference between the high and low was the
smallest such difference on record for the site for August. The featured chart presents the
smallest difference in daily high and low temperature by month. The "largest" values are
during the summer time when it is extremely difficult to prevent the sun from even slightly
heating the ground. The forecast looks cool and dry, which should make for great Iowa
State Fair weather!
Even having the Iowa State Fair currently in session could not provoke hot temperatures
as our cool summer drags on. The featured chart compares the period between growing
degree day accumulation value 1135 and 1660 (important for corn) by planting date for
2012 and 2014. It has taken seven to eight more days this year to accumulate the same
number of GDDs vs 2012. For later planting dates, we have yet to even complete this
accumulation (gray bars). Slow GDD accumulations during this highlighted period is
considered good for corn yield production, but it comes at an expense of concerns of early
frost and late/wet corn harvest moisture.
After yet another recent wet spring, the later part of summer has turned dry again. The
featured chart looks at the recent 20 years of monthly precipitation reliability. The metric
plotted is the number of years that the given month had above 100% of average
precipitation for the month. These values are for Ames. Rewording, 70% of the past 20
years had above average precipitation for April. So while April is shown with the highest
value, September has the lowest at just 30%. This chart can be dynamically generated on
the website, so please try different thresholds and periods to see what results you get!
As has been the pattern for the recent years, a wet spring has been followed by a dry mid
to late summer. For some parts of the state, it has been 40 some days since the last
calendar day with over a half inch of rainfall as shown by the featured map. For these
areas, the last major rainfall was on 30 June. Chances for rain are in the forecast, so
hopefully the rain falls on the areas that need it the most.
Intense Flash Flooding has impacted the eastern United States this week. A truly epic
amount of rain fell in Islip, New York on Wednesday with a 24 hour total of 13.57 inches
likely breaking the state's all time precipitation record. The featured chart displays the one
minute interval precipitation data for the ASOS site. The instantaneous rainfall rates were
sustained at over four inches an hour for two hours! The IEM has documented other
heavy rainfall events over the past years from the ASOS sensors and this event is
remarkable because the instantaneous rates were so consistent. Other events typically
had very short duration intensities over 10 inches per hour. The "generate this chart"
button provides the raw data for this chart.
Our cool summer has continued in August with not much heat to speak of during the day
and very sleepable overnight low temperatures. The featured chart presents the number
of days with a low temperature below 60 for Des Moines for July. This July had the
second most on record and firmly above any recent year. The forecast has slightly
warmer overnight temperatures with the return of some humidity, but highs will continue to
struggle.
Slow moving storms dumped large amounts of rainfall over southern Iowa on Saturday with
totals in the three to six inch range. The featured map displays estimated precipitation
totals for August based on NCEP stage IV data. This analysis shows portions of
northeastern Iowa receiving less than a tenth of an inch while parts of southern Iowa are
over eight inches for the month! The good news is that the dry area is expected to receive
rainfall today, but it may come at the expense of some severe weather.
The Iowa State Fair ended on Sunday. The eleven day event had amazing weather with the
featured chart showing the average daily high and low temperature for the period based on
Des Moines Airport data. The average high was in the mid 70s and low near 60, which
makes for the third year in a row with cool weather for the fair. The heat and humidity
waited until the fair ended to make its first major appearance this summer with conditions
warming up until this coming weeking.
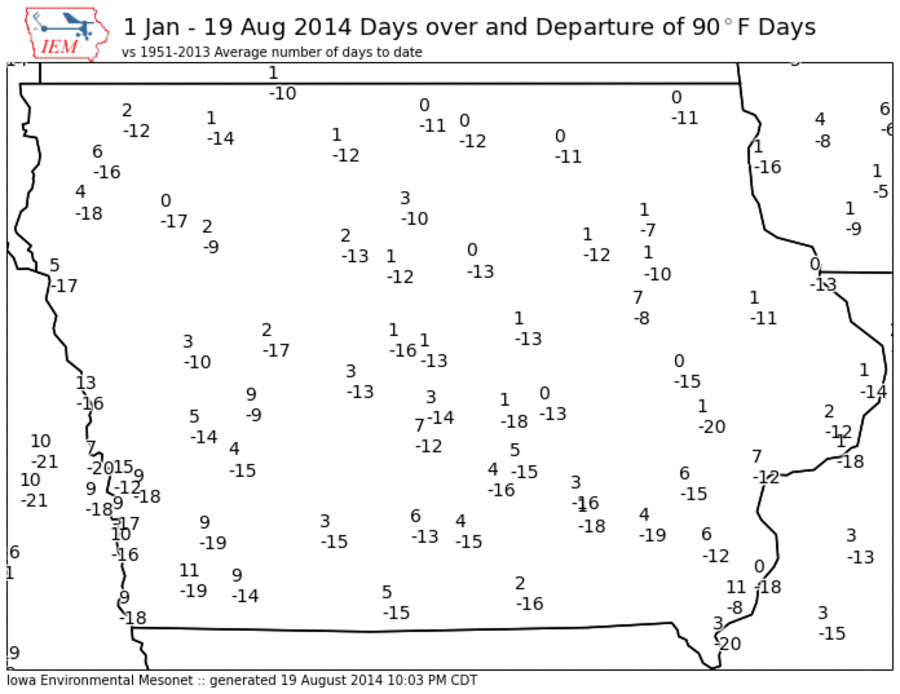
Getting really hot summer weather continues to be a struggle for much of the Midwest this
year. Even getting days above 90 degrees are few and far between as shown by the
featured map. Two values are shown for each of the primary automated weather stations
in the state with the top value being the number of days at or above 90 and the bottom
value being the departure from long term average for number of days above 90 (year to
date). There are still a number of places in the state that have yet to reach this level of
warmth. The forecast does hold some hope of reaching this threshold during the next few
days.
Growing Degree Day accumulation has been difficult this year thanks to the cool conditions
that have persisted for most of the summer. The featured chart compares the summer to
date accumulation since 1 May for this year, 2013, 2012 and 2009. This year has
resembled 2009 quite closely and current deficits are below negative 200 units. There are
warm temperatures in the current near term forecast, but it is starting to get late in the
season as we are nearly to September 1 already!
The big story this summer is the lack of heat leading to a deficit in growing degree day
accumulation. The featured chart displays the daily accumulation this year (dots) and the
long term climatology (red line and filled segments). The brown extent represents the
majority of the long term data range. You can see a number of days this year on the low
end of the daily distribution and only a handful of dots above average since the start of
July. Heat has arrived this week in Iowa, but next week looks to be back below average
for this time of year.
The increase in humidity has been noticeable for the past few days. The featured chart
displays the maximum dew point temperature for each day this year for Ames. This is
based on the hourly observations made at the airport site. For July of this year, the very
humid periods were brief with some days even having a maximum dew point below 60!
The humidity looks to stick around a bit longer this week with cooler air temperatures
expected by the end of the week.
The featured chart attempts to answer the question about how much of our yearly
precipitation falls during severe weather. For this analysis, the proxy for severe weather is
having an active severe thunderstorm or tornado warning active. The chart shows the
absolute and relative contributions of yearly precipitation during warning events, for a
period one hour before and one hour after the warning event, and then all other times. For
the past decade , during which we have one minute precipitation data from the Des Moines
Airport, the relative contribution ranges from about 5 to 20%. The chart average is about
10% or just over 3 inches per year.
We have had quite the stretch of wet weather in August with rain once again falling this
morning over western Iowa. The featured chart displays estimated coverage of a quarter
inch or more of rainfall since 1 June. We are approaching two weeks straight of such
intensity rainfall falling somewhere over Iowa. The rain looks to continue until perhaps a
brief break this weekend.
After finally getting a period of hot and muggy weather typical for summer in Iowa, our
weather has reverted back to pleasant afternoon temperatures. Could we see another
day above 90 this year? The featured chart looks at the combination of days above 90
degrees and the last day of the year that had a 90+ degree temperature for Des Moines.
The red line represents the accumulated frequency. For example, 40% of the years have
had their final 90 degree temperature by 1 September. It will be interesting to see how
2014 finishes on this chart as the total number of days so far has been paltry.
The featured chart compares the weekly USDA corn crop condition report for six states for
each of the past years since 1986. The black line represents the percentage of corn
acres rated as either poor or very poor condition for 2014. You can see that for all of
these highlighted states, the corn crop is doing very well! Some of the years with poorly
rated crops are also highlighted on this chart. Not every year was a bad year for each
state. At this point, there is a great deal of optimism that a large corn harvest is on the way
but a significant number of heat units are still necessary to reach maturity.