The calendar has mercifully turned to July today and the epic rainfalls that occurred in
June are hopefully in the past. The last day of June saw yet another significant storm
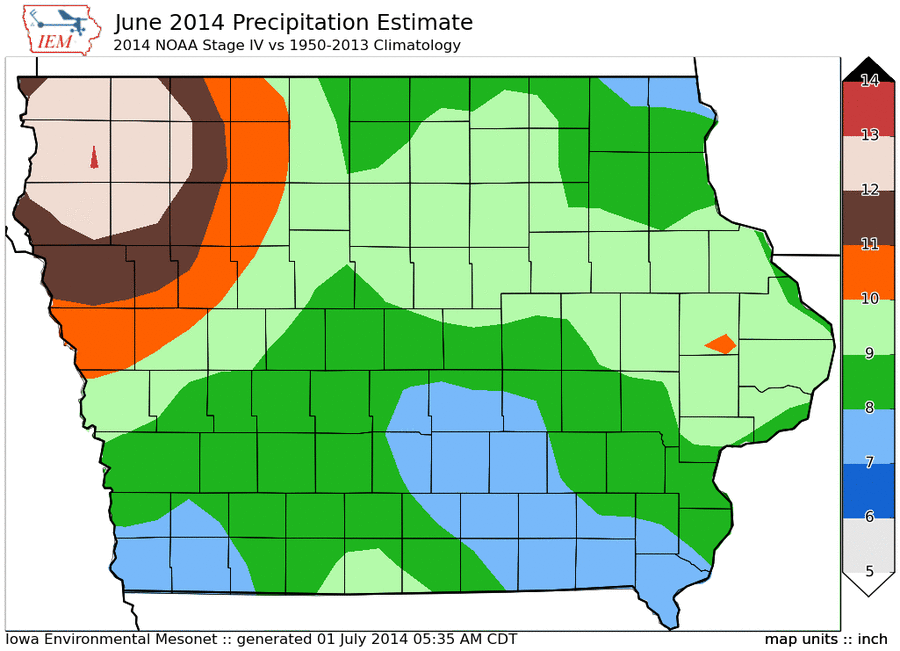
complex dump large amounts of rainfall over the state. The featured map is a preliminary
attempt to analyze how much rain fell over the state for the month. The highest totals
were over northwestern Iowa with values over twelve inches. Of course, this map is
smoothed and isolated areas likely picked up more than the totals displayed. The good
news is that drier weather is in the forecast for this week and much cooler conditions as
well.
When the local National Weather Service offices issue severe thunderstorm warnings,
they include information on the magnitude of the hail and wind threat forecasted. So each
warning contains expected hail size and wind speed. The featured chart presents the
frequency of these threats since they were implemented in the warning product. Our most
recent severe weather event on Monday had four warnings issued for 80 mph winds and
seven warnings for two inch hail or larger. The hail size must be one inch diameter or
larger to verify the warning. The wind speed must be greater than 58 mph for it to verify the
warning.
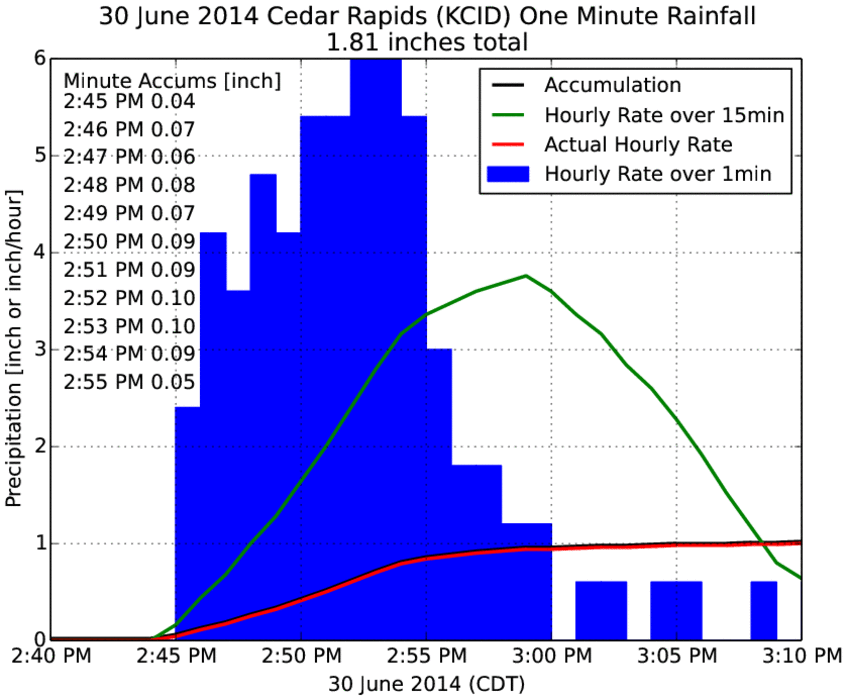
The most recent storm system on Monday brought large hail, damaging winds and some
intense rainfall. The featured chart displays 30 minutes worth of one minute interval
precipitation from the Cedar Rapids Airport. Just under an inch fell between 2:45 and 3
PM, which makes for an approximate four inches per hour rate! The storm system had a
fast forward propagation rate, so rainfall totals did not get out of hand for this event.
Up until Sunday, temperatures had been struggling well below average for July in Iowa.
The featured chart displays the daily high temperature percentiles for Des Moines. The
second was the second coldest high temperature on record for the date. The heat
returned on Sunday along with very muggy air which helped to fire some strong
thunderstorms over eastern Iowa. More storms are expected today.
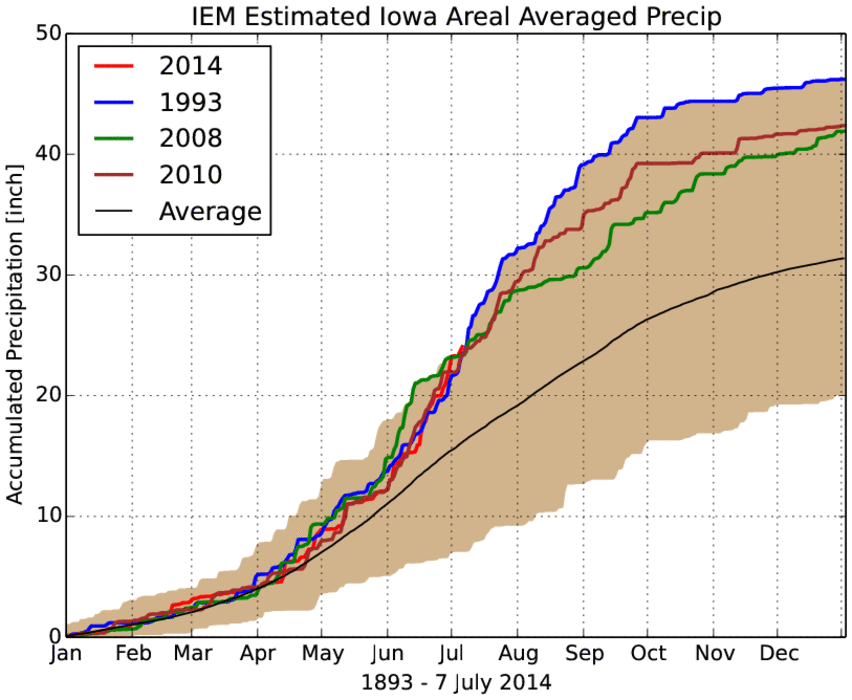
For the year to date period, this year ranks as one of the wettest on record for statewide
averaged precipitation. The featured chart compares this year with recent flood years for
the state along with the long term average. For 1993, July brought epic rainfalls and the
blue line on the chart shows the rapid accumulation for that month. So while 2014 is
currently ahead of 1993, it will probably not last long.
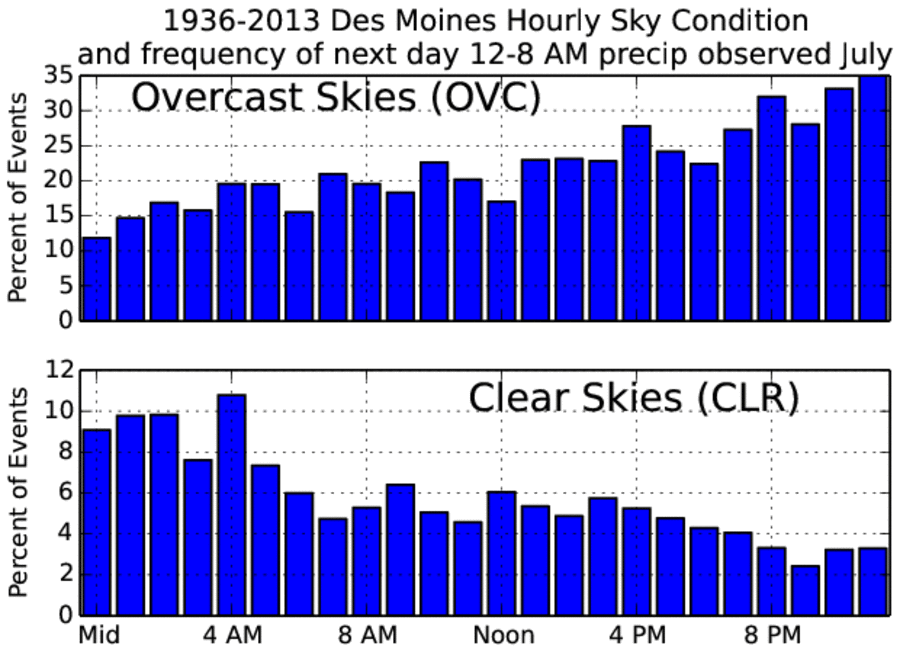
Skies were mostly fair on Tuesday with even the 4 AM observation reporting "clear" from
the automated airport sensor in Des Moines. The featured chart looks at the frequency of
having measurable precipitation for the midnight to 8 AM period the day following an hour
with a given cloud coverage reported. In general, having overcast skies have more
frequent rainfall events than clear skies which makes intuitive sense. Of course you have
to have clouds for it to rain, so having overcast conditions later in the day leading up to the
next day increases the frequency and having clear skies decreases the frequency. The
overall frequency of having rainfall sometime during the 12-8 AM period in July is around
15%.
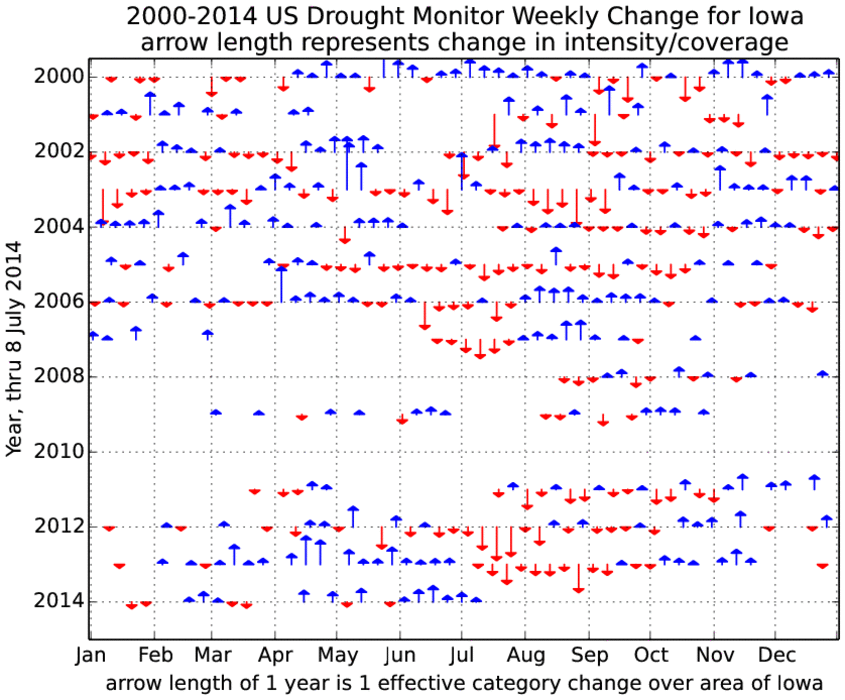
The wet month of June has mostly eliminated the drought situation in Iowa as analyzed by
the US Drought Monitor. This monitor product is updated weekly by a national team of
experts and depicts various intensities in drought. The featured chart looks at the weekly
changes in this analysis with blue lines being improvements and red lines are
degradation. It will be interesting to see if this July/August follows the previous three
years with drought quickly developing after the heavy rainfalls of spring and early summer
subside. The length of the arrows indicate a relative intensity change with the unit value
being an equivalent one category change over the area the size of Iowa.
Much was made this previous winter about the "polar vortex" and the biblical outbreaks of
cold weather it brought the eastern half of the country. Tongue-in-cheek, the vortex
appears to be back next week with high temperatures forecasted to struggle in the upper
60s and 70s. The featured chart presents the average high temperature for Des Moines
for the 14-19 July period. This should be about the warmest period of the year, but
instead will be some 12 degrees below average.
Based on data from the Ames Airport, 90+ degrees has yet to be achieved this year for
Ames. The featured chart presents the number of days at or above 90 degrees to date for
each of the past years since 1893. The average is about 8 days and most of the recent
years have failed to reach that level. The advertised cool weather this week has arrived,
so there is little chance of reaching 90 this week. Warmer weather is in the forecast for the
following week, so perhaps 90s will finally show up for Ames.
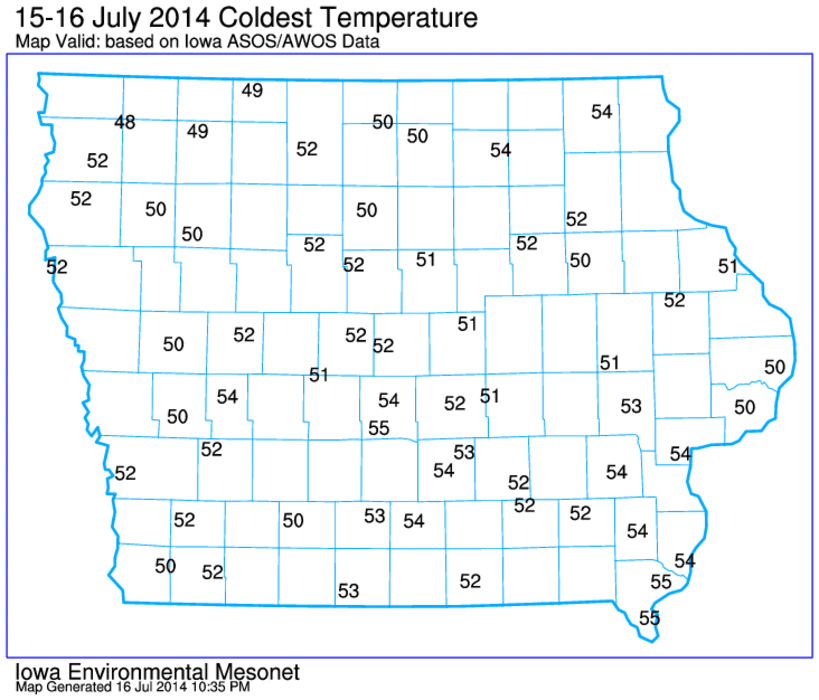
Low temperatures this morning are in the lower 50s and some spots may bottom out in the
upper 40s this morning! Needless to say, this is very chilly for July. The featured map
displays the coldest July temperatures reported by the long term client sites in the state.
We still have 5-15 degrees to go from this morning's levels before reaching all time lows.
We will take another run at these temperatures tomorrow morning before a slow
moderation into this weekend occurs with typical July temperatures arriving for next week.
There is some current talk in the news about US corn yield projections and Iowa pulling
down the average due to the very wet June in the state. Does having a really wet month
during the growing season lead to significant reductions in corn yield? The featured chart
attempts to look into this using USDA NASS corn yield compared with the largest
precipitation departure month for that year. The yield departures are computed by
comparing with the current trend analysis as corn yields have increased thanks to better
management practices, genetics, etc. Of course, there is no magic weather metric that
directly provides corn yield, but having a wet month certainly appears to limit the upside
potential. The dashed line shows where 2014 could potentially appear on this plot.
The featured map displays the coolest low temperature reported by the Iowa ASOS/AWOS
sites for Tuesday and Wednesday this week. Temperatures have once again dipped into
the lower 50s this Thursday morning. We can only go upwards from here and the forecast
has temperatures climbing back to seasonal levels by this weekend with muggy weather
returning next week. It is kind of a treat to have such cool weather during the warmest
period of the year.
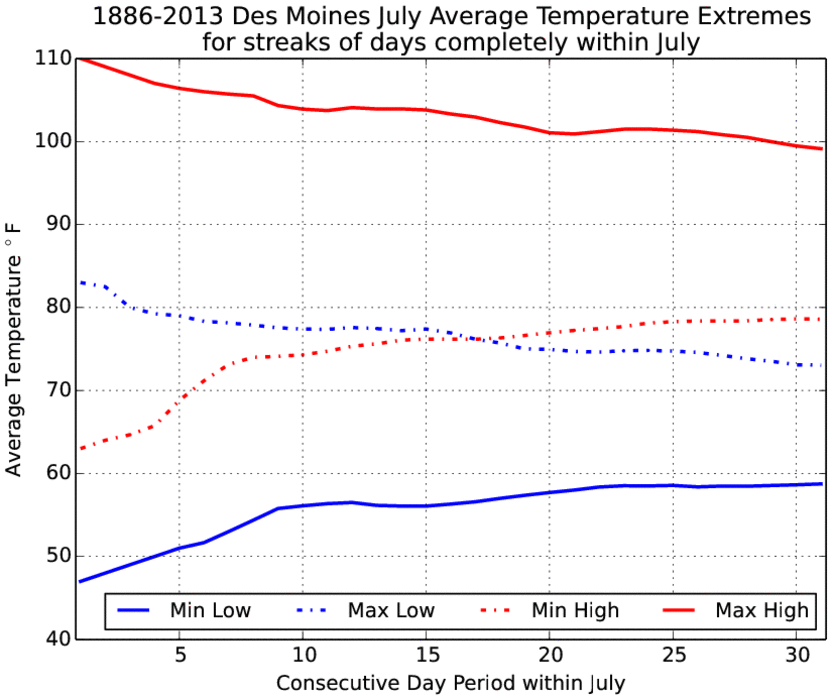
The featured chart represents the warmest and coolest stretch of days in July for high and
low temperature for Des Moines. Only consecutive days completely within July are
considered. For example, for a ten day period the maximum average high temperature
was around 105 and minimum near 75. This week's cool weather has not exceeded any
of these values.
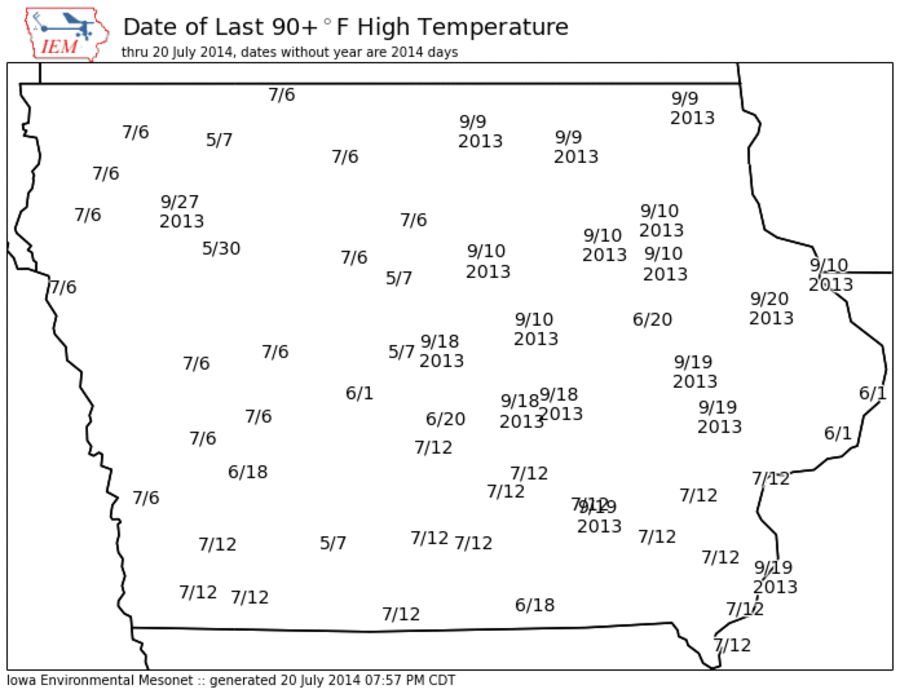
The cool July weather of last week is about to be a distant memory as hot and muggy
conditions are set to arrive today. This could not be worse timing for RAGBRAI (bike ride
across Iowa) as participants will certainly wish the ride was last week! Anyway,
temperatures are expected in the 90s, which will be the first 90 degree temperature for
some locations in the state this year as shown by the featured map. For parts of eastern
Iowa, it has been ten months (last September) since the last 90 degree temperature. Dew
points will be the highest so far this year as well, making for dangerous heat index values.
Our experience with hot summer conditions was brief with heat indices on Monday and
Tuesday topping 100 degrees over much of Iowa. The featured map presents an analysis
of maximum heat index for the two days. Cooler weather is back again and temperatures
look to remain very pleasant in the low to mid 80s. Could the past two days be the worst
that summer has to offer us this year?
The Waterloo Airport finally hit 90 degrees this week and it was the first time this year to
reach that level. The featured chart presents the number of days per year Waterloo
reaches or exceeds 90 degrees for the year to date period ending today. On average,
eleven such days have occurred by now. The chart shows how the most of the years with
over 20 days happened prior to 1940. The forecast does not have much hope for 90s in
the near term future.
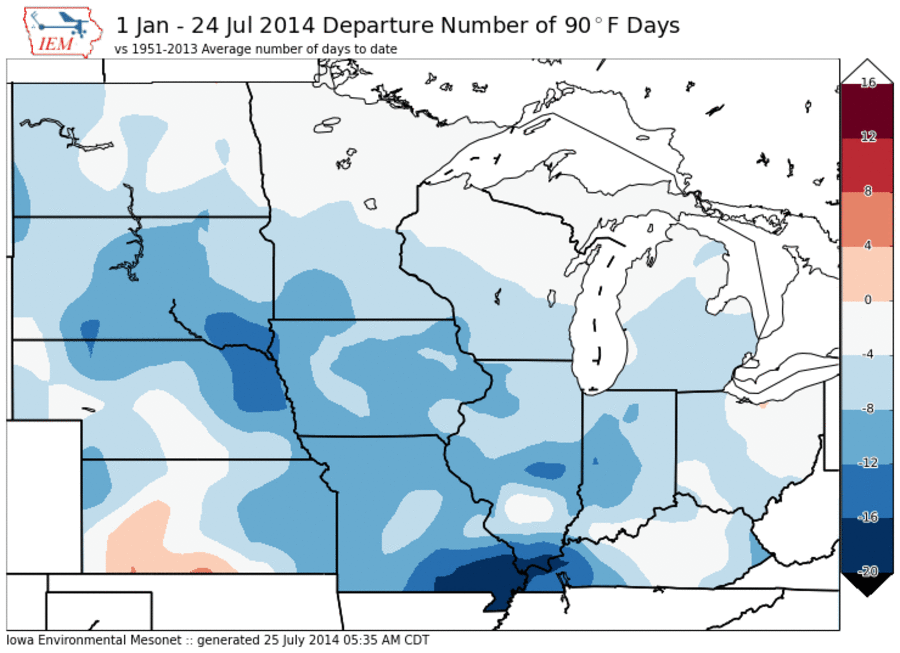
The IEM Daily Feature this week has obsessed over the lack of days this year with a high
temperature at or above 90 degrees. This is an arbitrary level picked for no good reason
other than it being a number ending in zero. Anyway, the featured map is an attempted
analysis at showing the departure this year for number of 90 degree days versus what
would be expected. Of course, the numbers are relative as some areas have yet to see
any day that warm and only have a small departure shown as they don't typically get as
many days as places further south and west do. Only parts of Kansas is shown on this
map with positive departures (more 90 degree days than climatology would suggest).
High temperatures on Sunday once again struggled in the 70s, which is a very pleasant
treat for July in Iowa. This July has seen plenty of cool days which adds up to one of the
coolest July's on record as highlighted by the featured chart. The average temperature
(mean of daily high and low) for the month is shown along with the coolness rank over the
number of available years. This unofficial ranking has the Quad Cities and Davenport on
its way to the coldest July on record. It is interesting to see how much different Des
Moines appears on this chart. Outside of a sensor calibration issue, the first obvious
explanation is the Urban Heat Island affect that is most pronounced for that site in Iowa.
The featured chart presents the average weather during the week of RAGBRAI as
approximated by the weather reported at the Des Moines Airport. RAGBRAI is an annual
bike trip from west to east across Iowa. There were a few warm days this year, but not as
bad as it has recently been a few years ago as shown by the top panel with average heat
index during the daylight hours displayed. The bottom panel shows the average east -
west wind speed as an approximation to the amount of head or tail wind bikers would have
experienced. Either this week or two weeks ago would have been much cooler than the
previous week, but too late now to move the ride!
What should be the warmest portion of the year has been chilly with temperatures running
below average. The cool weather has put Growing Degree Day accumulations behind
schedule which leads to worries that crops will not reach maturity prior to the first fall
freeze. The featured chart attempts to provide the chances that a certain GDD threshold
will be met by a certain date this fall given an initial planting date. For example, for a crop
planted on May 1 and needing 2600 GDD units has reached that level by 15 September
50% of the time in the past. For this year, the same combination comes in around 15%
given that our upcoming weather somewhat mimics historical data. You can generate
more charts like this on the website under "Ag Weather" and then GDD "Probabilities and
Scenarios" or directly here.
The featured chart presents the number of times a given daily temperature or precipitation
record was either set or tied for Ames. The algorithm used for this plot established the
daily records in 1893 and then counted how many times that baseline record was tied or
bested for each day of the year. The overall chart average is around 4 days, which
means that a daily record is tied or bested during four years of the period since 1894.
There are some interesting artifacts in the plot, like the 11 day value in January for low
temperature and the low numbers for high temperature in July as the records were set
very high during the 1930s and not bested since.