Automated Data Plotter
This application dynamically generates many types of graphs derived from various IEM data sources. Feel free to use these generated graphics in whatever way you wish.
1 Select a Chart Type
2 Configure Chart Options
Plot Description:
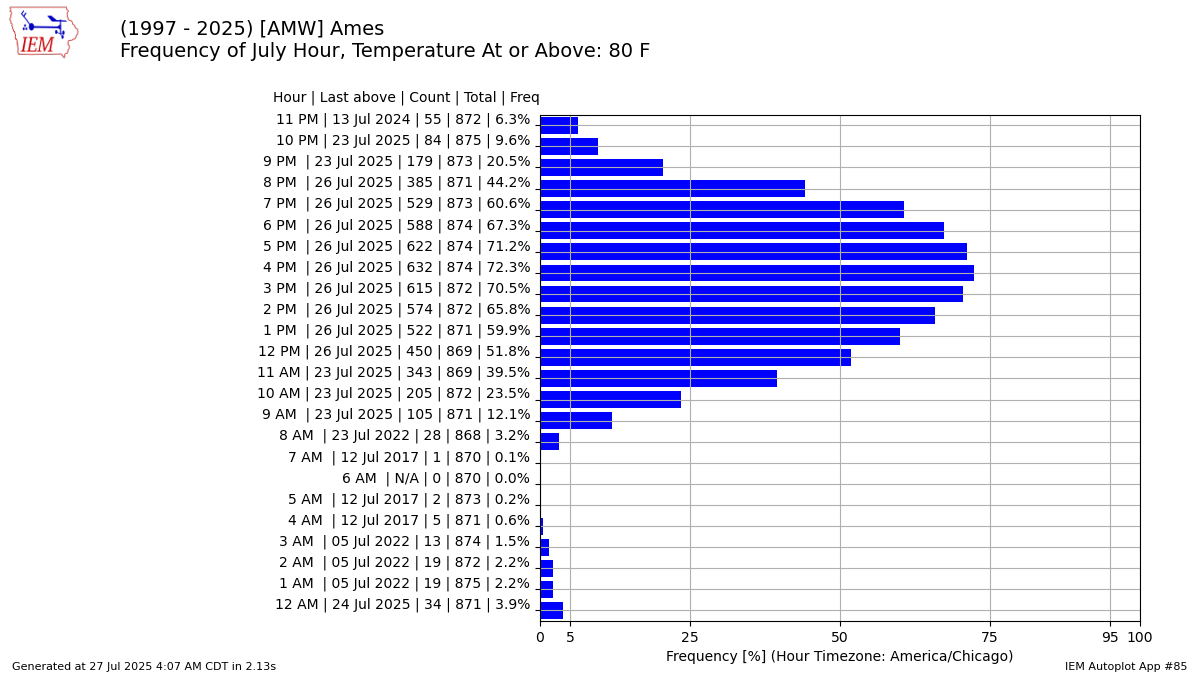
Based on IEM archives of METAR reports, this application produces the hourly frequency of a temperature at or above or below a temperature thresold. This application tries to only consider the top of the hour reports.3 Generated Chart
Based on recent timings, plot generation averages 4 seconds. Please wait while your chart is being generated...
If you notice plotting issues with the image above, please
contact us
and provide the URL address currently shown by your web browser.
IEM Daily Features using this plot
The IEM Daily Features found on this website often utilize plots found on this application. Here is a listing of features referencing this plot type.
- 28 Jan 2025: Low January Relative Humidities
- 26 Dec 2024: Above Freezing in December
- 08 Mar 2023: Below 40 during March
- 11 Jun 2021: 90s During June
- 15 Nov 2019: November Hourly Temps
- 06 Dec 2018: 40+ in December
- 26 Apr 2017: 70+ in April
- 14 Jul 2015: 80 at 7 AM