Automated Data Plotter
This application dynamically generates many types of graphs derived from various IEM data sources. Feel free to use these generated graphics in whatever way you wish.
1 Select a Chart Type
2 Configure Chart Options
Plot Description:
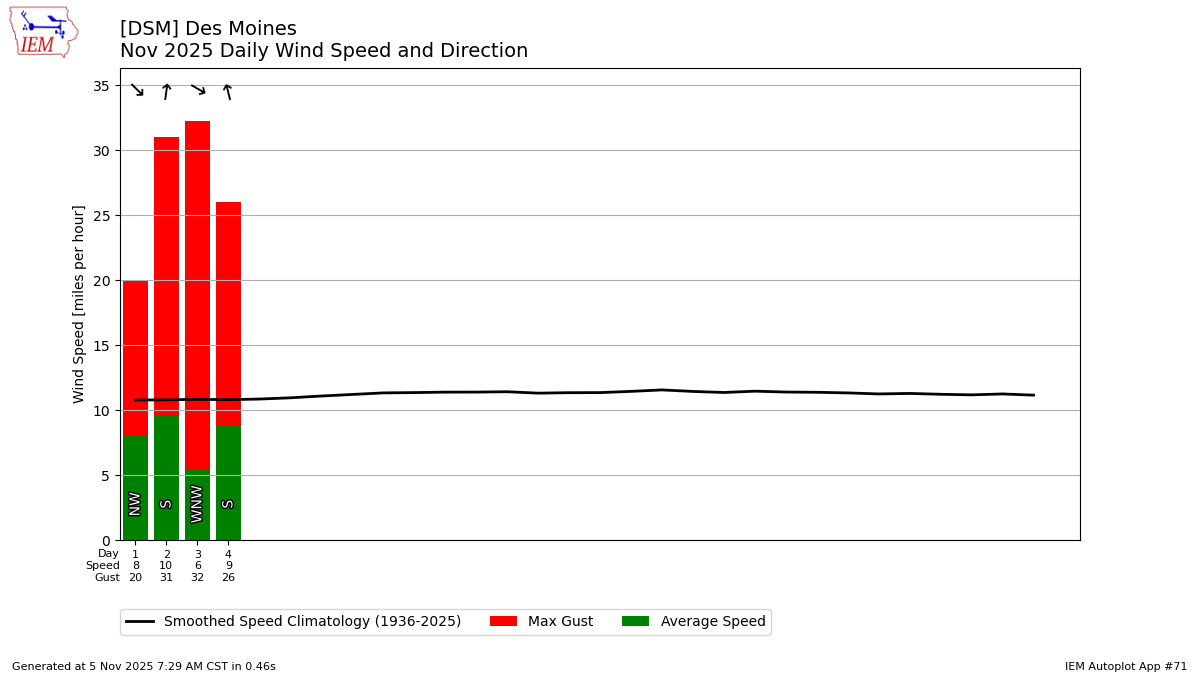
This plot displays daily average wind speeds for a given year and month of your choice. These values are computed by the IEM using available observations. Some observation sites explicitly produce an average wind speed, but that is not considered for this plot. You can download daily summary data here. The average wind direction is computed by vector averaging of the wind speed and direction reports.3 Generated Chart
Based on recent timings, plot generation averages 1 seconds. Please wait while your chart is being generated...
If you notice plotting issues with the image above, please
contact us
and provide the URL address currently shown by your web browser.
IEM Daily Features using this plot
The IEM Daily Features found on this website often utilize plots found on this application. Here is a listing of features referencing this plot type.
- 30 Apr 2025: April Daily Wind
- 15 Aug 2023: Windy August Day
- 15 Apr 2022: Continued Windy
- 13 Apr 2021: Windy April
- 15 Jun 2020: Another Windy June Day
- 09 Jan 2019: Plenty of Wind on Tuesday
- 29 Oct 2018: October Avg Daily Winds
- 24 Oct 2017: October Daily Winds
- 01 May 2017: April Daily Winds
- 28 Sep 2016: September Winds
- 28 Sep 2015: September Southerlies
- 23 Apr 2015: April Wind