Automated Data Plotter
This application dynamically generates many types of graphs derived from various IEM data sources. Feel free to use these generated graphics in whatever way you wish.
1 Select a Chart Type
2 Configure Chart Options
Plot Description:
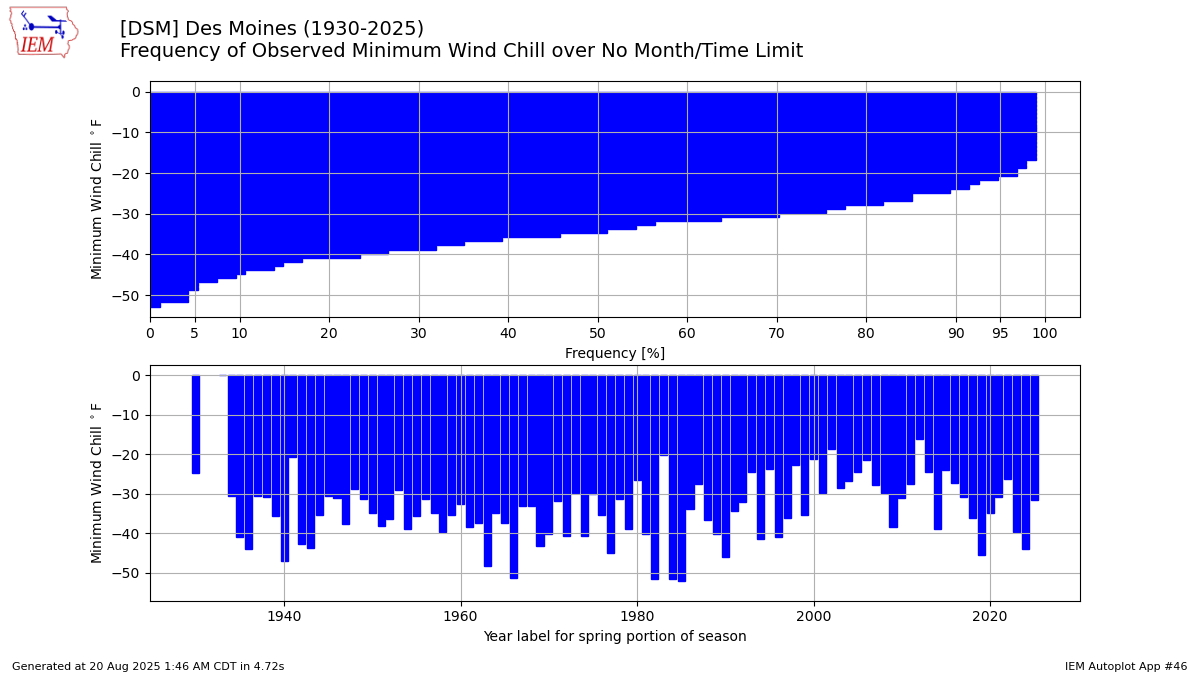
This chart presents the frequency of observed minimum wind chill or maximum heat index over the period of record for the observation site. Please note that this application requires the feels like temperature to be additive, so heat index greater than air temperature and wind chill less than air temperature.3 Generated Chart
Based on recent timings, plot generation averages 8 seconds. Please wait while your chart is being generated...
If you notice plotting issues with the image above, please
contact us
and provide the URL address currently shown by your web browser.
IEM Daily Features using this plot
The IEM Daily Features found on this website often utilize plots found on this application. Here is a listing of features referencing this plot type.
- 22 Jan 2025: Yearly Min Wind Chill
- 23 Aug 2023: Sioux City Heat Index Record
- 27 Jul 2023: 110 Heat Index
- 02 Feb 2023: January Min Wind Chill
- 22 Jul 2021: Yearly Max Heat Index
- 07 Jan 2020: December Wind Chills
- 21 Dec 2018: Above Zero Min Wind Chill
- 23 Nov 2018: November Min Wind Chill
- 24 Apr 2017: Coldest Wind Chill
- 30 Dec 2014: Minimum Wind Chill by Year