Automated Data Plotter
This application dynamically generates many types of graphs derived from various IEM data sources. Feel free to use these generated graphics in whatever way you wish.
1 Select a Chart Type
2 Configure Chart Options
Plot Description:
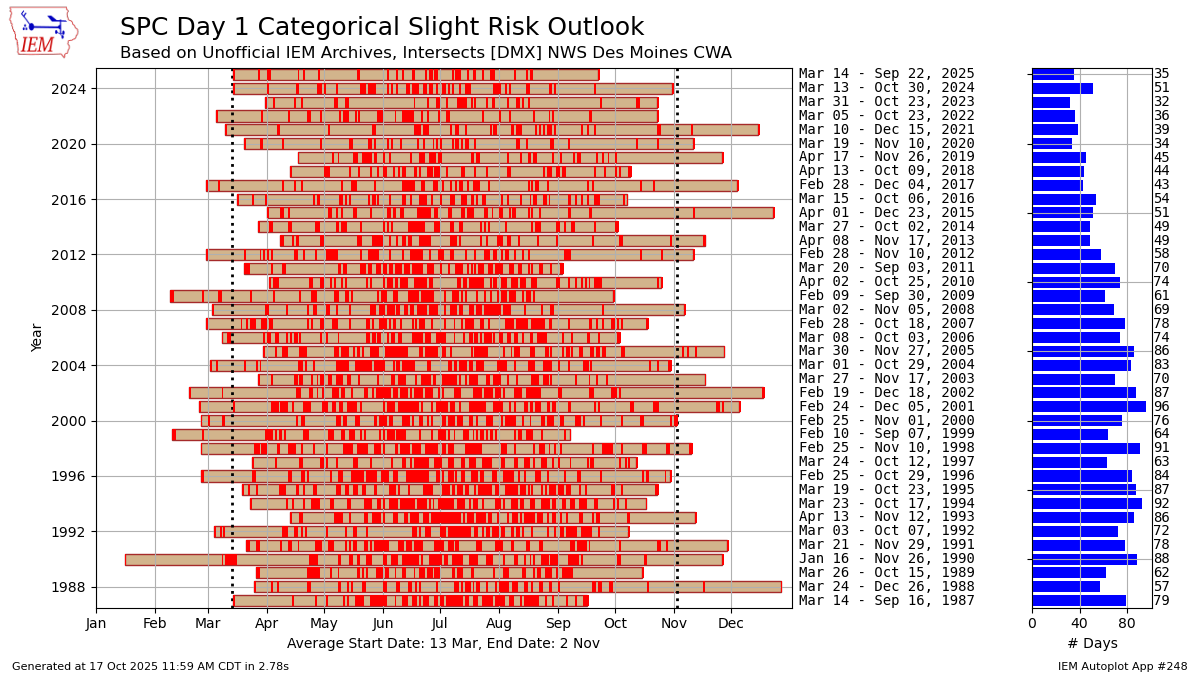
This chart displays the period each year between the first and last SPC/WPC outlook type for a given NWS forecast office, state or county. The dates presented are the commonly considered date of outlook being valid for. Technically, the outlooks end at 12 UTC of the following day.If you select the "View by Contiguous US" option, there is no spatial overlay check possible at this time.
An option exists to threshold the amount of spatial overlap between the outlook geometry and the NWS forecast office or state. This is useful for the situation of avoiding sliver touches or overlaps that aren't of perhaps significance. There is an "engulfs" option, that requires a 99% overlap. A 100% overlap is difficult for certain situations and this may generally be difficult for offices that have marine zones.
Autoplot 200 is similar, but generates spatial heatmaps.
3 Generated Chart
Based on recent timings, plot generation averages 4 seconds. Please wait while your chart is being generated...
IEM Daily Features using this plot
The IEM Daily Features found on this website often utilize plots found on this application. Here is a listing of features referencing this plot type.
- 16 Apr 2024: Hatched Tornado Risk
- 08 Feb 2024: Marginal Risk