Automated Data Plotter
This application dynamically generates many types of graphs derived from various IEM data sources. Feel free to use these generated graphics in whatever way you wish.
1 Select a Chart Type
2 Configure Chart Options
Plot Description:
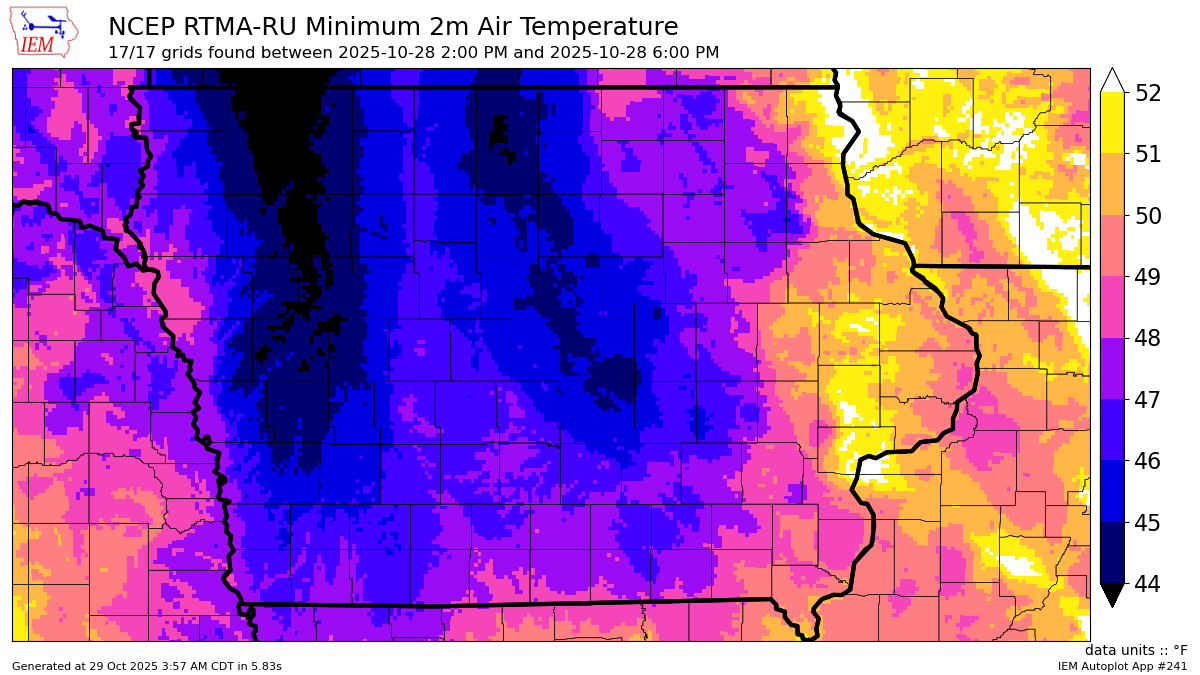
NCEP's Real-Time Mesoscale Analysis (RTMA) provides a fine scale hourly or in the case of the RTMA Rapid-Update (RTMA-RU), 15 minute interval analysis of a number of atmospheric variables. The IEM archives a few grids for various purposes and this app allows the generation of a plot with either the max or min air temperature over some period of your choice.Caution: The max/min values are based on hourly or 15 minute interval samples, so these will not fully capture the actual high nor low temperature. When the 15 minute data is available, it should certainly do a better job than the hourly.
3 Generated Chart
Based on recent timings, plot generation averages 13 seconds. Please wait while your chart is being generated...
If you notice plotting issues with the image above, please
contact us
and provide the URL address currently shown by your web browser.
IEM Daily Features using this plot
The IEM Daily Features found on this website often utilize plots found on this application. Here is a listing of features referencing this plot type.
- 08 Sep 2025: Dip Into the 30s
- 18 Jul 2025: Cool July Afternoon
- 25 Feb 2025: Thursday to Sunday
- 12 Aug 2024: Chilly August Weekend
- 23 Apr 2024: Past Weekend Minimum
- 24 Apr 2023: Chilly April Weekend