Automated Data Plotter
This application dynamically generates many types of graphs derived from various IEM data sources. Feel free to use these generated graphics in whatever way you wish.
1 Select a Chart Type
2 Configure Chart Options
Plot Description:
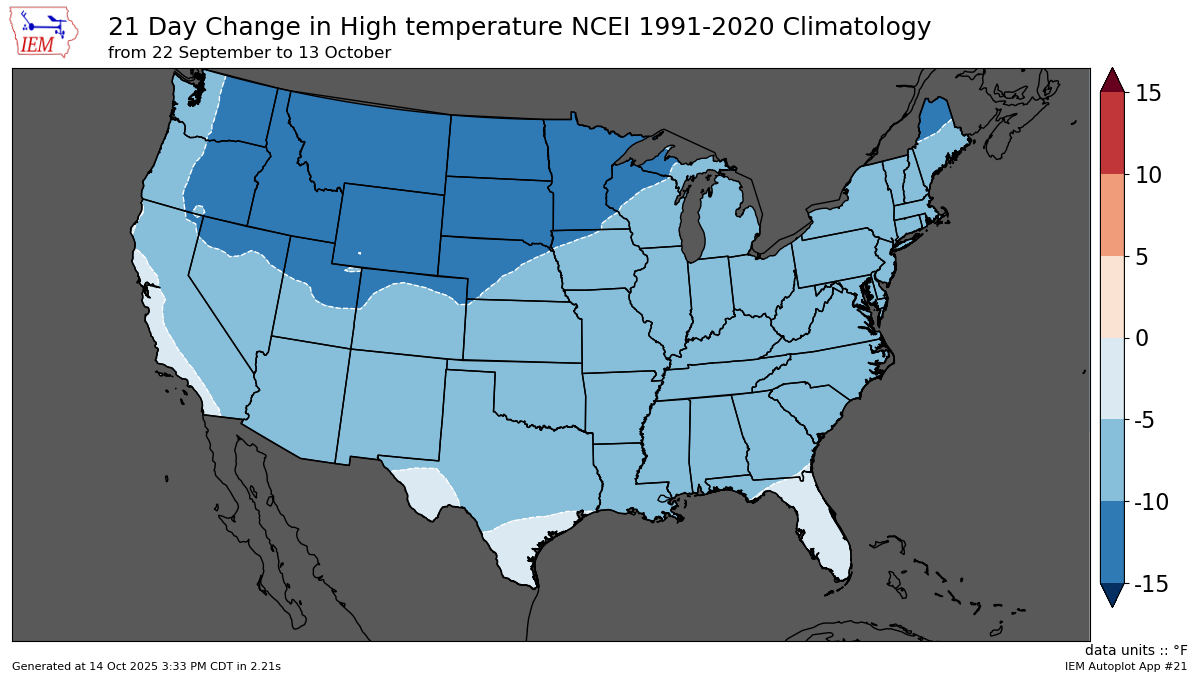
This autoplot intends to show the spatial distribution of the change in temperature or precipitation climatology over a given period of days. The climatology is based on the 1991-2020 period from NCEI.3 Generated Chart
Based on recent timings, plot generation averages 4 seconds. Please wait while your chart is being generated...
If you notice plotting issues with the image above, please
contact us
and provide the URL address currently shown by your web browser.
IEM Daily Features using this plot
The IEM Daily Features found on this website often utilize plots found on this application. Here is a listing of features referencing this plot type.
- 27 Mar 2025: Climatology Pull
- 20 Mar 2024: March Precip Increase
- 01 Mar 2022: March Warmup
- 24 Jul 2020: Not Much Change
- 27 Feb 2019: We should be warming
- 20 Mar 2017: Positive Three Weeks
- 07 Oct 2015: 3 Week Change
- 23 Sep 2014: Three Week Change
- 24 Sep 2010: Fall's Tug on Climatology