Automated Data Plotter
This application dynamically generates many types of graphs derived from various IEM data sources. Feel free to use these generated graphics in whatever way you wish.
1 Select a Chart Type
2 Configure Chart Options
Plot Description:
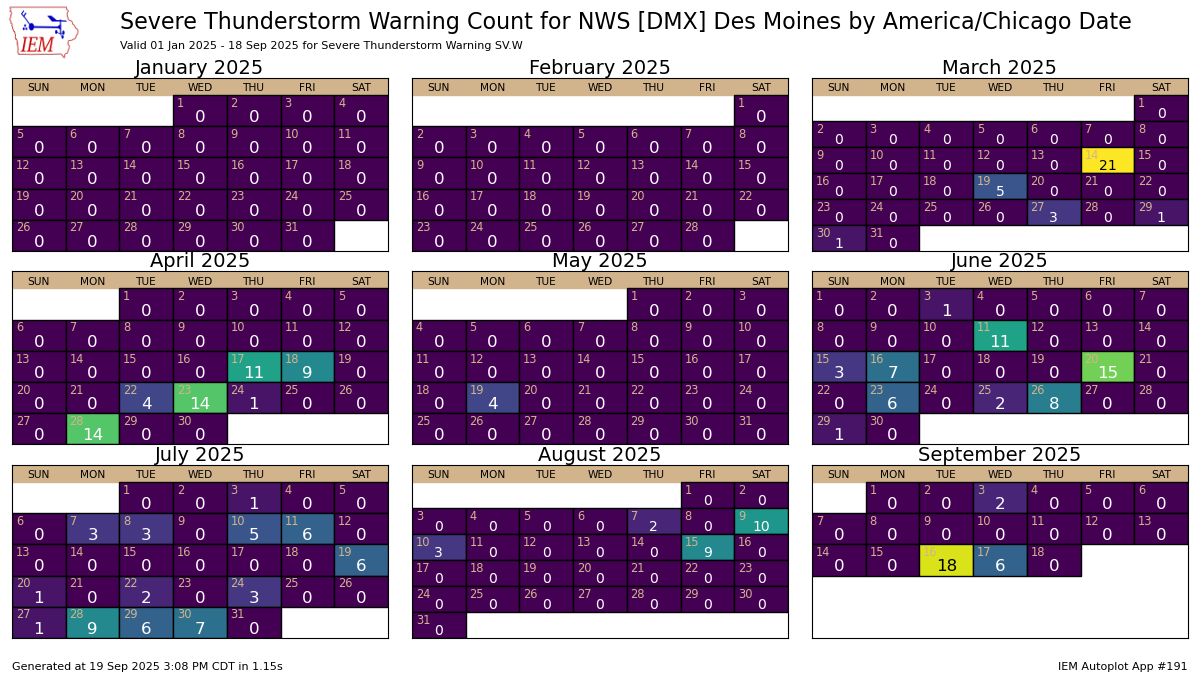
This application presents a calendar of daily counts of the number of watch, warning, advisories issued by day. This accounting is based on the initial issuance date of a given VTEC phenomena and significance by event identifier. So a single Winter Storm Watch for 40 zones, would only count as 1 event for this chart. The concept of a calendar date needs some explanation. The calendar date is either US Central Time or the time zone of the local NWS Office or a 12 UTC to 12 UTC time period. For the 12 UTC case, the date represents the start of that 24 hour period.You can also generate this plot considering "ALL" NWS Offices, when doing so the time zone used to compute the calendar dates is US Central.
3 Generated Chart
Based on recent timings, plot generation averages 2 seconds. Please wait while your chart is being generated...
If you notice plotting issues with the image above, please
contact us
and provide the URL address currently shown by your web browser.
IEM Daily Features using this plot
The IEM Daily Features found on this website often utilize plots found on this application. Here is a listing of features referencing this plot type.
- 08 May 2024: Another 100+ Tornado Warning Day
- 08 May 2023: Iowa SVR Warnings by Date
- 29 Sep 2021: Daily Warning Counts
- 25 Mar 2020: Tornado Warnings
- 13 Jun 2018: Week of Warnings
- 31 Jan 2018: Winter Headlines
- 18 Jun 2009: Severely Active
- 26 Mar 2009: Severe Weather picking up