Thanksgiving was one of the coldest on record for the state. The featured table displays
the hourly temperatures reported at the Des Moines Airport with the most recent date with
as cold a temperature at that hour. With data back to the late 1920s, the early morning
hours were the coldest on record. The around noon time temperatures were the coldest
Thanksgiving since 1950! After a quick warm-up on Saturday, temperatures have crashed
once again with bitterly cold temperatures over Iowa this Monday morning.
The most recent Arctic front passage over the weekend brought a dramatic change in
temperatures. The featured chart displays the computed largest 24 hour temperature
change based on hourly model analyses of near surface air temperature. For Iowa, the
largest drop was in the 20 to 50 degree range. Much larger changes happened over the
High Plains in the 50 to 70 degree range. This analysis also indicates values
approaching 80 degrees over Montana! Thankfully, temperatures are back on the
upswing for us with above freezing weather common for the rest of the week.
Yesterday's feature presented the largest temperature drop over 24 hours for the most
recent cold front passage. Today's featured chart presents a histogram of these changes
for Des Moines over its period of record by week of the year. The area of peak
frequencies is interesting in this plot. It exists for slightly negative numbers between June
and October. This area represents slight day to day cooling with temperatures being the
most common regime. Without solar input, our temperatures would cool each day, that is
our baseline regime. Warm air masses and the sun fight this cooling each day, attempting
to warm us up.
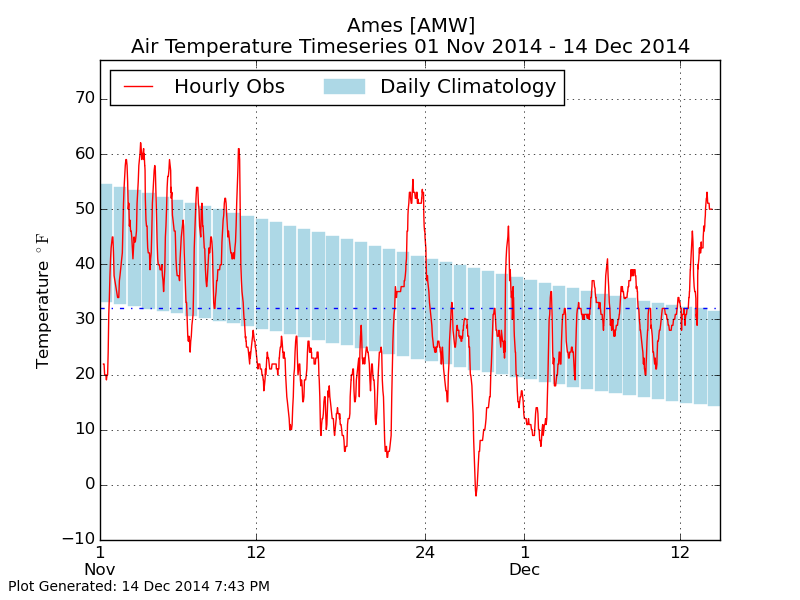
The featured chart presents a time series of hourly temperature reports from the Ames
Airport along with the daily high and low climatology. After a long period of tranquil
weather, our recent few weeks have been on one extreme or the other. The stretch of
very cold weather in November shows up nicely with temperatures mostly below average
daily low temperatures! The recent warm up on Saturday was brief, but now temperatures
have moderated nicely and look to continue that way this week.
There is a chance that this December could be warmer than November as measured by
average high and low temperature. The featured chart displays the frequency of one
month being warmer than another month for a given calendar year for Des Moines. For
combinations with less than ten occurrences, the most recent year is displayed in the grid
cell as well. The first row down in the far upper right of the plot shows the combination of
having a warmer December than November. It has only happened twice since 1893 with
the most recent year being 1959.
The featured chart displays the combination of Model Output Statistics (MOS) forecasts
and observations for Des Moines this month. MOS forecasts take raw forecast model
output and apply statistical models to it based on time series data from observation sites.
The hope is to account for biases in the model by fitting the model output to the local
observation data. These MOS forecasts come out multiple times per day with each
forecast producing data for the next few days into the future. Combining these forecasts in
time create ranges of forecasted values that are expressed by bars in this chart. The
actual observations from the site are the dots. You can now generate these charts on
demand on the IEM website!
The featured chart displays model estimates of daily solar radiation for Ames. The brown
area represents the maximum potential based on long term estimates from the NARR
model. The green area represents what was estimated for this year. Since there is an
availability lag of the NARR data, a short term weather model (HRRR) is used to
supplement this gap allowing for estimates up until yesterday. While the daylight time and
solar declination changes are easily noticeable for this time of year, the actual difference in
solar energy received is some 3-5 times less than what we get during the summer time.
This energy difference makes it much more difficult to warm the ground during the winter
time and thus warm the air. Recently, we have also had plenty of clouds, which has further
limited the amount of radiation received. For warming to occur this time of year, we need
help from the transfer of warmer air masses to our south into Iowa.
After a very cold November, there is a chance that this December ends up being warmer
than last month. An IEM feature last week showed that this situation (December warmer
than November) has happened a few times in the past. This featured image looks at the
combination of this year's data along with each previous December in the past appended
onto this year's timeseries to effectively provide possible scenarios. When combining
previous years and this year, 15% of these scenarios would lead to an average
temperature warmer than last month. The forecast has some significant warmth
forecasted going into the weekend.
The featured chart is an attempt to show automated cloud reports from the Des Moines
Airport ASOS. These cloud reports include up to four levels of cloud coverage. Once the
automated sensor reaches a cloud deck that it considers to be overcast, no further
reports are possible above that layer. The past week has seen plenty of clouds with
ceilings below five thousand feet. You can now generate this plot on the website for other
sites the IEM collects data for and for previous months in the archive.
The forecast continues to hold out hope for 50s this weekend. How exceptional is this
warm of a high temperature in December? The featured chart is called a quantile quantile
plot, which compares identical quantiles for two populations. In this case, the daily highs
for July and December are compared for Ames. Each dot represents the same quantile for
each populations and the red line is a least squares fit for dots. The correlation coefficient
is nearly one, which indicates that the two populations have a very similarly shaped
distribution. So for comparison, having a high temperature of 55 in December is like
having a high temperature of 98 in July.
Temperatures were incredibly warm this past weekend with even the daily low temperature
well above the average high for the date. The featured chart displays an hourly
temperature time series for Ames since 1 November. The bars represent the range
between the average daily low and high temperature. Perhaps this period of warmth is
payback for the stretch of very cold weather in November. Our warm weather is about to
end with temperatures on Tuesday back below freezing.
Just over a week left until Christmas and our current landscape is mostly brown. Is there
still hope for a White Christmas? The featured chart looks at two metrics of when White
Christmas arrives (blue bars) and the frequency of snow on the ground at a certain date
surviving until at least Christmas Day (red bars). For this date, about 75% of the time that
there is snow on the ground for this date it survives until Christmas. Also when there is
snowcover for Christmas, about 40% of the time that snow was already on the ground for
today. So there is time yet and some hope!
The stretch of warm weather this past weekend was rather remarkable for December. For
the Des Moines Airport, the temperature stayed at or above 50 degrees for just over 2
straight days. The featured chart displays the longest consecutive stretches of time in
December that the temperature was at or above 50 degrees. According to this analysis
based on IEM archives, this was the longest such streak for Des Moines in December.
What makes it even more remarkable is that this followed the longest streak below 32
degrees in November, which was just last month! You can generate plots like this for
other sites in the country and for a threshold and month of your choice.
A bit of snow is falling this morning over southern Iowa, but snow continues to be difficult to
come by this December The featured map displays the snowfall departures since 1 July
for primary NWS sites in the region. Snowfall departures are rather meager between 1
and 5 inches, but our season is just getting started. There are some chances of snowfall
in the forecast, with the highest chances coming the end of this weekend.
With 2014 rapidly coming to a close, it is a good time to start recapping the year that was.
The featured chart displays the year to date accumulated number of Severe Thunderstorm
and Tornado warnings issued by the NWS for the United States. This year's
accumulation looks remarkably like last years with both years on the lowest end of the
past 12 years. There is a caveat to this chart as warning methodologies have changed
over this time period. There are chances of more severe weather this year, but not for
Iowa.
If your impression is that it has been exceptionally cloudy this month, you are very
perceptive! The featured chart displays the monthly frequency of having overcast clouds
reported by the Des Moines Airport weather station at noon. The red bars represent the
long term average while the blue bars are the frequencies for this year. This analysis
shows 76% of the days this month being overcast at noon while the average is 42%. For
this metric, December is the most cloudy month of the year, but it should not be this
cloudy!
The featured chart displays the season to date accumulated snowfall for Des Moines.
The years with the largest and smallest accumulation are shown along with this year and
the average. This season got off to a fast start with accumulated snowfall in November,
but has been a flat line (no accumulation) since. Some snowfall is expected today, but
amounts will be meager and warm weather following today will quickly melt it.
It has been nearly a month since our last accumulating snowfall producing storm. This
snow arrived just in time for Christmas, but will struggle to stick around until tomorrow.
The largest totals approached four inches over northcentral Iowa with not all parts of the
state picking up snow. There was also a fair amount of rainfall with this storm system.
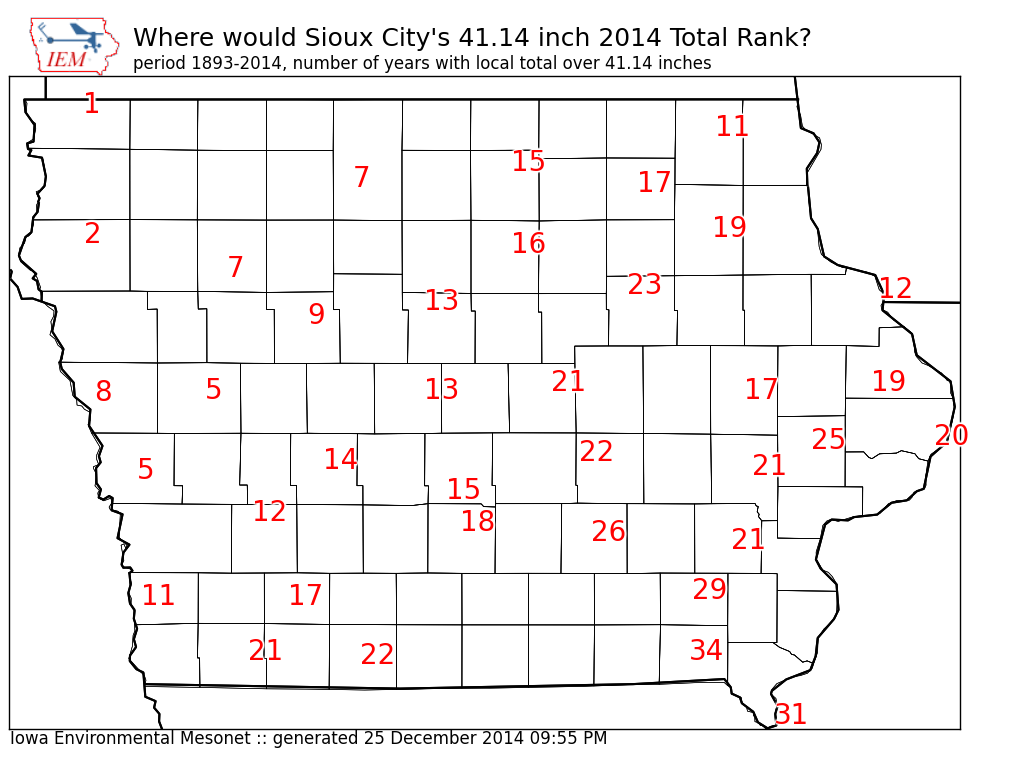
The most recent storm system pushed Sioux City's precipitation total to 41.14 inches, which
is a record for one year at the site. The featured map compares how this total would rank
at other sites in the state. The number plotted is the number of years with a higher
precipitation total than 41.14 inches for the site. Sioux City is in the driest corner of the
state, so it makes sense that it's record would not even rank in the top ten wettest years for
other parts of Iowa.
After about a month long drought of snowfall in the state, we have gotten two snow
producing storms within the same week. The accumulating snow fell in about the same
areas that got the last round of snow. Snow totals were generally less than three inches.
A few weeks back, the featured chart was highlighted with the possibility that this December
would be warmer than our recent November. At the time, the odds based on previous
year's scenarios was just 15%. Fast forward to today and our odds have increased to
75%. Ironically, our weather is about to get much colder starting today and it will be close
to see if we can still beat November. Having such a scenario is not unprecedented, but is
rare as it has only happened a few times in recorded history.
Below zero wind chill readings are common over Iowa this morning. The featured chart
presents the frequency of season minimum wind chill reading (top chart) and the yearly
minimum (bottom chart). Every year that we have data for has seen a sub zero wind chill
with at least a sub -10 degrees Fahrenheit common each year.
While snowfall totals for Des Moines were rather paltry this December, the total
precipitation was close to long term average for the month. The featured chart compares
the total snowfall vs precipitation for the month of December for Des Moines. The
precipitation total includes melted snowfall. Most of the snowfall this month has been
confined to northern Iowa. The forecast to start the new year only has a chance of snow
for this coming weekend.