The meteorological winter season started on Saturday and our initial
weather has felt nothing like winter with mild temperatures and fog.
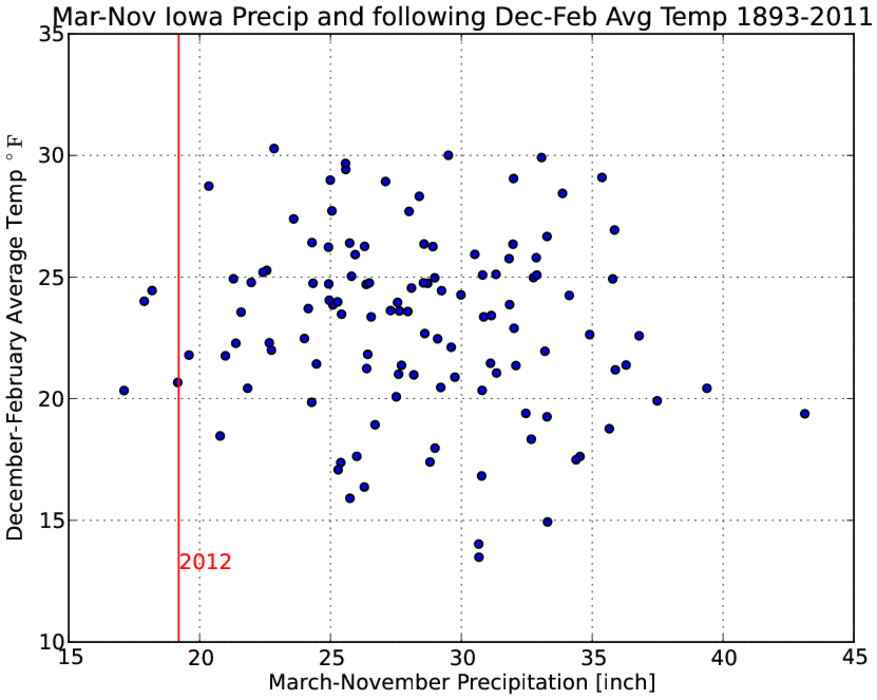
What will the rest of the winter be like? Do the dry conditions this
year provide any foreshadowing of the winter to come? The featured
chart presents the combination of March - November total precipitation
and then the following winter season average temperature for Iowa.
There is little correlation shown by this analysis. The four other
driest years have had near average winters for temperature.
Monday was yet another record warm day in Iowa and either tied or set
the record warmest temperature for the month of December. The featured
chart presents the hourly temperatures for Des Moines yesterday along
with the date of the previously as warm temperature for that hour. The
11 AM and noon temperatures were the warmest on record for December.
The overall high temperature was 69 degrees and tied the record for Des
Moines. The reality of winter slowly works back into the forecast with
highs next week expected to be much cooler.
While some brief and very cold weather this fall cast some doubt on if
2012 would finish the warmest year on record for Des Moines, our recent
stretch of very warm December weather has closed the deal. The
featured
chart presents our current year to date average temperature along with
the
current record of 1931. Each of the spaghetti lines represent a
previous
year's data projected onto the end of this year. All of the previous
years now yield a 2012 ahead of 1931, so it is a lead pipe lock to win!
Of course, we could loose if we tied record cold high and low
temperatures each day (green line) until the end of the year! The
bottom
chart represents the scenario probability to date showing that we
finally
hit 100%!
After setting a record high temperature on Monday of 69 degrees, the
high
on Wednesday for Des Moines was only 46 degrees (still above average
though) making for a 23 degree change over the two days. Is this
typical?
The featured chart presents the monthly distribution of two day high
temperature change after a day of setting or tieing the record high.
While actual data goes back to the late 1800s, the period up until
1930
was used as a "warm up" for this chart. The box plots used on the
chart
show the median (red line), 25th and 75th percentiles (box bounds) and
the
whiskers represent the 2nd and 98th percentiles. For December, the
current change of 23 degrees is only slightly lower than the long term
median, so it is about what we would expect. Postive values on this
chart
would indicate the day two temperature was warmer than the record
setting
temperature. This situation appears to be the most common in July as
record warmth tends to provide conditions for more record warmth. In
the
winter season, record warmth is from a displaced air mass that is
often
replaced by a colder air mass with the passage of a storm system.
Des Moines is now tied for record number of days between measureable snowfall at 277. The featured chart presents the period each year between the last spring snowfall and the first snowfall of the winter (not including trace reports). We are also approaching the latest in the year to have the first snowfall of 15 Dec 1999. Weather models had provided some hope for snowfall this weekend, but now it looks less definitive. We could certainly use moisture in any form at this point as the saying "beggers can not be choosers" applies.
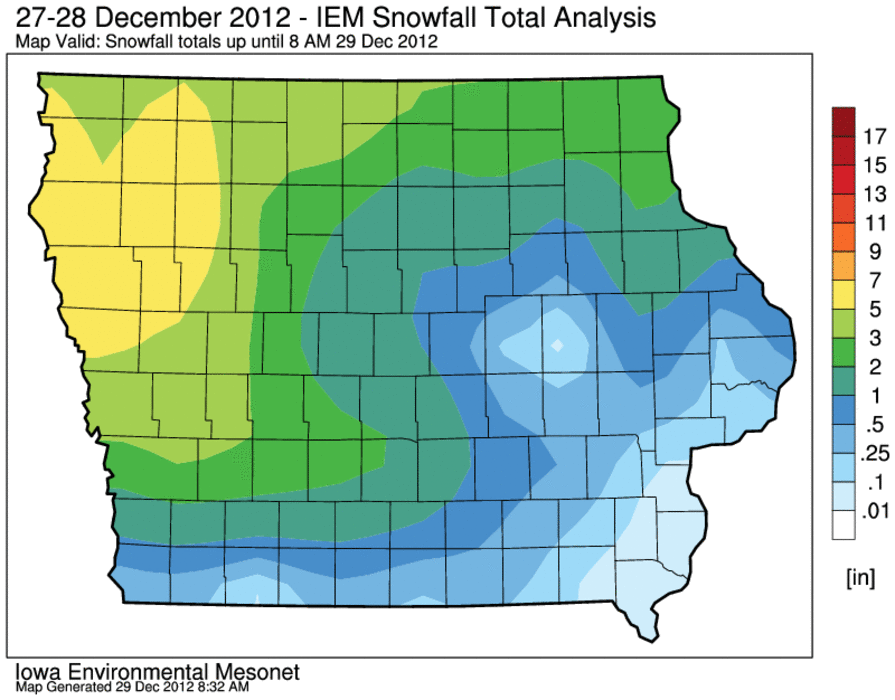
Winter has finally arrived for the Midwestern US. The first
significant snowfall of the season for Iowa in the books with the
heaviest totals to our north in Minnesota. For Iowa, the heaviest
totals appeared to be in extreme Northeastern Iowa with 3-4 inches
reported. The other major story is the arrival of very cold air as
highs today will struggle and be the coldest of the season so far.
The water level of Saylorville Lake (a reserviour northwest of Des
Moines)
has been of interest lately as it is at record low levels. Curiously,
the
water level rose slightly Sunday evening as shown by the top featured
chart. The sensor gauge is located at the southern end of the lake
with
the lake extending back to its north and west. Persistent and strong
winds over this fetch of water will push water in the direction of the
wind. So a NW wind will drive water to the gauge (raising the reported
level) and a SE wind will do the oposite as shown by the bottom chart
from
March. Perhaps the term "seiche" could apply in the bottom chart as an
oscillation is shown, but it is not conclusive without further study.
Having snow makes a big difference in our temperatures. The featured
chart presents the frequency of having below average high or low
temperature for the days following a snowfall for Des Moines. The
effect is rather clear with increased chances of below average
temperature for the immediate days following the snowfall event and
return chances around 50% by day 5. Our current weather has somewhat
resembled this chart since our inch snow this past weekend. Our next
chance of snow arrives this weekend.
Wednesday was yet another very warm day this year with the high
temperature for Des Moines reaching the 50s. The year 2012 continues to
rewrite the temperature records as shown by the featured chart. The
chart presents the record number of days per year at a given
temperature threshold. This year owns almost all of the records and
still has 18 days left to break some more records in the 40s. The
forecast has a few more days of very warm weather and highs next week
back into the 30s.
While 2012 will go down as the warmest year on record for Iowa and
places like Des Moines, not every observation point in the state will
finish number one. The featured map presents an IEM computed ranking
for long term climate sites in the state of this year's average
temperature. How can such a difference exist between sites in the
state? Long term climate observations are often not made at the same
location over the past 100 years. They move between slightly different
micro-climates and the landscape around the site changes as well.
There also can be small differences in observation equipment or the
observation method. All of these issues and more conspire to create
these small scale differences.
With Christmas a mere eight days away and a brown landscape over most
of
Iowa, one may wonder if there is still a chance we could have a White
Christmas. The featured chart presents the frequency of when the
snowfall
arrived in time to make for a White Christmas. The chart would
indicate
that there is still plenty of time as well over 50% of the White
Christmas
events were established after today's date. The forecast does have
some
hope for snow later this week with cold temperatures afterwards!
The first major snowfall of the season for Iowa is set to arrive on
Wednesday. High temperatures on Tuesday (today) will be very pleasant
in
the 40s. The featured chart presents the combination of day prior to
snowfall high temperature and then the total snowfall over the next two
days. There are caveats galore with this type of comparison as there
are
timing issues with how the snowfall is reported in relation to the high
temperature. Putting that aside, the side charts show the histogram of
temperature and snowfall distribution. The preferred temperature is
near
or just above freezing, which makes sense as it represents a good
combination of just cold enough temperatures which can hold more
moisture
than colder temperatures. The chart also indicates that the larger
snowfall totals are associated with temperatures closer to freezing as
well.
A significant winter storm is likely to impact central Iowa beginning
tonight and lasting through Thursday. The featured chart shows
snowfall
projections for Des Moines from various operational numerical weather
prediction models and snowfall algorithms. These predictions were from
model runs made on Tuesday. Some locations are expected to get over a
foot of snowfall! The amount of snow will not be the concern as strong
winds will blow whatever falls around causing blizzard conditions for
most of the state.
Over the winter season, the IEM produces analysis plots of snowfall
reports and then numbers the storms as we go. Storms that produce a
dusting or maybe an inch or two in Iowa are generally ignored from this
tally. The featured image is an analysis of snowfall reports for
winter storm on Tuesday that brought upwards of 5 inches of snow to a
very limited swath over extreme northern Iowa. This system also
produced some mixed precipitation over northern Iowa later in the day
on Tuesday. There were a couple of weak storms prior to this system,
but they did not produce the high total that was reported with this
one.
Meanwhile, the ongoing blizzard for Wednesday into Thursday is
piling up the snowfall totals and some locations will pick up over a
foot of snowfall.
Iowa and other states in the midwest are digging out from a major snow
storm that brought blizzard conditions. The featured map is an
analysis of snowfall reports from this storm system showing a swath of
8-12 inches from Des Moines up to Madison. Most of the snow fell at a
temperature right around freezing, which makes for higher water content
than snow at colder temperatures. While this makes for misery to clean
as it is very heavy, it does help prevent significant blowing and
drifting. Sunshine today and this weekend will certainly help clear
roads as air temperatures will remain below freezing.
The featured chart is a time series of local noon measured short wave
radiation this year at one of the flux sites operated by the National
Laboratory for Agriculture and the Environment. "Short wave" is a term
used to describe the wavelengths at which most of the sun's radiated
energy is found at. The top chart shows the energy arriving from the
sun (downwelling) and the amount reflected by the surface (upwelling).
The ratio between these two values is called "albedo" and is presented
in the bottom chart. The last two days saw a dramatic change in albedo
with the arrival of snow. This is one of the main reasons why our
weather gets cold when it snows as the snowcover is a very efficient
reflector of the sun's energy. The chart also shows some nice growing
season effects as the corn canopy expands and harvest occurs in the
fall.
The most recent winter storm produced thundersnow, which is the
combination of lightning and thunder with falling snow. This phenomena
is a sign of intense lift within a storm producing snowfall and a
general forecasting rule of thumb is to forecast 10+ inches of snow
once you experience thundersnow. The featured graphic displays recent
reports of thundersnow from airport weather stations along with the
event snowfall for that period. Putting aside the reliability issues of
how thundersnow is actually reported by the sensors, the snowfall
totals do not always reach 10 inches. Also, most folks in Des Moines
witnessed thundersnow, but it was not reported by the routine and
special observations made at the airport.
While Christmas will be white and very cold for Iowa, it is already
severe for the deep south and a severe thunderstorm watch is in effect
this morning. The featured chart presents the number of tornado and
severe thunderstorm warnings per year since 1986 for Christmas. Having
severe weather on Christmas is certainly not common with only three
years having at least one warning since 1986.
The featured chart presents a time series of observed visibility and
wind gust from the Des Moines Airport for five recent blizzard events.
These events are when Polk County was under a Blizzard Warning. The
definition of a blizzard is somewhat vague in that visibility should be
frequently reduced to a quarter mile or less and wind gusts be
frequently in excess of 35 mph for at least a three hour period. The
highlighted sections in the chart denote the periods at quarter mile
visibility and 35+ mph winds. For last week's blizzard (top chart),
the visibility was only briefly at a quarter mile. Automated weather
sensors do not do a good job reporting these low visibilities during
snow and blowing snow conditions, so blizzards tend to be verified by
people like police and snow plow drivers who are out in the storm and
can attest to the frequent poor visibilities and strong winds over a
three hour period.
The recent stretch of cold weather failed to yield a sub zero
Fahrenheit temperature for Des Moines. Last winter was the first on
record whereby Des Moines failed to reach a sub zero temperature. The
featured chart presents the lowest temperature for the winter season
for each year since 1880. The only two years above zero are the most
recent two! There is plenty of winter yet to go this year and the
coldest part of the winter season is still ahead of us. The immediate
forecast has slightly warmer temperatures and snow arriving this
afternoon.
The snow that fell from our most recent winter storm was in the "snow-
globe" variety, instead of the blizzard variety of last week! The
heaviest totals were over Northwestern Iowa at around five inches.
Temperatures were the warmest we have seen since the blizzard in the
mid to upper 20s and made for some slippery conditions as roads melted
some and froze again. Our next bout with snow does not appear to be in
the immediate future.
While last week's snow storm did not bring excessive totals of snow,
light snow and flurries persisted for a long time. The Des Moines ASOS
reported snow for 39 consecutive hours! The featured chart presents
the maximum number of consecutive hours per year that the Des Moines
observation site reported snow. The longest streak of 61 hours was
reported last year on 1-2 February 2011. There are number of caveats
with this metric due to observation and reporting differences that have
changed over the years. No snow is in the forecast, but bitter cold to
start the new year.