The featured map displays the frequency of a long term climate site being above the
statewide average daily high temperature. Rewording, how often is the location in the
warmest half of the high temperatures reported for the date (assuming that the statewide
average is close to the median). The north to south gradient should not be a surprise to
Iowans, but there are some subtle features such as the difference over the southern tier of
counties. Decorah is analyzed with the lowest frequency, so if you don't mind seeing
warmer temperatures over much of the state than your location, you should consider living
there.
The coldest air of the season arrived this past weekend with low temperatures in the 20s
for most of the state. This bested the previously coldest temperature by around 10
degrees. The featured chart presents the largest "step down" in low temperature each fall
season. The "step down" being the amount a new daily low temperature was colder than
the previous fall minimum for that year. Rewording, if our current fall minimum temperature
is 20 degrees, we probably would not expect to see a sub zero temperature until we had
another day down to 10 degrees first.
The USDA released updated crop progress estimates on Monday and Iowa farmers have
caught up a bit with the corn crop harvest. The featured chart displays the yearly corn
harvest progress for Iowa with the weekly reports interpolated to a daily time step based
on a simple linear model. This year's current progress percentage (61%) is denoted on
each of the previous years' values. This year's progress delays are not too extreme
when you compare with very poor years of 2009 and 2002.
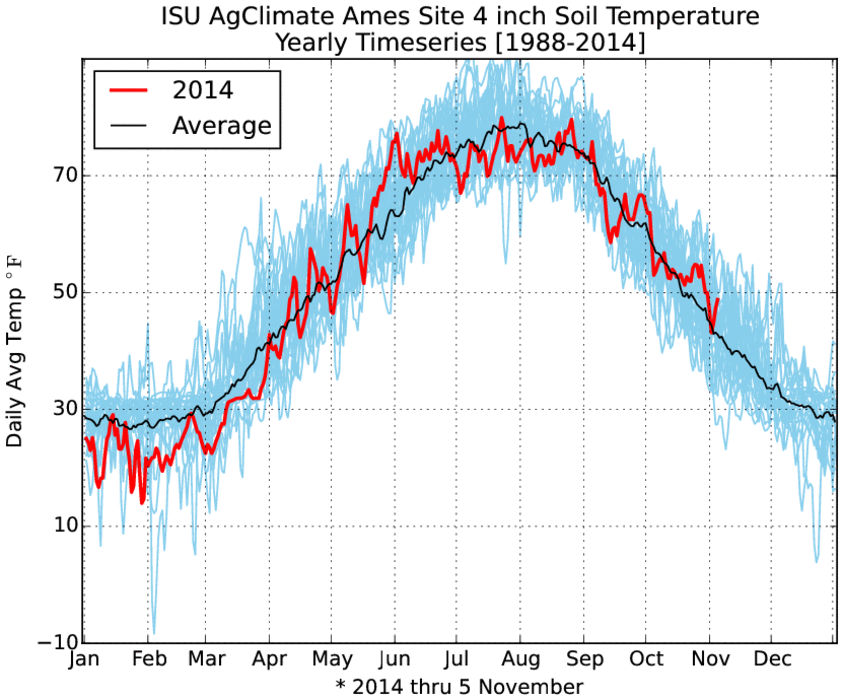
The featured chart presents yearly timeseries of four inch depth soil temperatures from the
ISU AgClimate (now ISU Soil Moisture) station at the AEA Ames AgFarm. The black line
represents the simple average of all the yearly lines. As with air temperatures, soil
temperatures have been on the warm side of average recently. Slightly cooler weather is in
the forecast this week before a well advertised shot of arctic air arrives next week.
There is considerable buzz regarding the anticipated cold air outbreak next week for the
eastern half of the CONUS. Forecasted highs are below freezing for much of the state for
a few days next week! The featured chart presents the last spring and first fall occurrence
of a day with a sub freezing high temperature for Ames. Having this type of weather for the
second week of November is not far from long term average.
The highly anticipated week of cold weather is set to arrive with significant snowfalls
forecasted to our north over Minnesota and Wisconsin. It would appear that the
temperature may be below freezing for a few straight days this week for parts of the state.
The featured chart presents the longest streak of days with the high temperature below 32
degrees for Ames. For early November, a few days is about the most that can be
expected and is nothing out of the ordinary. The maximum streaks get longer as we get
deeper into winter.
The first major winter storm of the season is pulling east this morning and leaving a
dusting of snow over much of Iowa in its wake. The heaviest totals for Iowa of just an inch
or two fell over the Minnesota/Iowa border. The IEM generates a map like this for each
measurable or significant snow storm for the season. This analysis is based on NWS
COOP reports, NWS Storm Reports, and CoCoRaHS observations.
The most recent winter storm system that brought a dusting to an inch or two of snow to
Iowa has been replaced by a very cold air mass. The front associated with this storm
system was strong with a large contrast in temperature. The featured map displays the
24 hour temperature change at 1 PM Tuesday. While Iowa is in the 20-30 degree range,
much larger values exist to our southwest. The panhandle area of Oklahoma is analyzed
with a change over 50 degrees!
Nothing like getting a bitter reminder of the upcoming winter season with temperatures on
Tuesday struggling in the 20s and a brisk NW wind. The featured chart presents the
hourly Des Moines Airport temperatures and the most recent date with as cold a
temperature for a November 1-15 date. The hours in red are simply dates further back
than last year. This stretch of cold weather we currently are in looks to be the coldest
since early November 1991.
The featured chart displays the fall to date minimum temperature climatology for Ames
along with the 2014 values. After the initial very cold drop in September, it was not until
very late into the season that the first sub freezing temperatures were observed. Our
current weather has seen very cold high temperatures, but the over night lows are at
levels we should have seen by this time of year. The forecast has more cold weather and
measurable snowfall for the weekend!
The entire state got a reminder of the upcoming winter season with accumulating snow
reported. The featured analysis of snowfall reports shows the highest totals around five
inches near the Minnesota border with 1-3 inches common over the rest of the state.
Winds will pick up later this evening and causing blow snow issues over northern Iowa.
For mid-November, our current stretch of weather has been extremely cold! The featured
chart looks at the frequency of having at least one sub-zero wind chill reading per day.
For this time of year, the frequencies are about 1 in 10 to 15 years. The peak frequencies
in this plot are during January.
Our current stretch of cold weather is remarkable for mid November. The featured chart
looks at the current streak of sub freezing temperatures. This chart has changed
significantly overnight as some chinook winds from the west have raised temperatures
above freezing for many points to Iowa's west. Temperatures in Iowa remain a few
degrees below freezing at the time of this image posting. We have a few more days of cold
weather left before more mild air returns and a threat of rain.
The streak of weather below freezing continues for Des Moines this morning. The current
streak is now longer than any previously recorded in November as shown by the featured
chart of November streaks greater than six days. A strong chinook event yesterday
morning put some doubt into setting this record as the temperature reached 30 degrees
with a 50 mile per hour gust in the early morning hours. Temperatures will be on the rise
Friday evening and will be above freezing on Saturday, so we have two more days to go!
Our current remarkable stretch of frozen weather has cooled Iowa soils to freezing very
quickly! The featured chart presents the four inch depth soil temperature climatology
based on 25 years of ISU Ag Climate station data for Ames. The red line represents the
daily values for this year. You can see the quick drop in temperatures this November as
we went from warmer than average to colder than average in just a few days. The
implication is that there was limited time range for fall nitrogen application and little chance
for planted cover crops to get established this year due to the late harvest.
Mild air has thankfully returned to much of the country allowing for temperatures to rise
above freezing. This ends a remarkable period of November weather with consecutive
days below freezing. The featured map displays an analysis of the HRRR weather
model's initialization of 2 meter AGL temperature. This model is run every hour, so the
map displays the maximum period of hourly analysis below freezing for each grid point in
the model over the CONUS. The map nicely shows the extent of freezing weather into the
southeastern US.
Our brief respite from winter this past weekend with rain and mild temperatures has come
to an end with accumulating snowfall over extreme eastern Iowa on Monday. Snowfall
totals were light with only isolated locations over two inches. Combined with winds, this
snow did create travel difficulties over northeastern Iowa. More snow is in the forecast for
Tuesday evening into Wednesday.
The most significant snowfall of the season arrived just in time to complicate the
Thanksgiving travel plans of some Iowans. The featured map displays an analysis of
snowfall reports. The snowfall pattern is interesting with a stripe of 3-8 inches along and
just west of I-35 in northern Iowa. Temperatures were close to freezing during the snow,
which helped keep roads in fair shape. Conditions deteriorated overnight as bitterly cold
air settled in and water on the roadways froze up.