The featured image has been shown since the mid summer highlighting Des
Moines probability of 2012 being the warmest year on record. The red
line is 2012 and the blue line is the warmest year on record (1931).
If we consider all previous years as scenarios to finish out this year,
then roughly 89% of the previous years would put 2012 in the warmest
spot to end the year. The chart would indicate that we should still
have the lead going into December, but our margin may be much closer
than it is now. The forecast to start November keeps us around
average.
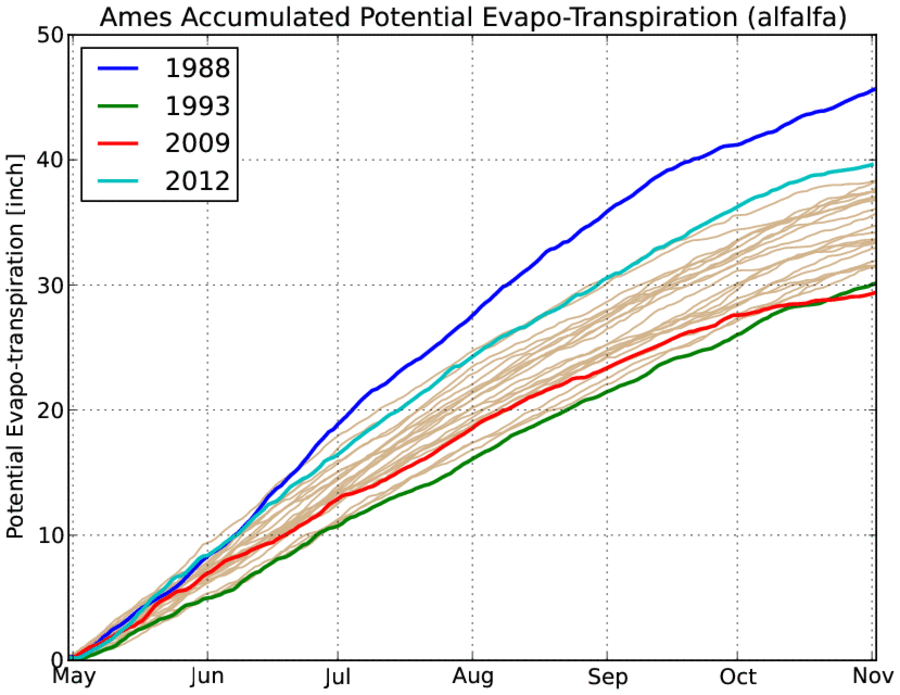
Having water available in the soil for plant use is obviously important
during the growing season. Different plants require different amounts
of water to thrive. Potential evapo-transpiration (PET) is an estimate
of the amount of water that a plant could transpire given always
available soil water and observed air temperature, humidity, and solar
radiation conditions. This is sometimes expressed in a unit like how
we measure precipitation (depth of liquid water) and represents an
upper bound on the amount of water a plant could utilize. The featured
chart presents the daily accumulation of PET for this year and past
years since 1987 for the Ames ISUAG station. The two recent big
drought years of 2012 and 1988 appear with the larger values. This may
seem counter-intuitive that drought years have the highest potential
water use. Drought conditions often include less humid conditions and
hot temperatures, both of which promote water usage by plants when soil
water is available. The availability of soil water is the key to how
much PET is actually materialized into evaporation and transpiration.
Unfortunately ET is difficult and expensive to measure, so we are stuck
with PET estimates to provide insight into water usage by plants.
The featured map is a simple analysis of lowest observed temperature so
far this fall season from the airport weather sensors. This map would
indicate that the entire state has seen below freezing temperatures
this fall. While some locations have barely breached 32 degrees, other
parts of the state have been well into the teens. Low temperatures are
strongly influenced by local affects and terrain, so observation
stations relatively close to each other can often report much different
temperatures. The analysis technique does not consider terrain, so the
map can have unrealistic blotches.
Being a swing state, Iowa gets an inordinate amount of attention this
time of year for the presidential election. While the Washington
Redskins seem to have skill predicting the result of the election, is
there some aspect of Iowa's weather that predicts the election here?
The featured chart presents the presidential election day averaged
temperature and precipitation in Iowa since 1900. The color of the
bars indicate the party voting record for Iowa and the U.S at large.
There does not appear to be a predictor based on this chart and a
number of other charts generated that are not shown here. 2008 saw the
warmest day and 1932 the wettest. This year will have around average
temperatures and a bit of rain over the northern part of Iowa.
The featured chart displays the maximum daily river flow as measured by
the gauge on Squaw Creek in Ames at Lincoln Way for each year since
1991. The chart has a logarithmic y-axis to help show the low flows.
The flow this year has been on the dry side and non-existent (not
measured by the sensor) for many times since July. The flood years of
1993 and 2010 are highlighted for comparison. We continue to
desperately need rain and rain while the ground is still not frozen.
This rain would help replenish ground water and provide a reserve for
crops to use for next year.
The past few days have seen mostly cloudy conditions here in Iowa.
The noticeable visual effect for us is a lack of sunshine during the
day and not seeing stars at night! Besides visual effects, clouds are
an important component of the surface energy budget (which drives
weather variables like near surface temperature). During the
daylight, clouds reflect energy from the sun back out into space and
act like a mirror. For all 24 hours of the day, clouds are absorbing
and re-emitting energy from the ground back down to us, acting like a
blanket. The featured image illustrates the effect of significant
cloud cover by comparing hours with clouds against all available hours
of observations from the Des Moines Airport sensor. The plot shows
the primary effect of keeping temperatures cooler during the daytime
and keeping temperatures comparatively warmer during the nighttime.
The strongest effects are when solar heating of the ground is most
efficient in the late summer / early fall season (drier/warmer soils,
plenty of potential sunshine for surface heating) and during the early
morning hours in spring and fall (peak radiational cooling due to
lower humidities). Restating, these times are when clouds have the
most influence. So while clouds have been helping to keep us recently
cool during the daytime, they have kept overnight temperatures higher
than they would be with clear skies at night.
The US Drought Monitor is released weekly and provides an analysis of
drought conditions. The featured image displays the week to week
change
of the drought monitor product over Iowa since January 2000. Drought
is
classified from a D0 to D4 category. The length of the arrow
represents
the areal change in combined drought categories. For example, if the
entire state went from a D0 to D1 category then the arrow would be one
unit long and in red. In this case, the unit length is shown on the y
axis as one year. The bottom row of arrows are those for 2012 and
clearly
show the degrading drought situation that occured during July. The
last
three weeks of October 2012 have seen some improvement, but there is
still
a ways to go.
Very warm air is surging into Iowa this Saturday with numerous record
high temperatures being set. Des Moines set its record high today by
reporting 78 degrees at 12:35 PM. Is it unusual for a record high to
be set just after noon? The featured chart provides an estimate of the
time of day record high and record low temperatures occurred at. The
daily records are from a different dataset than the hourly temperature
archive, so some estimates were done and a constraint that the extreme
hourly temperature was within 4 degrees of the record temperature.
Having a record high near 1 PM has happened previously, but that won't
put a damper on today.
The lone blue dot (record low) shown at 5 PM on 25 Sep 1942 appears
to be legitimate estimate.
The record high temperatures on Saturday have given way to much colder
temperatures and even some snow on Sunday. The past day and a half has
seen a temperature swing of 45-50 degrees. The featured chart presents
the maximum computed 12, 24 and 36 hour temperature change based on
hourly
observations from the Des Moines weather sensor. The temperature swing
experienced this past weekend is about typical for an extreme
temperature
swing this time of year. The largest values on this chart are in the
springtime when the contrast in air masses are the strongest. The
summertime has the longest values as humidity helps to temper potential
temperature swings and artic air masses do not survive the trip south.
With the current taste of winter fresh in our mouths, it seems a long
time
ago that temperatures soared to record levels on Saturday. Not only
was
it warm, it was some of the warmest weather we have seen in November on
record. The featured chart presents the hourly temperature
observations
at the Des Moines Airport along with the most recent date with such
warm
weather for that hour in November. For a few of the hours, one has to
go
all the way back to the 1930s for warmer weather! The immediate term
forecast keeps temperatures reasonable for this time of year with
mostly
dry conditions.
On Monday, Cedar Rapids had its first day of the season with a high
temperature below freezing (a frozen day). This was the earliest such
day
since 1996 as shown by the featured chart. Does an early first frozen
day
provide any insights into the winter season ahead? Based on average
temperature for the winter season (Dec - Jan - Feb), the bottom chart
would indicate that the answer is no. The next 7-10 days have daily
highs
in the 50s, so our next frozen day will have to wait for a bit.
Des Moines has yet to report snowfall this year, which extends the
streak of days since the last reported snow during the first week of
March. The featured chart shows period between the last snowfall
reported in the spring and the first snowfall of the fall. Only two
other years have seen a longer stretch without snow (2001 and 2004).
The black line shows the average last and first date. Our first
snowfall for Des Moines should happen before the end of the November,
but the forecast keeps temperatures above freezing until at least
Thanksgiving.
The featured chart displays the precipitation departures over three
trailing time windows. The 30 days departures have recently turned
positive for the first time since May, but dry conditions for the past
few days have reverted us back toward zero. Deficits are much larger
on longer time scales and we are eight inches short of average for the
past 365 days. It will be difficult to make up the longer term deficit
during the cold months of the year as the total precipitation is much
less than the warm months. It will take heavy rainfalls in March and
April to give us a chance to have recovered soil moisture prior to the
growing season next year.
The cold weather and reality of a coming winter season for October has
given way to rather warm weather for November. The featured chart
presents the accumulated streaks of days above or below high
temperature average for Des Moines this year. Our current streak looks
to continue until at least Thanksgiving with highs even pushing 70
degrees on Wednesday.
Those of you in eastern Iowa getting an early start to Grandma's house
for Thanksgiving are experiencing very dense fog this morning. The
featured image is an analysis of reported visibility from automated
weather sensors. This fog will go away later this morning thanks to an
increasing wind and arrival of some warmer air. Two more days of very
warm weather is left until the shock of much colder temperatures
arrives on Friday.
Some very warm weather again last week prior to Thanksgiving helped to
push 2012 into the lead for most days over a number of high temperature
thresholds for Des Moines. The featured chart displays the record
number of days per year at or above a given high temperature with bars
labelled in blue denoting the record being set this year. 2012 now
owns the record for most days for nearly all thresholds between 50 and
85 degrees. The 61 degree threshold is a lone hold out, but perhaps we
could push that level once or twice before the year ends! It is
remarkable to think that nearly half of the days this year were at or
over 70 degrees.
Our weather has taken a remarkable change after Thanksgiving last week.
The featured chart shows that for the 6 days prior to and including
Thanksgiving, Des Moines has the warmest average high temperature for
that
period this year. Cold air has since replaced the pre-Thanksgiving
warmth
and high temperatures have been struggling in the 30s. The forecast
has a
slow warm-up this week with highs back near 50 degrees by the weekend.
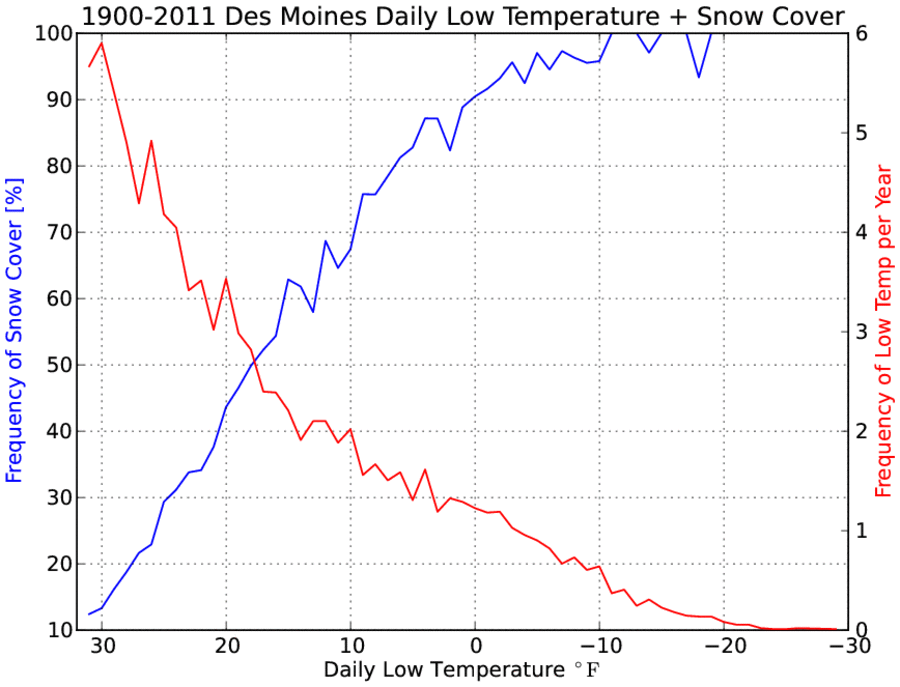
Temperatures dropped quickly Monday evening thanks to clear skies and
calm
conditions. Our saving grace was ground temperatures which are still
warm
for this time of the year and the lack of snow cover, which prevented
temperatures from dropping even further. Snow cover is a game changer
when it comes to the surface energy balance during the day and night
time.
It acts to mostly seperate the exchange of energy from the sun to the
soil
and back to the air. The featured chart presents the frequency of
having
snow cover at a given daily low temperature (blue line) and the
overall
frequency of that temperature (red line). The main point is to show
that
the coldest temperatures are increasing associated with the presence
of
snow cover. For example, a low temperature of zero degrees also had
snow cover present 90% of the time. The chart also had an interesting
(but
unexplained here) aspect of having the lines cross at the 50%
probabilities for both y-axes around 18 degrees. It is difficult for
near
surface soil temperatures to get cold enough to support very cold air
temperatures, so snow cover is increasing necessary for the coldest
temperatures.
While the recent election was uneventful, Thanksgiving marked a major
regime change with our weather as daily highs in the 60s for six days
were
replaced with highs in the 30s for Des Moines. How extreme was this 30
some degree change between two periods? The featured chart presents
the largest change in
average high temperature between two consecutive periods of days of a
given length. The month during which this extreme drop occurred is
presented as well. Almost all of the most extreme drops are in February.
The largest values are brief warm air masses that are replaced by snow
and
very cold air. Our forecast is a slow warm up with highs back to
around
60 this weekend.
Drought is a complex interaction of short and long term precipitation
deficits producing impacts on various time scales as well. If you
consider the past 365 day precipitation departure, Iowa is about 6.5
inches below average currently. How soon can this deficit be made up?
The featured image considers the scenarios provided by the previous 119
years of climate record when appended onto our current condition. The
lines trace out the 365 day departure to date. When considering this
long
term deficit, the chart clearly shows that no improvements will be made
this winter season. Short term deficits could be eliminated though.
More
disturbing is that we will likely still be below normal to start the
growing season as only six years shown provide a scenario were we even
get
to some level better than negative four inches.
After finally getting a slightly cooler than average October, November
has quickly reversed the recent
cooling trend and will finish today well above average. The featured
chart presents the monthly
temperature departures for Des Moines along with the El Nino 3.4 index
since Jan 2007. This index is
used for the commonly heard terms of "La Nina" and "El Nino".
Sometimes our weather is associated with
the phase of this index, but it is not a simple relationship. The
forecast to start December looks
remarkably warm and will give that month a head start on being above
average as well. It also looks to
push 2012 far enough ahead to finish the warmest year on record.