A Red Flag Warning was in effect yesterday for limited parts of western
Iowa. These warnings are issued when dry and windy conditions create
spreading fire concerns. The featured map presents the IEM computed
average number of days per year with at least one hour with sustained
wind speeds at or above 25 mph and relative humidity below 25%. This
combination of conditions gets more rare the further east you go in the
Midwest. Dry air masses originating over the desert southwest are
slowly modified as they are transported east by vegetation
transpiration and evaporation. Also these events are typically with
strong southwesterly winds, which means the further east you go, the
more likely air originated from the Gulf of Mexico (which will have
high humidities).
The featured chart displays the combination of recent monthly
precipitation departures for Ames along with the monthly El Nino 3.4
index value. Many scientists believe that the El Nino index, which
determines if we are in La Nina or El Nino condition, is correlated
with longer timescale temperature and precipitation in the United
States and elsewhere. The chart nicely shows the drought periods of
the past two years and the wet periods of 2008 and 2010. This October
looks to turn wet for the rest of the week with showers arriving late
this evening.
The weather is going to be very interesting over the next few days with
chances of severe weather, including perhaps tornadoes, in the
forecast. October is not a favored time of year for tornado warnings
as shown by the featured chart. The chart shows the frequency of
having at least one tornado warning issued for the given week of the
year. For comparison, values for four states are plotted. Of course
Texas is a very large state in Tornado Alley which helps its numbers.
It is kind of interesting to compare the annual cycle for Iowa vs
Oklahoma and even Alabama. Tornado Warning frequencies in Iowa drop to
zero during the winter season while Alabama has the occasional event
thanks to its proximity to the Gulf of Mexico. Please note that this
type of comparison does not account for the total number of warnings
issued but just attempts to diagnose annual climatology.
The Storm Prediction Center has a moderate risk of severe weather over
much of Iowa today including the threat of tornadoes. Having such a
threat is somewhat rare for Iowa and even more so when you consider the
calendar says October! The powerful storm system bringing this threat
is also expected to dump many inches of snow just to our northwest in
South Dakota. The air on backside of this system will be a sensible
change with highs only in the 50s for the weekend and more chances of
precipitation.
Des Moines received just over two inches of rainfall on Friday, which
was almost larger than the individual monthly totals for each of the
past three months! The featured chart presents the July, August, and
September monthly totals for Des Moines along with the single day
maximum precipitation for October during the same year. Both 2012 and
2013 have come close to exceeding a previous monthly total in just one
day in October. The only year to accomplish this feat since 1880 was
1947!
The forecasted tornado threat on Friday materialized with significant
tornadoes over eastern Nebraska and northwestern Iowa. The preliminary
count for Iowa is five, which is many more than the long term average
number of tornadoes in October as shown by the featured chart. The
chart shows the monthly average using data back to 1980 and the monthly
totals for the past two years. Needless to say, these past two years
have seen many fewer tornadoes than on average. Dry weather is in the
forecast with very pleasant temperatures.
This is about the time of year by which much of Iowa has experienced
its first freezing temperature. The featured chart presents the year
to date lowest temperature after 1 July climatology for Ames. While
not strictly the same metric, the intersection of the black line
(average lowest temperature to date) and dashed line (freezing
temperature) around this time approximately matches the average first
freezing temperature of the fall. The minimum to date temperature for
this year shows that we are well on the warm side of long term average.
The shaded areas represent the percentile ranges of 50% and 95% of the
daily data. The red line should remain flat for at least the next
seven days with low temperatures well above 40 degrees.
Temperatures warmed nicely on Tuesday thanks to sunshine and warm
winds. The featured chart presents the frequency of having a 3 PM
temperature 5 or more degrees warmer than average at 3 PM, or at least
5 degrees cooler than average and wind speeds at least 10 mph. The
overall frequency of having wind speeds over 10 mph is shown as well.
The significant difference among the three lines is during the warm
half of the year with above average temperatures having ten plus mph
winds more frequently. This shows that when temperatures are warm in
Iowa, there is more often a breeze as well.
The featured chart is a called a Hovmoller Diagram. It displays the
time evolution of some averaged field. In this case, each row
represents the meridonal (north-south) average daily high temperature
departure for the midwestern US. Time increases as you go down the
chart. The two vertical lines represent the areal average that
includes Iowa. Values on the left are to the west of Iowa and likewise
values on the right are to the east of Iowa. A neat aspect of this
chart is that you can visually see the movement and modulation of air
masses. For example in September, you can see movement from upper left
to lower right. This represents air masses going from the western part
of the domain to the eastern part, with the slope representing the
speed of movement. The plot also shows a difference during the summer
months to what has happened since early September. The difference is
due to having storm tracks every week or so as opposed to persistent
air masses during the lazy days of summer. The very dark blues (cold
departures) showing up in October are where the snow fell in western
Nebraska and South Dakota.
A week ago Friday severe weather visited the state, including a
recently rated EF-4 strength tornado near Correctionville. This event
was the first severe weather warnings in 10 days prior. The featured
chart looks at the frequency of follow up severe weather events after
an event that was the first in ten plus days. The chart attempts to
answer the question of how frequent are days with severe weather after
an initial day that ended a recent drought of it. The data is
partitioned by three periods of the year. Frequencies are higher
during the summer season as severe weather is more common. There is
some hint at an elevated frequency 5-7 days after the event, but
nothing significant. The severe weather expected today will mostly
miss us to our northwest.
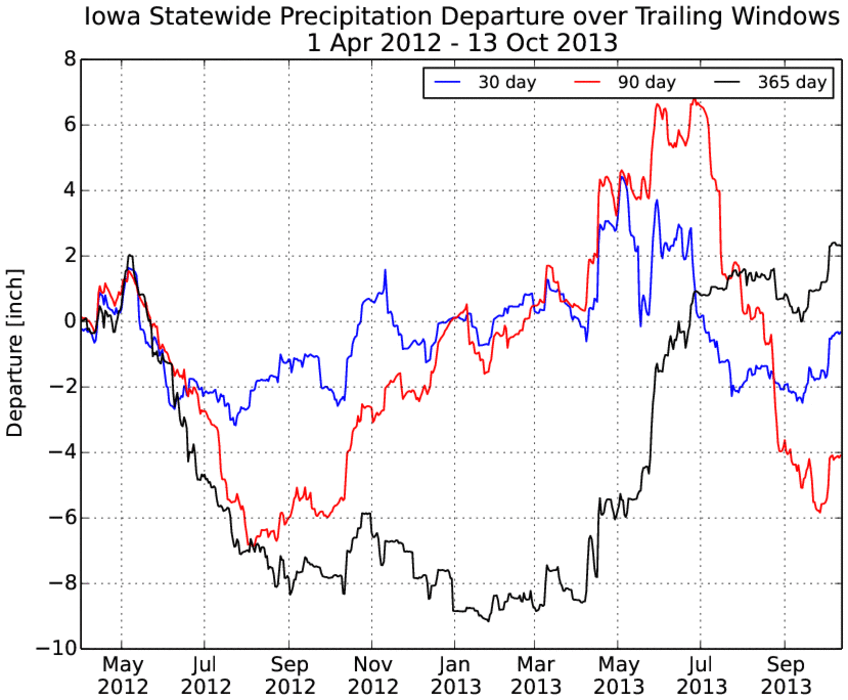
The drought situation in the state remains very complex. The featured chart shows time
series of trailing 30, 90 and 365 day trailing departures for statewide areal averaged
precipitation. The current drought analysis for the state has a small portion in D3
designation and another small portion in no drought with the rest of it in D0 to D2. The
chart shows that the year long departure is now well above average while the 90 day is well
below. This is due to the wettest spring season on record helping the 365 day departure
while the 90 day no longer includes that period. This year's growing season is now done,
so any rain now will go toward helping the soil moisture situation for next year. Some rain is
expected later today, but then the forecast turns dry again.
October has seen both stretches of dry weather to help with crop harvest progress and
rainfall events to help the drought situation. The featured map is of accumulated
precipitation estimates from NOAA for the first fourteen days of October. Some parts of the
state have missed out with totals less than an inch. After the rain moves out this morning,
another stretch of dry weather is expected with pleasant fall temperatures.
October 1 is the start of the water year. Since our growing season ends roughly around
this time, any precipitation that falls afterwards will go toward recharging soil moisture for
the next growing season. The featured chart displays the yearly cycle of root zone soil
moisture as estimated by the Iowa Daily Erosion Project. The black line represents the
simple average of all the years plotted. Moisture levels start to increase this time of year
showing the recharge of soil moisture taking place as there is no longer a crop depleting it.
The most substantial recharge takes place during the spring time as rainfall events are
more intense and the soil is not frozen.
Much of Iowa has been struggling to see the sun these past few days and so temperatures
have been struggling as well. When the sun is seen, the ground is typically experiencing
the potential maximum amount of energy received for that day and time of the year. This
produces heating that drives our near surface air temperatures warmer during the daylight
hours. The featured chart presents one model's estimate of daily maximum shortwave
solar radiation received at the surface and what actually happened this year. You can
consider the tan area showing up until today as the effect of clouds. The last two bars in
the chart show the minimal amount of solar radiation experienced by Ames for the past two
days. An increase in sunshine is expected today, which will help warm temperatures out of
the 40s and 50s we've been stuck in.
The drought situation in the state has been much worse for some locations than others.
The featured map is an attempt to illustrate this by counting the number of days this
growing season (1 May to 1 Oct) that the previous 30 days had less than 33% of average
accumulation. The area to the north and west of Des Moines shows up prominently in this
analysis and is where the current most significant drought depiction is located for the state.
Northeastern and far western Iowa shows up favorably on this map with few days meeting
this arbitrary criterion.
The featured map displays the combination of morning low temperatures and infrared
satellite imagery for this past Thursday morning. The white areas on the map represent
the presence of clouds and the warmest low temperatures you can find on the map are
underneath these clouds. Clouds play a critical role in the radiation balance by absorbing
long wave radiation emitted by the surface and then re-emitting it back toward the ground.
This process helps keep air temperatures warmer versus nearby areas without clouds.
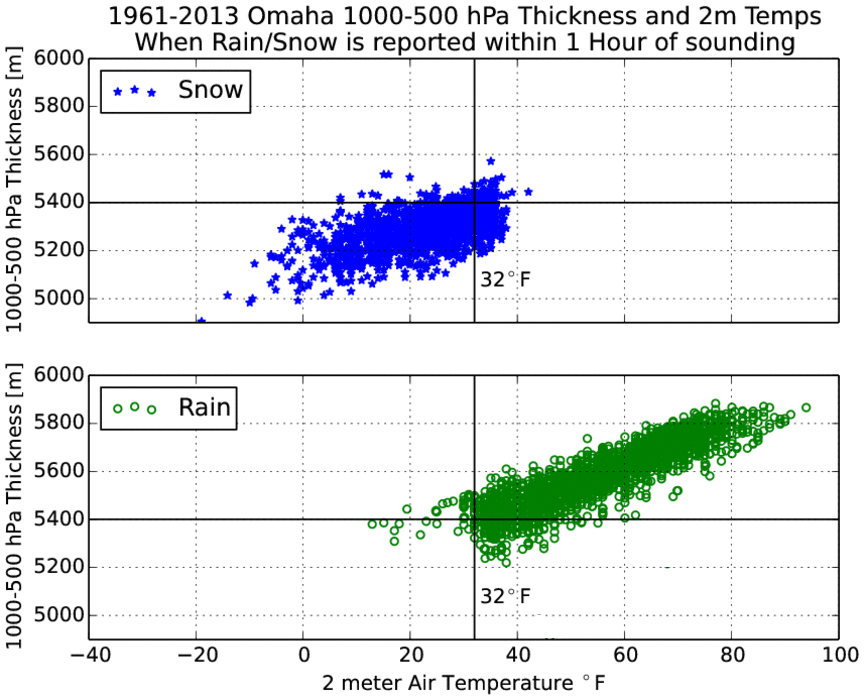
A forecasting rule of thumb is to look at something called the "540 thickness" to delineate
snow versus rain events. The technique involves subtracting the height of the 1000 mb
surface from the 500 mb surface. When this depth of air, or thickness, falls below 540
decameters (5400 meters), the air is typically cold enough to support snow. The featured
chart presents the combination of this thickness value vs near surface air temperature for
events where rain or snow were reported by the Omaha airport weather station. There are
many caveats to this chart including exact timing issues and changes in automated
reporting techniques for rain + snow. The application of this chart to today's weather is that
thicknesses are well below 540 over eastern Iowa and closer to 540 over western Iowa.
Snow is more likely the further east into the falling precipitation you go!
Snow fell over parts of the state on Tuesday including Waterloo which reported all of an
inch of snow, which promptly melted thanks to above freezing temps and very warm ground
temperatures. This was the first snowfall for the location since the epic snowfall of early
May making for a period of 171 days without snow. The featured chart shows the period
each year since 1896 between the last spring snowfall and the first snowfall of the fall
season. The two vertical lines are the simple average for the beginning and end of this
period. Only two years had shorter periods with 1991 at just 153 days.
Some snow visited the state again on Tuesday, but nothing to get excited about. It was a
cold and dreary day with highs only in the low 40s and low clouds. The featured chart
presents the frequency of the height of the overcast cloud layer as reported by the Des
Moines Airport. This is referred to as the ceiling. There are caveats galore with this plot
including changes in instrumentation and reporting algorithms. These caveats explain
some of the bright bands in the plot at certain levels. Putting those issues aside, you can
see a clear annual signal with low ceilings much less common during the warm half of the
season and the very low ceilings confined to winter. The reason being that lower
atmosphere temperatures are warmer in the summer with strong surface heating, this
makes it more difficult for the air to remain saturated as heating lowers relative humidities.
In the winter time, fog and snow are more persistent leading to lowered reported ceilings.
The featured map displays the USDA crop progress report from this past Sunday for
percentage of corn acres harvested and the departure from recent average for the third
week of October. A late maturing crop and some wet stretches in October have put the
pace of harvest behind schedule. Recent freezing weather over much of the state will help
kill off the crop and speed up the dry down period. The weather looks dry this weekend
with chances of showers arriving next week.
After a very chilly start, temperatures warmed nicely in Iowa on Sunday with some places,
like Ames, having a 40 degree warmer high than low temperature. The featured chart
displays box and whisker plots for the daily temperature rise partitioned by month of the
year. Having a 40 degree rise in October is not uncommon, but would be very rare in the
mid summer. The box shows the 25th to 75th percentile of the data (half the observations)
and the whiskers show the 5th and 95th percentile. It will be a bit before another very nice
day like Sunday as wet weather is expected for much of the coming week.
A few weeks ago, this chart was featured showing how the minimum temperature for Ames
to date was well above average. Fast forward two weeks and a few very cold nights, we are
now below long term average! The chart shows that in a week or two more, temperatures
near zero will not be out of the question! Our immediate future has thunderstorms in the
forecast for this week and temperatures remaining above freezing.
The big story this week is the amount of rainfall expected to fall just to our south. The
featured map is forecasted five day precipitation from the Weather Prediction Center.
Totals for extreme southeastern Iowa are shown approaching two inches with amounts
trailing as you go northwest. The rain is expected to get started today and last into
Thursday. Temperatures will be warm enough not to worry about snow from this storm
system.
Only two months remain before finishing out 2013 and the precipitation totals so far have
been a mixed bag across the state. The featured map shows estimated precipitation
departures for the year to date period. Northeastern and far western Iowa are analyzed
above long term average while the central and southeastern portion of the state are below.
This map does not tell the whole story as much of the state experienced dry conditions
during the summer and extremely wet conditions during the spring. Our near term rain
chances look to return next week.