And yet another mostly dry month is in the books this year, but some
lucky areas of the state did pick up close to average rainfall. The
featured map presents an analysis of NWS COOP rainfall reports for the
month and some parts of the state are shown under an inch. The
forecast does not hold much hope with only limited and brief chances of
rain this upcoming week.
For the first nine months of the year and based on preliminary
estimates by the IEM, 2012 comes in as the third driest on record since
1893 for Iowa. The featured chart displays the yearly totals of
precipitation for the first nine months of the year. Only 1988 and
1894 come in with lower totals than this year. We really need a wet
fall and winter season to recover the soil moisture in time for the
planting season next year.
Applying trend analysis techniques often used for stock price
forecasting to weather data is an interesting venture. The featured
chart looks at "golden and death crosses". The "cross" is a reference
to the intersection of two moving average lines within a time series
plot. One line represents a short term window average and the other
is a longer term window average. The theory is that when the short
term moving average moves above or below the longer term average, the
immediate term direction of the trend continues (aka momentum). A
"golden cross" is when the short term average surpasses the longer
term average (upward momentum) and a "death cross" is the opposite
situation (downward momentum). So applying this to a time series of
daily average temperatures, we can find these cross events occurring
between a 50 day and 200 day moving average (typical periods used for
stock price analysis). The top chart shows an example of this
analysis for the recent few years. These events happen once per year
and their date of occurrence is included in the bottom two charts.
When the actual data has a preference to be on one side of the trend
line, this is called either support from going lower or resistance to
going higher. The cross events are said to denote a regime switch
between resistance and support. So within the past week we had a
"death cross" which would indicate that the near term 50 day trend
will now act as resistance and our temperatures are going lower! Of
course, we live in a physical world and statistical behaviors of
temperature are more a result of cyclical processes that play nicely
with trend analysis techniques.
Our warm and dry weather this year has not felt like recent years in
Iowa. The featured image presents an academic exercise of matching our
weather to another place's climatology. On a two week basis, which
site in the country has the closest climatology to the temperatures in
Des Moines. Or more simply, where does our weather most feel like? As
the graphic shows, we have had quite the journey this year with trips
to Hawaii, the west coast, Texas, and others! The two sites in blue
were the only matches for locations to the east of Iowa. While not
shown, this analysis was run for the previous wetter years of 2010 and
2008. Those years had many more matches for locations to our east.
Our climate this year has been more like a semi-arid one, than a humid
continental.
Iowa remains in the firm grasp of a drought, but when did it start? It
is hard to define when a drought starts as the term "drought" is
ambiguous and it takes some amount of time of dry weather before the
term can apply. The featured chart looks at the running departure of
statewide precipitation over three different windows of time for a
period around 1988 and our current drought period of 2012. For this
year, this analysis would clearly indicate that significant deficits
started showing up in May. Although, a closer look shows somewhat
drier conditions existing since September of 2011. Let us compare 2012
with 1988 shown in the top chart. Significant deficits started
appearing in March of 1988. If the 2012 drought started in May and
1988 in March, this may provide some insight into why agricultural
crops were not a complete failure in the state this year. The reason
being there was some soil moisture available to start off the growing
season and some precipitation came in late August/September to help
out. Notice how the 365 day departure degraded in Aug/Sep for 1988 and
flattened out for 2012.
After spending most of the year comparing this year to the 1930s for
hot temperatures, we now have a comparison for cold temperatures as
well! At least two locations in Western Iowa reported a low
temperature of 12 degrees on Sunday morning. This is the coldest
temperature reported this early since 6 October 1935 when 12 degrees
was reported as well. The featured chart presents the yearly minimum
fall temperature reported prior to 8 October and the first date that a
sub 13 degree temperature was reported for the fall for anywhere in the
state. Typically, this cold of weather arrives in November.
Based on preliminary statewide data, this year is the third driest on
record since 1893. Over various this year, it has been wetter or drier
than that. The featured chart looks at precipitation ranks when
computed from a period to today or from the first of the year to a
given date. For a period from 1 May to 8 Oct, this year is the driest
on record for the period. While the rains of August helped short term
deficits (top chart), they did not change the year to date ranks
(bottom chart). There are actually some chances of rain in the
forecast! Hopefully they start a process on making up these deficits.
As with most of the year, rainfall has been difficult to come by in the
past four weeks. When smeared over the entire state, the estimated
rainfall on Tuesday added up to a mere 8 hundredths of an inch and
matches the highest total we have seen since the 17th of September.
The highest total so far for September and October is just 26
hundredths of an inch. Since 1893, the smallest maximum daily total
for these months was 34 hundredths back in 1952 and 1953. Our fortunes
may be about to change with thunderstorm chances arriving this weekend
and expectations for heavier rainfall totals than what we have
previously seen from passing storm systems.
The featured image presents an update on the chances that this year
will be the warmest on average for Des Moines. The chances are
computed by taking this year's observations and appending all previous
years observations to represent scenarios. The result of this
operation shows that over 86% of the previous years would result in
this year beating out 1931 (current warmest year). The forecast for
the next week has overnight low temperatures on the warm side, which
should help keep 2012 with a comfortable lead!
The big weather story this week is the predicted severe weather
outbreak arriving this weekend. The featured image is forecasted
severe weather threat categories from the Storm Prediction Center for
Saturday. Much of Iowa is in the slight risk category. Typically,
these fall severe events are conditional on heating of the lower
atmosphere, so seeing the sun shine on Saturday would be a bad omen as
it would help to fuel thunderstorms later in the afternoon.
Most of Iowa picked up much needed rainfall this past weekend and
avoided the severe weather as well. The featured map is of estimated
precipitation for the event. The highest totals were near five inches
with much of the state over an inch. This was easily the heaviest
rainfall in Iowa since April! Some more rain is in the forecast for
mid week with comfortable temperatures.
This past weekend experienced Iowa's heaviest rainfall since April of
this year. This was thanks to an increase in moisture and efficient
rainfall producers. The dew point temperature rose significantly into
the weekend from 14 degrees on Friday morning to 64 by Saturday evening
for Waterloo, which makes for a 50 degree jump in just under two days.
Checking back on the archives of data for Waterloo, the largest two day
change in dew point on record occurred on 17-19 January 1996 when the
dew point went from 50 down to -21 degrees (71 degrees). When just
considering rises in dew point over two days, 56 degrees was the
maximum back on 1-3 July 1949.
Precipitation comes in various forms and at various rates for Iowa.
For this year, precipitation has been difficult to come by. Have we
missed out on heavy rainfall events or lots of smaller rainfall events?
The featured graph attempts to address this question by showing the
accumulated precipitation over increasing daily precipitation. For
example during 2012, the total rainfall for daily events less than 0.5
inch has been 15 inches. Restating, 15 inches of rainfall this year
has come from daily events of less than 0.5 inches. The flood year of
1993 certainly sticks out on the opposite end of the spectrum. So for
2012, the line would indicate we have missed out on both light and
heavy rainfall events.
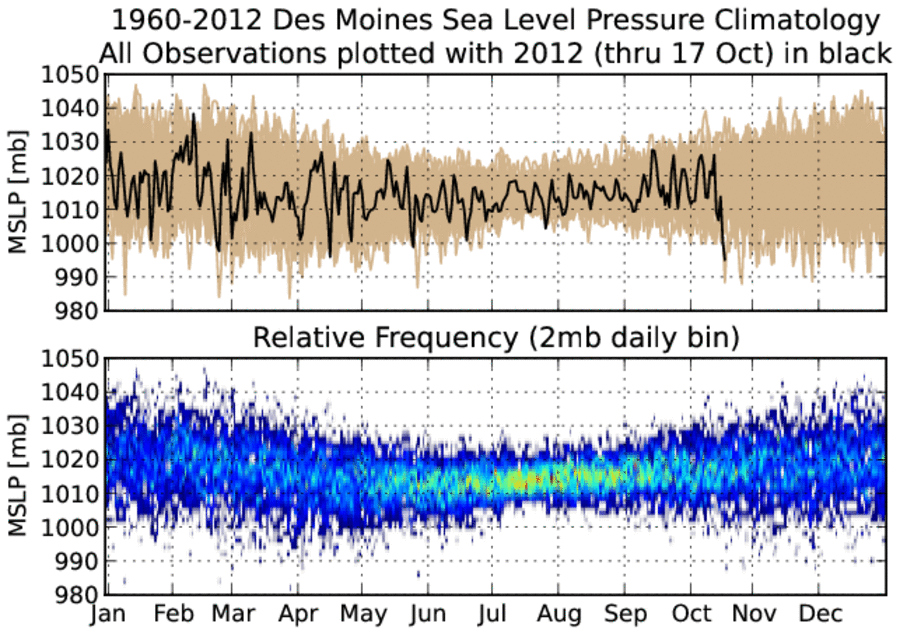
A strong fall storm system is currently providing Iowa with plenty of
wind and severe weather over the southern plains. Our sea level
pressure has dropped below 1000 mb for the first time since May. The
featured chart looks at some climatological aspects to the mean sea
level pressure (MSLP) reading for Des Moines. The top chart presents
the range of observations for each day of the year since 1960. The
range in pressure is much smaller during the summer time due to the
strong storm system tracks being further north and the air mass
dominance of warm air. The bottom chart is an attempt at showing the
relative frequency of pressure readings and the variability of the
fall, winter, and spring months can clearly be seen. These larger
differences in pressure help to drive stronger winds as will be the
case for today!
With a number of comparisons being made of this year to the years of
the Dust Bowl Era (1930s), it only makes sense that a full blown dust
storm visit the plains states now as well. A very large storm system
generated a large area of strong winds on Thursday and kicked up a
bunch of dust from Nebraska to Oklahoma. The featured image shows the
combination of peak reported wind gust along with a true color image
from the Aqua MODIS satellite. You can see the streak of brown just
outside of the cloud shield from the storm complex. Peak winds were
well above 50 mph and even reached 75 mph in some select locations.
After some blustery and chilly days this October, very warm weather
returned on Sunday with the high temperature, once again, exceeding 80
degrees for Des Moines. Des Moines has already recorded the most
number of days over 80 in any year for the site. The featured chart
looks at the local day temperature departure for days this year that
have been over 80. The very anomalously warm days in March were
certainly the most exceptional of the year. The bottom chart shows the
percentage of days over 80 that were also 10+ degrees warmer than long
term average. 2012 shows up again with its contemporaries of 1934 and
1936.
Very muggy air for this time of year visited Iowa on Monday. The dew
point temperature reached 65 degrees Fahrenheit for Des Moines. It is
very late in the year to have such a high dew point temperature as
shown by the featured chart. Only two other years (1934, 2004) have
experienced 65+ dewpoint after 22 October. Two more very warm days are
expected before much colder air arrives and highs will only be in the
40s!
The featured chart presents the number of days this year that Des
Moines high temperature has been at or above a given threshold. For
thresholds between 63 and 83, this year has seen the most number of
days at or above those levels. Today will be yet another very warm day
with highs expected to near 80 degrees. Big changes arrive on Thursday
with highs back into the 40s for the weekend.
The very muggy air that has visited Iowa for the past fews days is
almost swept clean from the state with the passage of a strong front
this morning. It took a bit for showers and thunderstorms to get going
Wednesday evening, but the rains did come after sunset. The featured
chart looks at the frequency of getting measurable precip for a 24 hour
period after a given dew point observation by week of the year. The
general pattern is with increased dew points for a given week, the
chances of precip increase as well. The highest frequencies are for the
spring and fall periods at relatively high dew points for that time of
year. These higher dew points are often associated with storm systems
that draw moist air from the gulf region northwarn and eventually lead
to precipitation, like what is happening today.
This year has seen many very warm days. When compared with the same day
for 2011 for Des Moines, this year has had 117 net more warmer days for
high temperature! This total dwarfs all previous years on record and
interestingly makes for the fourth straight year for more net warmer
days than the previous year. Even if you compare this year with
previous years for the same period up until 26 October, it is still
well ahead of any previous year. This total does look to go down
slightly in the coming days as much colder air has arrived and even
some snow over northwestern Iowa on Thursday afternoon!
While living in the here and now, it is sometimes difficult to grasp
the historic event that is unfolding with Hurricane Sandy. Sandy will
be associated with infamous names like Andrew, Camille, Hugo, and
Katrina. The featured image displays a visual comparison of forecasts
from the National Hurricane Center and the track of Sandy up until this
morning. The track does not tell the whole story of the size and
impacts from this storm system that are being felt from Maine to
Florida and to the west even to Chicago!
Hurricane / Hybrid storm Sandy came ashore Monday evening and brought
lots of wind, rain, and storm surge along with it. The featured map is
a simple analysis of peak wind speeds reported on Monday. The big
caveat with maps like this during big storms is that stations are often
knocked offline during the highest impact weather and will miss
reporting the highest wind speeds. The highest reported wind speeds
were in the 60 to 100 mph range for most of the eastern coast from
Virginia to Maine.
For Des Moines, October looks to be the first month with a below normal
daily average temperature since September of last year. Statewide,
August of this year was slightly cooler than average as well as
October. The monthly departures are shown in the featured image and
the departures have been rather large to the warm side in the past two
years. November looks to start off on the warm side of average and
mostly dry conditions.