Our recent stretch of hot weather has thankfully come to an end. Des
Moines topped out at 104 degrees on Friday, which was the warmest
temperature on record this late in the year. The featured chart
displays the latest date of the year for a given high temperature. The
104 for Des Moines set the latest date for the 104, 103, and 102
temperature levels. The year of the temperature record is shown as
well. Temperatures are expected back into the 90s next week with next
to zero chances of precipitation.
The featured chart shows the evolution of aridity since mid April
evaluated on a weekly basis for a trailing 14 day period. The weekly
values are connected in time to show the trajectory of the change in
aridity. This type of chart has a nice property of tending to make
circles as temperature and precipitation departures tend to influence
each other. The chart shows an interesting transition from 1 Jul to 8
Jul, where we went from above positive precipitation to negative and
have not make it back. In fact, it it kind of interesting to see how
we've gone from a cold and dry to a hot and dry situation with the
precipitation departure holding close to negative one sigma. The line
is nearly horizontal going from 19 August to 2 September. The forecast
does not hold much hope for positive precipitation departures with more
hot weather on the way next week.
The current drought situation in the state is very complex as shown by
the featured chart displaying trailing departures for IEM computed
statewide areal averaged precipitation. While the 365 day window is
slightly above long term average, the 30 day and 90 day are well below.
The wettest spring season on record for the state is what is currently
allowing most crops in the state to hold on. The chart shows an
interesting combination of the 365 day departures becoming less
negative while the 30 and 90 day go the opposite direction. The reason
being the wet spring replacing a much drier period during the previous
year and that same period falling out of the 30 and 90 day windows. So
while the dramatic drop in 90 day departure screams a flash drought,
the long term departure is being bolstered by the wet spring.
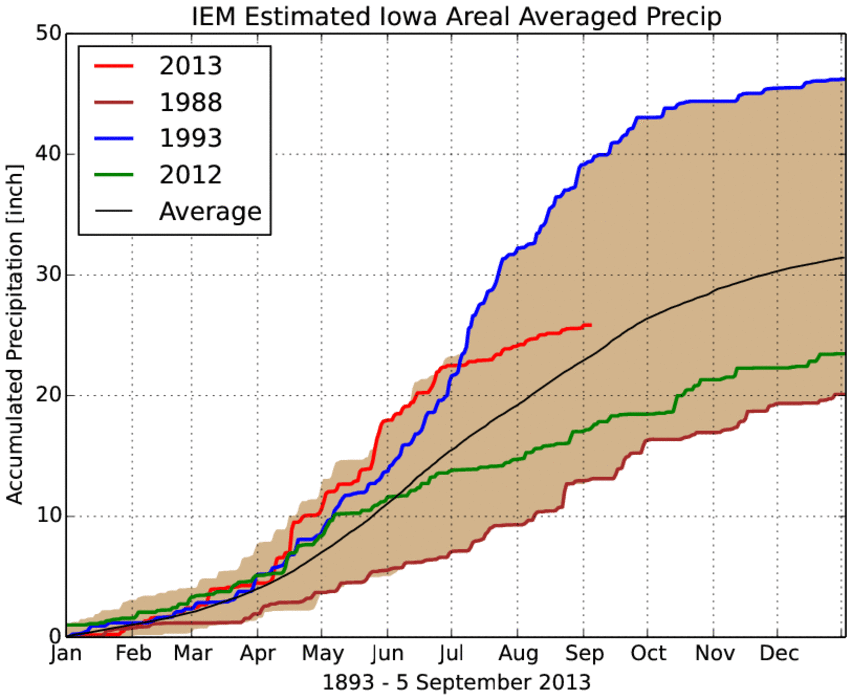
Will 2013 be remembered for being a wet year or a dry year or both?
The featured chart displays the statewide accumulated precipitation for
this year, last year, 1993 (wettest year), and 1988 (driest year). The
shading represents the range of values since 1893. Around the end of
June, this year was the wettest to date on record, including 1993. The
weather since then has been very dry and how the year to date
accumulation is approaching merely average with 1993 some 15 inches
higher! The forecast continues to hold little hope of widespread
precipitation.
For the month to date, the average temperature for 1-8 September has
been warmer than 1-8 July for Des Moines. The featured chart shows the
frequency of this happening for the first of each month to the given
date. For the 8th, about one in five years have seen this happen. The
forecast has parts of Iowa near 100 degree today with cooler weather
expected by the end of the week. If Des Moines were to hit 100 degrees
today, it would be the latest into the year for such a warm
temperature.
Monday was one of the warmest days in September on record for Iowa with
a number of locations hitting triple digits. The featured map shows
reported high temperatures along with the number of years since as warm
a temperature was reported in September. Waterloo and Des Moines had
the warmest temperature since 1939. Iowa City had the warmest
temperature since 1901! Today looks to be another scorching hot day
with highs only in the upper 90s!
Only a week after the IEM seminar looking at the difficulties of
answering the simple question of how much rain did Ames get, life
imitates art. The featured map presents NOAA MRMS Project estimate
precipitation and local point observations of total rainfall from
Tuesday and Wednesday. The map is showing the Ames metro area. The
airport reported 0.30" while most of the northwestern section appeared
to get just sprinkles. The MRMS estimate shows remarkable cell to cell
variability with totals ranging from 0.15" to 0.4" within a few street
blocks of each other. So how much rain did Ames get from this event?
The United States Drought Monitor is a hand drawn analysis of weekly
drought condition in the country based on quantitative and qualitative
measures of drought. The featured map shows the most recent analysis
valid on the 10th. The entire state except about two counties is shown
in some level of drought condition. The plotted numbers are IEM
computed counts of the number of recent periods having a precipitation
departure of at least negative 1.2 standard deviations from average.
Four periods are shown covering the recent 30, 60, 90, and 120 days.
So if a location has a four plotted, each of those periods has a
precipitation departure worse than negative 1.2 sigma. The negative
1.2 level is about when "D2" drought is to be analyzed. The numbers
show the most consistently dry areas of the state are from central to
southeastern Iowa. Northeastern and extreme western Iowa have not been
as dry.
The featured map is an analysis of precipitation accumulation
percentage of normal since 1 July. For the period, the driest part of
the state has been the around the Rockwell City area with less than 20%
of average amount received. All of the state is shown below 70% with
the extreme northwestern portions faring the best. The forecast does
have chances of rain this week along with a return of 80 degree
temperatures.
The featured map presents the IEM computed percent of average number of
tornado and severe thunderstorm warnings issued per NWS forecast office
for the year to date. The average is computed for the same year to
date period over the years 2003 to 2012. Most of the Iowa forecast
offices are below average for warning counts, except LaCrosse. The
largest positive departures are out west with some offices 200% of
average. The southeastern US is generally below average with many
offices below 50%.
For places like Des Moines and Ames, it finally rained again yesterday!
The Des Moines Airport weather sensor reported measurable rainfall on
seven different hours, which exceeded the total to date for all of
September and August. The featured chart shows the monthly climatology
of number of hours with reported precipitation and this year's total.
It is interesting that the climatology for January is about the same as
July! Of course the nature of storms for those two months is much
different and intensities are much smaller in January. It is raining
again this morning in some parts of Iowa and more rain looks to be on
the way this week.
Severe weather looks to be a possibility today with the passage of a
cold front. The featured chart presents the combination of 500 hPa
flow as observed by the Omaha sounding on September days with severe
thunderstorm and/or tornado warnings issued for Iowa. The polar chart
shows the wind direction and speed with the size of the dots indicating
the number of warnings issued that day. 500 hPa (same unit as millibar)
flow is important to thunderstorms as changing wind speed and/or
direction is necessary with increasing height to separate updrafts and
downdrafts in long lived thunderstorms. During the summertime, wind
shear is often weak and so a downdraft will often choke out the updraft
of a storm and limit its lifetime. The chart shows that at least 10-20
knots of wind speed are typically needed for severe events. The
forecasted wind at 500 hPa this evening for Omaha appears to be around
30-40 knots from the WSW.
The featured map displays the combination of estimated past seven day
rainfall along with the most recent US Drought Monitor analysis. Much
of the state received much needed rainfall in the past week, but some
of the driest locations in southeastern and northwestern Iowa missed
out on the heaviest totals. The rainfall on Thursday was accompanied
by damaging winds with Des Moines and suburbs experiencing considerable
tree damage. The forecast has the dry weather returning with pleasant
fall conditions.
Very cool overnight temperatures visited the state this past weekend
with lows approaching freezing over northwestern Iowa on Saturday
morning. This very cool weather was close to the most recent full moon
late last week. There is a saying in weather folklore that the first
freeze of the fall season often happens on the full moon as having a
full moon impacts the profile of water vapor which allows temperatures
to more rapidly cool. The featured chart looks at the first fall sub
29 degree temperature for Ames and the proximity to the nearest full
moon. As you can clearly see, these events happen at about any time
during the lunar cycle. The reason that this folklore gets perpetuated
is that the first frost is almost always on a clear sky night with
limited water vapor in the air, so any moon will appear very bright and
crisp.
Our first day of fall was wonderful with highs in the 70s, clear skies,
and low humidity. The featured chart looks at the frequency of this
afternoon weather combination. The chart shows two clear peaks around
late spring and early fall. This type of weather becomes fleeting the
further into October we go, so enjoy it now if you can!
The hope was going into this fall that we could extend the growing
season as far as possible due to the late planting dates and cool
summer. So far a killing frost has yet to happen in Iowa and the
featured map shows that minimum temperatures this fall are on the warm
side of climatology. Most of the state is above the 70th percentile,
meaning this year has been warmer than at least 70% of the previous
years since 1951. The forecast looks to continue the warm weather into
at least the first of October.
It is always fun to look at MODIS satellite true color imagery when
there are no clouds in the sky. The featured image compares the Aqua
MODIS true color image from this year and last on 23 September. The
difference in color is noticeable with 2012 much browner than this
year. While both years experienced a drought, last year had record
warmth and this year had a cooler summer with a late spring planting
date. The effect is that many fields are still green this year as the
crops have not reached maturity. This is why avoiding a freeze is so
important as the crops need more time.
The featured chart displays average weekly river flows for the Squaw
Creek in Ames at Lincoln Way (near ISU Campus). The dry summer has
river flows at zero again and resembles what happened last year. Since
1990, there isn't a comparable period to what has happened in the past
two years. Between 2006 through 2010, the chart shows significant
flows occurring in the late fall thanks to late season rains. The
Flood of 1993 shows up nicely on this chart as the high flows lasted
into the next year. The forecast does have good chances of rain for
this weekend, so perhaps some water can start flowing at the gauge site
again!
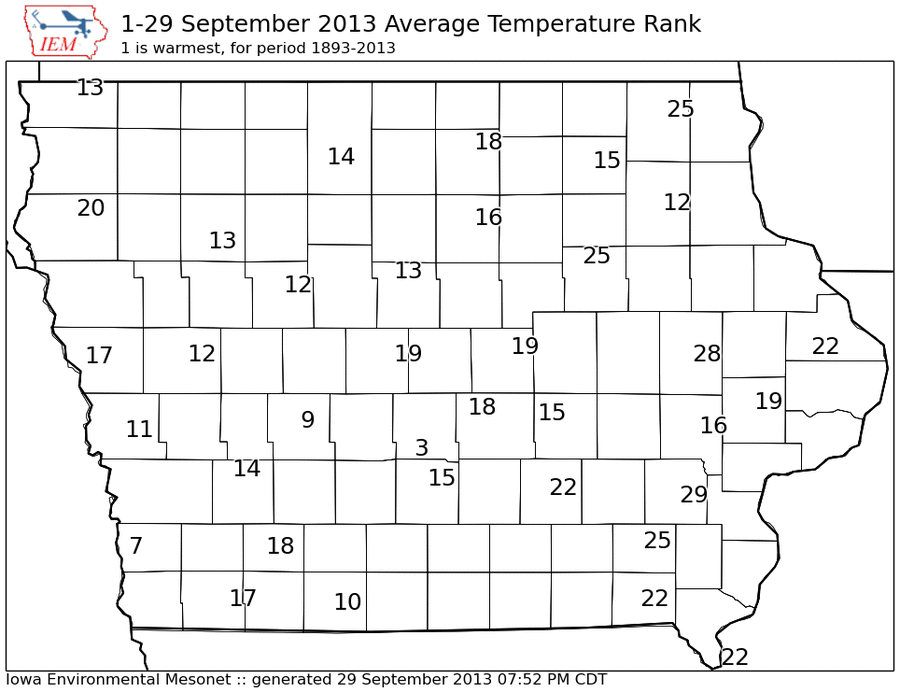
The featured map displays the average September temperature rank for
the long term climate sites in Iowa. For Des Moines, this September is
currently the third warmest on record, but other sites in the state
have ranks ranging from 7 to 28. The difference is probably due to the
enhanced urban heat island effect for Des Moines. Temperatures will
continue to be warm to finish off September today and it'll continue
into October with highs in the 80s for much of Iowa.