While Labor Day is the unofficial end of summer, the end of August is
the official end of meteorological summer (the months of June, July,
and August). The average temperature this year was the warmest since
1988, but only slightly warmer than last year. The featured chart
presents the average summer temperature for Iowa for each year since
1893. September has gotten off to a rather warm start with highs in
the 90s for most in the state.
Muggy weather returned over Labor Day weekend with humidity levels
running more like what we would have expected in August. For Des
Moines, the dew point on Monday was slightly higher than even the
highest dew point for all of August. The featured chart shows the
yearly combination of highest September versus August dew point.
Points above the one to one line would represent years like this year
with a higher dew point in September. This combination is somewhat
rare and last happened in 1998.
Tuesday was yet another very warm day this year and humidity came along
for the ride this time pushing heat indices over 100 for much of Iowa.
This is somewhat rare to occur in September with the last occurrence
for Des Moines being back in the year 2000. The featured map is a
simple analysis of computed heat indices from the primary automated
weather stations in the state. All of this heat and humidity helped to
fire numerous rounds of severe thunderstorms over night and into this
morning.
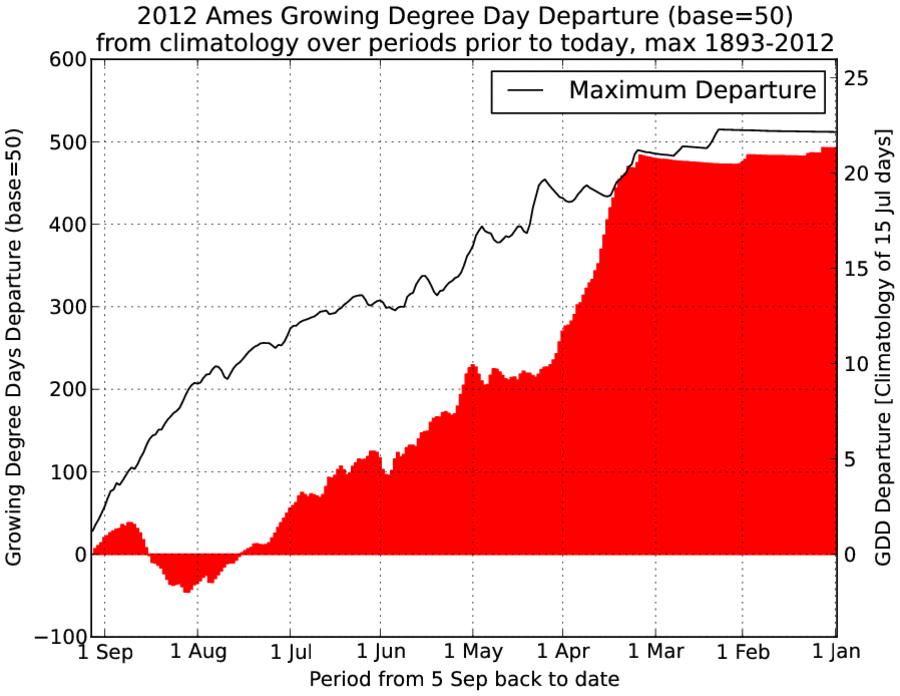
With one of the warmest summers on record, one would not expect there
to be a lack of growing degree days. Sure enough, the featured image
shows that full season departures have been well above normal and as
measured by mid July days (right hand axis) we are about 10 days ahead
of normal this year. The black line shows the maximum departure on
record since 1893 for the period from the given date to 5 September.
Our recent weather has seen a stormy change when compared with the
drought filled summer. One reflection of this is shown by the featured
chart of accumulated severe thunderstorm and tornado warnings for each
of the past five years. The top chart shows the nationwide
accumulation while the bottom chart is for warnings issued by the NWS
offices with Iowa coverage (includes some warnings slightly outside of
Iowa). A logical correlation with drought conditions is the lack of
heavy rainfall associated with severe thunderstorms. After being ahead
of each year in late May for Iowa (purple line), the lack of many
summertime storms now has 2012 as being the least of the past five
years in early September.
The updated United States Drought Monitor last week included the worst
category of D4 (Exceptional) for a very small portion of the state near
Sioux City. This is the first D4 designation in Iowa since at least
the year 2000. The featured chart presents the weekly areal coverage
of the drought categories since 2000. The small D4 percentage is not legible on this chart and hopefully it does not increase in size going
forward! The D3 (Extreme) category is also at the largest percentage
for Iowa since 2000.
Tuesday was yet another very warm day in Iowa with highs pushing 90
degrees for much of the state. For Des Moines, Tuesday tied the
previous record for most days with high temperature at or above 82 and
83 degrees. The featured chart presents the maximum number of days per
year at or above a given temperature threshold. The current maximum
number of days is shown in gold and the 2012 total so far is shown in
cardinal (Go Cyclones!). High temperatures today will come close to
breaking the tie at the 82 and 83 thresholds. Keep in mind that we
still have 3.5 months left to potentially break some of these other
thresholds.
Yesterday's feature compared 2012 total number of days above a given
high temperature threshold for Des Moines with the maximum for any
year. Today's feature is a slight modification showing the number of
days above a given threshold for every year for the period up till 11
September. For temperatures above 100, 1934 and 1936 stand apart from
any other year. But for lower temperature thresholds, this year shows
a remarkable departure from other years. Much of this was thanks to one
of the most extremely warm months on record, March 2012. The forecast
for the next week has our weather turning much more fall like and very
comfortable!
Des Moines experienced its first day with a high temperature below 70
degrees on Thursday since the first of July. The featured chart
presents the first day each year after 1 July that the high temperature
was below 70. The latest date for this event was 24 September 1931.
Temperatures will warm back into the 70s today and near perfect weather
around 80 degrees this weekend.
Voting: Good - 102Bad - 25
Mon Sep 17, 2012
View larger image — numbers plotted are the difference of average from threshold
This weekend saw very pleasant temperatures with highs in the upper 70s
and 80s. A cold front is set to bring a regime change to our weather
today. Will this be the last we see of the 80s? The featured chart
looks at the warmest high temperature after having a high temperature
at or above a given threshold for the period including the rest of the
calendar year. The maximum, average, and minimum of these yearly values
is presented. The point of the chart is that typically these
temperature step-downs in the fall happen in about 3-5 degree
increments. The minimum values show that some years can see dramatic
changes with highs in the low 70s and then not broaching 50 degrees for
the rest of the year. These events happen much later in the year than
September.
Monday was one of the rare occasions this year to have a high
temperature below normal, which started a streak of one day in a row
below normal! The featured chart presents the streaks of above or
below (negative numbers) daily high temperatures for Des Moines. This
year is presented along with 3 famously warm years of the past. This
year has yet to see a streak over 10 days below normal, whereas each of
the other years shown have seen at least one. The longest of these
streaks below average tend to occur in the winter time with significant
snow cover. Our current streak looks to end on Wednesday with highs
back near 80.
Monday morning saw our coolest temperatures of the season so far with
some very limited areas seeing temperatures at or just below freezing.
The featured chart presents an IEM computed analysis of the areal
fraction of the state that has experienced a temperature below 32
degrees prior to a given date. 2012 has yet to appear on this chart as
the freeze area was negligible yesterday. The longer term averages are
computed over two periods for comparison. The two hot and dry summers
of 1988 and 1936 are shown as well for comparison. It is certainly the
time of year to start seeing freezing temperatures in the state.
This chart has been featured a number of times this summer season as it
shows the chances that this year will become the warmest on record for
Des Moines. The bottom charts shows that while we faltered some with
some cool weather in August, the warm weather in September has boosted
us back up to the best chances yet that this year will beat 1931 (the
current warmest). The brown spaghetti lines represent all previous
years appended onto this year until the end of the year and so
represents scenarios if we have any reasonable repeat of previous
years. Using these scenarios, 86% of previous years appended onto this
one would result in 2012 being the warmest on record. These lines
would also suggest that 2012 will remain warmer than 1931 until at
least the first week of December.
A reinforcing shot of cold air is set to arrive this weekend and some
weather models are predicting very cold temperatures on Sunday morning.
The featured map is from the NAM hi-res conus nest model showing
forecasted near surface air temperatures on Sunday morning at 7 AM.
The resolution of this model is sufficient to attempt to resolve subtle
topographic effects on temperature in Iowa. You will also notice the
heat island of Des Moines visible as well. The warmer areas in eastern
Iowa are probably under some clouds, which help to support the
temperature at night time.
Temperatures on Sunday morning dropped below freezing for much of the
state. On the other hand, soil temperatures remain quite warm with the
average temperature at 4 inch depth around 60 degrees. The sun has
worked very hard all summer long to warm the soils and unlike the air,
it takes a bit longer to lose that heat to the fall season. These
warm soils help to create very pleasant fall days when the sun shines
as will be the case this week. The sun has a head start warming the
top soil in the morning and can quickly warm the dry fall air near the
surface. A southerly breeze will also help the process out with highs
near 80 on Tuesday.
After temperatures set or tied record low temperatures on Monday
morning over portions of eastern Iowa, sunshine and warmer air pushed
temperatures well into the 70s for the afternoon. Most of eastern Iowa
saw a temperature increase by over 40 degrees for the day. The
featured map displays the difference between the high and low
temperature on Monday along with the year of the previous date with an
as large temperature difference. A number of locations have not seen
such a strong warm up since 2008. Forest City is shown with the
largest change of 49 degrees, which is the locally largest since 2000.
Tuesday was yet another very warm day in Iowa this year. The high
temperature hit 85 degrees in Des Moines and set the local record for
most number of days at or above 80 degrees in a year. The featured
chart presents the maximum number of days per year at or above the
given threshold. 2012 is on pace to rewrite this metric for
temperatures in the 70s and 80s. Days in the 70s and 80s remain in the
immediate term forecast along with dry weather.
While daily high temperatures have certainly been on the warm side of
normal, overnight low temperatures have been very cool and the net
result is that this month looks to be the second in a row that is
slightly below long term average for monthly average temperature. The
featured chart presents monthly average temperature departures from
current monthly climatology since 2000. March 2012 and December 2000
certainly stand out in this plot for being the most extreme.
The weekly update to the US Drought Monitor is out and there is no
significant improvement to report in the state. Of course, it would
need to rain first for things to improve and rain has been difficult to
come by this September. All of the state remains in at least the D2
(Severe) categorical drought. The forecast has little hope of rain and
temperatures look to warm into next week. The dry and warm weather has
allowed the crops to be harvested at a record rate. The somewhat early
frost has even helped to speed this process up some more!