The featured plot presents a summary of two humidity metrics for the
month of July for Des Moines. The top panel shows the average mixing
ratio of water vapor to air and the bottom panel shows the highest dew
point report for the month for each year since 1935. This year was on
the dry side of both metrics and the driest since 2009, which was a
cool July as well. Muggy air did return to the state to end July and
looks to stick around for the start of August, air temperatures will
not be that bad though in the lower 80s.
From a cold and extremely wet spring, to snow in May and the currently
developing drought, the corn crop has had no shortage of stress thrown
at it this year. While the recent period has been dry, it has also
been cool during an important period in corn development after
tasseling. The featured chart assumes that the corn crop was planted
on 1 May each year and then plots the number of days between the VT and
R2 corn development stage based on growing degree days. The bars are
then colored based on whether the Story County (Ames) corn yield that
year was above or below the trend line. Obviously, one metric is not a
perfect predictor of yield, but it does appear having a longer period
helps yield.
The featured chart is of one minute interval precipitation from the
Philadelphia Airport for last Sunday. 8.02 inches fell on the calendar
day making for a local record daily precipitation total. The chart
shows that most of the 8 inches fell over a four hour period between 3
and 7 PM. The most intense rainfall came between 3:33 and 3:40 with
almost an inch falling in that period.
For Ames, July ended up on the cool side of average for temperature.
The featured chart presents the combination of August vs July average
temperature for each year since 1893. A number of extreme years are
labelled. While some recent feature plots have shown this year
trending like 1947, the near term forecast does not indicate this
August will be as warm as that. We could certainly use rain more than
anything right now.
When the sun heats the ground, the ground heats the lower atmosphere
which drives a mixing process with warm air rising and cold air
sinking. This mixing process grows vertically creating a well mixed
layer. If this mixing encounters colder air aloft, relatively more
heating needs to occur to continue raising the temperature of the
mixed layer. If this mixing encounters warmer air aloft, the heating
process can accelerate as temperatures are already warm. Atmospheric
soundings sample the atmosphere twice per day. The morning sounding
provides a sampling of the air above our heads that may be mixed down
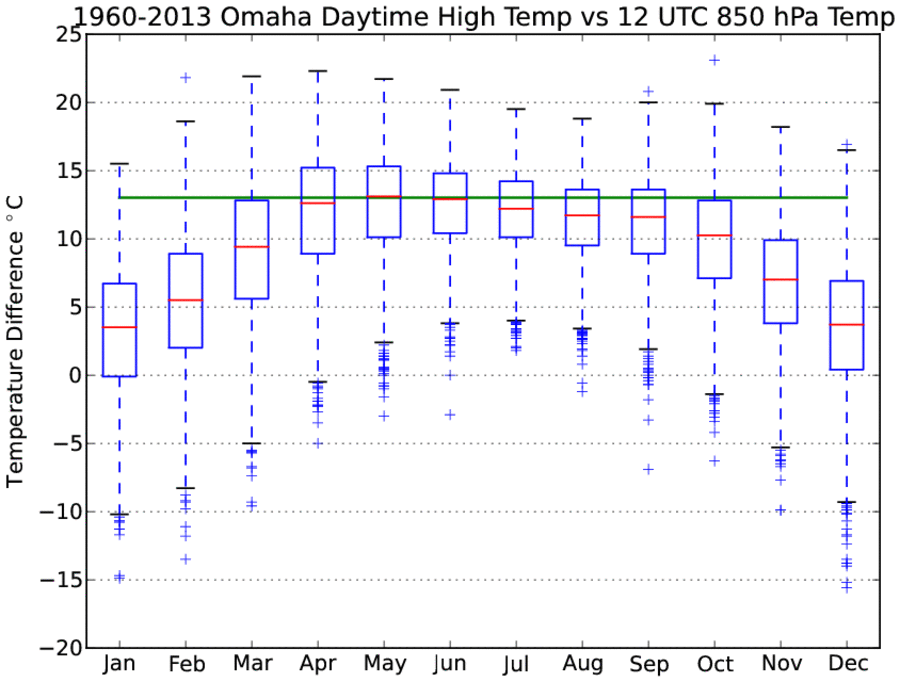
during the day. A informal rule of forecasting in the plains is to
add 13 Celsius to the 850 hPa (millibar) level temperature to provide
an afternoon high temperature. For example, the morning sounding on
Monday for Omaha had 16.2°C at 850 hPa and when you add 13°C to that
reading it yields a high temperature of 85°F. The actual high was
87°F! The featured chart looks at the monthly distribution of change
in afternoon high temperatures from the 850 hPa morning temperature.
The green bar represents 13°C. The box plots provide detail on the
temperature distributions and for the warm six months of the year,
this relationship closely approximates the monthly mean. The cold
months are dominated by horizontal advection processes and also have
decreased solar heating, so this rule does not apply well then.
Outside of the very wet summer for northeastern Iowa, rainfall has been
hit or miss for the rest of the state as shown by the featured map of
the difference between the 1 June through 6 August precipitation total
for 2013 vs 2012. Having the wettest spring on record for Iowa is
currently helping the agricultural crops limp through this dry period
of summer. There are more chances of rain in the forecast, but the
heaviest totals look to be south of Iowa.
Growing Degree Days are commonly used to track crop development. For
"105 day" corn, about 2600 GDD units are necessary to reach maturity.
The cool and wet spring combined with a early May snowfall made it
difficult for corn to get into the ground on time in Iowa. Planting
corn deep into May and June puts the crop at risk of not accumulating
enough GDDs prior to the fall freeze. The featured chart attempts to
provide probabilities of accumulating GDDs based on the combination of
growing season begin (planting / crop emergence) and end (first
freeze) date. The left hand plot shows the overall frequencies based
on yearly data for Ames since 1893. The right hand plot combines what
has already happened this year with scenarios based on all previous
years for 7 August and on. For example, for a corn crop emerging on
15 May, about 20% of the years got to 2600 GDDs by 15 September prior
to the first fall freeze. Given this year's condition, for a corn
crop emerging on 15 May, there is near no chance that 2600 GDDs can be
reached by 15 September and only about 50% of all years will get us to
2600 GDDs at all. One mitigation is that as planting dates get later,
farmers will plant hybrids with shorter maturities (less GDD
requirements). Although, this seed change is not always logistically
possible. The chart would indicate that we need to make it through
much of September without a freeze to give the longer maturities a
chance.
The featured map presents total precipitation since the first of July
as estimated by NOAA's stage IV product. Much of western Iowa is shown
in the less than an inch up to two inches for the period. You do not
have to travel far to find extremely high totals in eastern Kansas and
southern Missouri with amounts upwards of 20 inches! The forecast
looks to continue this pattern, but there will be chances for rain in
Iowa.
The featured chart shows the hourly precipitation totals for Des Moines
from 1 June up until 12 AM 12 August for this year and the long term
climatology. Only the 11 PM to midnight hour has seen a total above
the long term average. A majority of our precipitation during the
summer season comes at night and that has certainly been missing this
year. This chart does not include the seven tenths that fell so far
this Monday morning. Unfortunately the forecast looks dry for the next
7-10 days with the heaviest rainfall again off to our south.
Dew Point temperatures are back in the 50s this Tuesday morning
allowing the air temperature to cool into the 50s as well. It seems
our periods of very muggy weather this summer have been brief. The
featured chart presents the percentage of hours since 1 June that the
dew point temperature for Des Moines was at or above the given level.
A climatological average is shown by the black line and two extreme
years are shown as well. Indeed the amount of time at high dew points
has been below average this year. The bottom chart shows the
percentage of time that the dew point was at or above 50 degrees.
Since 2001, each year has been greater than 90%.
Atmospheric soundings provide twice daily vertical profiles of the
troposphere and lower stratosphere. The lapse rate is calculated from
this profile as the rate of temperature change with height. The
featured chart presents the monthly distribution of the lapse rate
between 850 and 500 hPa (millibar) pressure levels for the Omaha
sounding site. This is roughly from a typical cloud base to midway
vertically through the cloud. When this lapse rate is below 6 °C
per kilometer, the atmosphere is in a stable condition meaning vertical
temperature gradients are not large enough to drive robust motions due
to buoyancy. When values are between about 6 and 9.5, the atmosphere
is conditionally unstable and vertical motions are likely to occur.
Values above about 9.5 are said to be absolutely unstable and vertical
mixing will happen quickly. The chart shows the strongest
instabilities during the summer season, which is also the time of year
for thunderstorms. Of course, there is a direct relationship between
thunderstorms and lapse rates. Stability increases (lower lapse rate)
in the winter time and so we see fewer thunderstorms. For comparison,
recent lapse rates have been in the mid 5s, which is not high enough
for robust storms.
The featured chart shows the daily climatology of growing degree days
along with the actual values for 2013. The past three weeks have been
a struggle with most days only accumulating 10-20 units. Given the
late planting dates for crops in the state, having cool weather this
time of year is actually the better of two evils. Having hot weather
and little precipitation would have imposed heat stress on the crop.
Instead the cool and dry weather has allowed the crop to limp along as
it matures. While the near term benefits of cool weather are good, an
early fall frost is of now of concern more than ever.
While up to three inches of rain fell on Thursday over a few counties
in southwestern Iowa, the rest of the state, including Des Moines, got
a big fat zero! It seems like Des Moines has missed out on the
rainfall events this summer and the featured chart illustrates it. The
chart shows the percentage of days during Jun, Jul, and Aug where some
location in the state picked up an inch of rain and Des Moines reported
over 0.5 inch as well on the same day. The percentage this year is the
lowest since 1951! While heavy rainfall events have occurred this
summer, some locations in the state, like Des Moines, have consistently
missed out. Some might call this being jinxed.
The Iowa State Fair wrapped up on Sunday with ten days of near perfect
weather. Humidity levels were low, temperatures were in the low 80s
for most days, and a northerly breeze blew. The featured chart looks
at the weather reported by the Des Moines weather station for the
period of the Iowa State Fair back to 1880. This year was actually
slightly warmer than last year for both high and low temperature! You
may recall that after a brutally hot July in 2012, the period of the
fair was very pleasant. The forecast has heat and humidity building
back this week.
More summer like conditions have finally returned to Iowa after a
number of weeks of very cool weather. The cool weather has provided a
substantial deficit of growing degree days. The featured chart shows
the number of days of given weather it would take to catch us back up
to average for GDD accumulation since 1 May. The green bars are for a
scenario whereby we accumulate 120% GDDs of average each day and under
such a scenario we only get back to average by the first of October!
The red bars assume daily record GDD accumulations based on long term
data and this unrealistic scenario only gets us back to average by the
first week of September. This deficit is not a terrible thing as the
crop growth situation in the state is very complex at the moment. The
cool weather was a good thing given the lack of rain for most of the
state as it mitigated water stress. While the weather turning warmer
will help GDDs and crop maturity, the lack of moisture will mean water
stress should dramatically increase. The further complication is that
very little corn was planted by 1 May, with most of it emerging by mid
to late May.
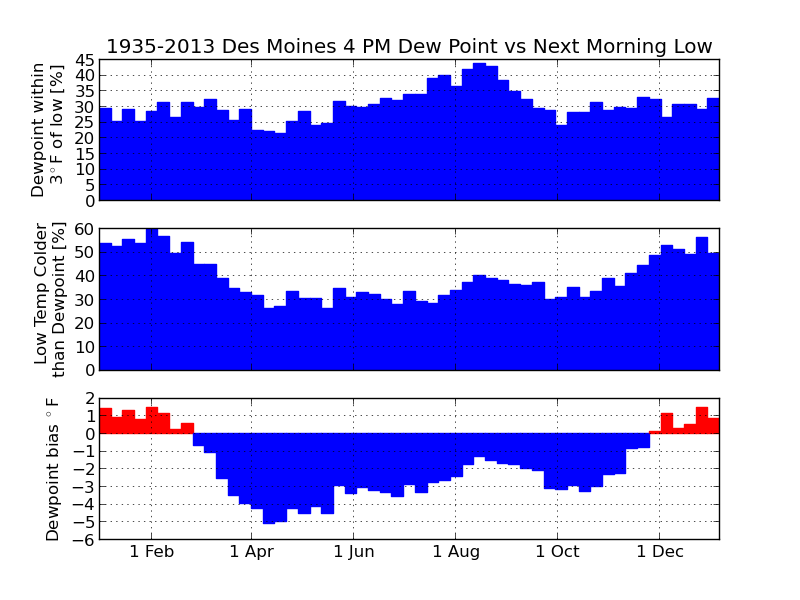
Warmer and muggier weather is back in Iowa with dewpoint temperatures
in the upper 60s and lower 70s. The increase in moisture means we are
done with the overnight lows in the 50s as the dewpoint puts a floor in
on how low the temperature can drop. The reason being that once the
air reaches saturation, fog will form and temperatures will be
stabilized as long wave radiation is absorbed and heat is released as
water vapor condenses. The featured chart looks at the relationship
between the 4 PM dewpoint temperature and then the morning low
temperature for the next day. The top chart shows the percentage of
days the low temperature is within 3 degrees of the 4 PM dewpoint. The
middle chart shows the frequency of the low temperature being colder
than the 4 PM dewpoint. The bottom chart shows the overall bias of the
dewpoint and the next day low temperature. The reasons that this
relationship does not always work include: winds can create mixing that
prevents temperatures from cooling to the dewpoint, clouds prevent heat
from escaping, and/or advection processes can transport more humid or
drier air masses changing the dew point overnight.
Yesterday's feature looked at the afternoon dew point being an
indicator of the next day's low temperature. The theory being that the
air temperature would cool off to the dew point temperature and thus be
the low temperature. Today's feature looks at the distribution of
dewpoint depression at the time of the daily low temperature for each
of the ASOS sites in the state. The dewpoint depression is simply the
difference between the air and dewpoint temperature. Differences
between sites are likely due to micro-climate effects as each ASOS has
different surroundings which include soil types, vegetation, and amount
of urban area / concrete around it. The chart shows a large difference
between Ames and Des Moines with the median dewpoint depression two
degrees less at Ames. The first guess explanation for this difference
is the larger urban heat island effect at Des Moines, which would tend
to keep the temperature higher and further away from the dewpoint than
surrounding locations. Also, the Ames ASOS is located in a topographic
depression which would promote cooler temperatures.
The updated US Drought Monitor released on Thursday shows most of west-
central and central Iowa in moderate drought status. The featured map
shows the drought monitor along with two day rainfall from our most
recent event. The heaviest totals were an inch or two and mostly
missed the D1 area. While this rainfall will not dent the drought as
we need an inch or two every week just to keep pace with climatology,
every little bit helps! The bad news is that our chances of widespread
rain are over for the immediate future and the weather is about to get
very hot, which is increase the stress on moisture starved plants.
The status of this year's corn and soybean crop is about to get very
interesting. The featured chart contains model estimates of soil
moisture within the top 1.5 meters of soil for a location near Rockwell
City. The cool weather of the past few weeks and the lone rain shower
earlier in August have bought some time for crops in this area, but the
available soil moisture is about gone and the hottest weather of the
year has arrived. Plants are not able to access all soil moisture
found within their root's reach, so while the chart does not show zero
for soil moisture it is practically that for the plant. The Rockwell
City area has been one of the driest locations since the first of July
with a total of only a half inch or so. Rainfall shows up in the chart
as brief upticks in soil moisture. The wet year of 2010 is shown for
comparison.
The featured chart shows NOAA estimated precipitation totals for August
through the 26th. Much of the southern half of the state is shown well
below an inch total for the month. The forecast has near zero hope of
precipitation for the next week, so these totals look to be it for
August. Today does look to be the hottest day of the period with
temperatures nearing 100 degrees.
The heat is on for late August with high temperatures nearing 100
degrees in Iowa. This hot weather is thanks to a strong ridge of
higher pressure centered just to our south. Ridge is a meteorological
term that describes an area of higher pressure that tends to create
sinking motions in the atmosphere and steer storm systems around it.
The featured map presents a composite of 18 August events where the
high temperature reached 100 degrees for Des Moines. The field plotted
is geopotential height at 500 millibars. This is a measure of the
depth of the atmosphere up to 500 mb. The composite field shows
approximately our current weather situation with a strong ridge
centered just to our south. The approximate geographic center of the
ridge is plotted on the map as an x for each case. Our weather will
remain hot and dry as long as the strong ridge remains in place.
The high temperature for Des Moines has reached 99 for each of the past
three days. This ties the longest streak of 99 for the site set in
July 1916. The featured chart presents the longest streak of
consecutive days at a given high temperature. Five days is the maximum
for any temperature. Hitting 99 again today is possible, but it would
appear the temperature will fall short of it by a few degrees.
The featured chart displays the ratio of total statewide averaged
precipitation in April and May to that in July and August of the same
year. The ratio this year is well over four meaning that four times as
much precipitation fell this April and May versus this July and August,
which is by far the largest ratio shown since 1893. The long term
average is close to one meaning these paired two months receive about
the same total, but the year to year variability is high. The good
news is that the heat looks to break in time for the start of
September, but significant rainfall is not expected.


